The World Bank indicator GNI per capita (current LCU) reports gross national income per person in each economy’s own local currency unit. That makes it useful when the goal is to express income in the same nominal unit used by domestic accounts, budgets, wages, and other local statistics. It does not create a common unit for comparing countries. A value measured in dollars, yen, rupees, won, dong, or rials cannot be placed on one numerical ranking without first addressing the currency difference.
The dataset contains the latest non-empty observation for 209 countries and areas. 182 observations are from 2025, 16 are from 2024, 4 are from 2020–2023, and 7 are from before 2020. The article therefore treats the file as a latest-available collection rather than a synchronized 2025 league table.
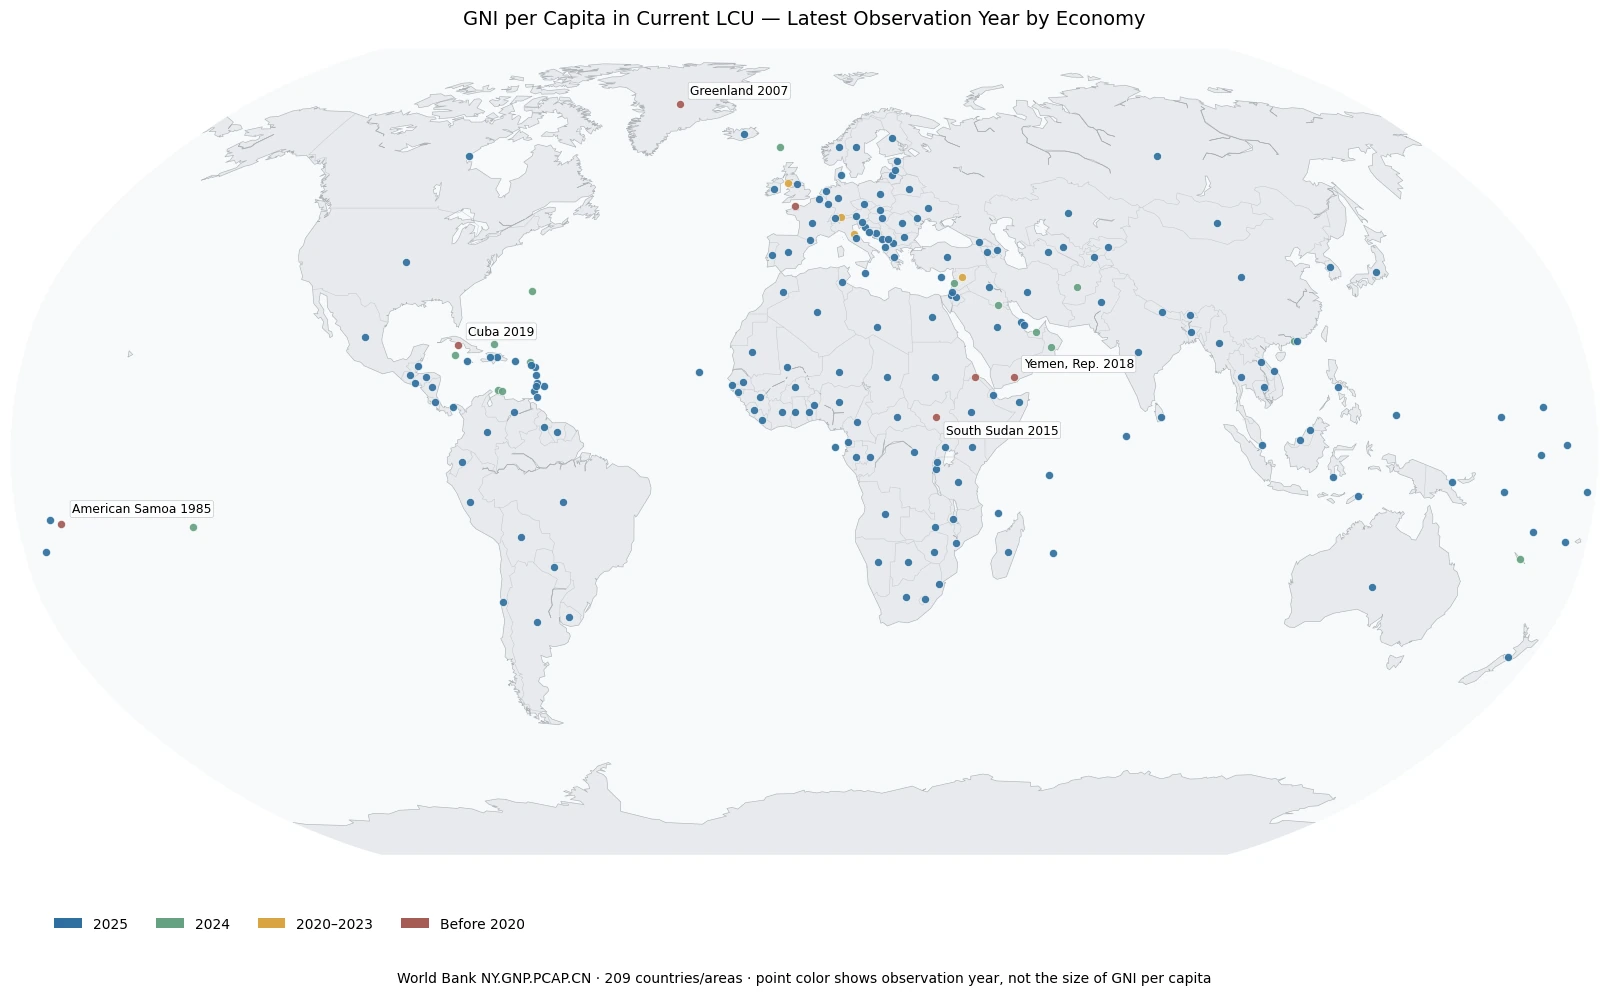
Table of Contents
What the indicator actually measures
Gross national income focuses on income accruing to residents of an economy. Conceptually, it starts from gross domestic product and adjusts for relevant income received from and paid to the rest of the world. Dividing that total by population produces a per-capita measure. World Bank code NY.GNP.PCAP.CN expresses the result in current local currency units.
The word current also matters. These are nominal values, not amounts adjusted to remove changes in domestic prices over time. Within one economy, a rising current-LCU figure can reflect a combination of changes in real income and changes in the price level. Currency reforms or redenominations can complicate a long time series as well. Because this file contains one latest observation per economy, it is not used here to estimate trends.
Why a raw cross-country ranking is misleading
The central problem is the unit. The United States is recorded in U.S. dollars, Japan in yen, India in rupees, Indonesia in rupiah, and so on. One unit of each currency does not have the same value. The number of digits in the reported amount therefore says very little about which economy has the higher income per person.
This is why the maximum and minimum raw numbers in the file should not be presented as a global ranking. A currency with many units per dollar can naturally produce a very large numerical figure, while a currency with a larger unit can produce a much smaller figure. Sorting those values would primarily mix monetary unit conventions with economic differences.
Eight 2025 examples show the unit problem
| Country or area | Currency code | GNI per capita (current LCU) | Observation year |
|---|---|---|---|
| United States | USD | 89,488.53 | 2025 |
| United Kingdom | GBP | 43,477.18 | 2025 |
| Japan | JPY | 5,719,986 | 2025 |
| Korea, Rep. | KRW | 52,416,056 | 2025 |
| India | INR | 233,055.23 | 2025 |
| Indonesia | IDR | 81,154,577 | 2025 |
| Viet Nam | VND | 122,894,045 | 2025 |
| Iran, Islamic Rep. | IRR | 2,907,887,547 | 2025 |
This table is not ordered as a ranking. It is a demonstration of why native-currency amounts cannot be read as if they shared one scale. The United States is about 89,489 in U.S. dollars, Japan about 5.72 million in yen, India about 233,055 in rupees, Indonesia about 81.15 million in rupiah, and Viet Nam about 122.89 million in dong. The much larger digit count in one row does not by itself imply higher income than another row.
The same caution applies to the very large nominal rial value reported for Iran. The figure is meaningful in the accounting unit used for that economy, but its raw numerical magnitude is not a measure of how many times richer it is than an economy whose local currency has a larger unit. A cross-country income comparison requires a common comparison framework.
Why the map shows observation year instead of value magnitude
A conventional choropleth would normally shade countries from low to high values. For this indicator, doing that would create a visually persuasive but analytically invalid ranking because the underlying values are denominated in different currencies. The map therefore encodes only observation recency. Its purpose is to show where the latest local-currency data are recent and where the latest available observation is old.
The largest group is the 182 economies with 2025 observations. Another 16 have 2024 values. Only 4 fall in 2020–2023, while 7 predate 2020. American Samoa is the oldest observation at 1985; Greenland and the Channel Islands are from 2007; Eritrea is from 2011; South Sudan from 2015; Yemen from 2018; and Cuba from 2019. Those dates are material limitations when someone wants a current global comparison.
Different observation years add a second comparability problem
The dataset uses the most recent non-empty value available for each economy rather than forcing one common year. This is often a practical way to maximize geographic coverage, but it means that year must remain visible whenever values are discussed. A 2025 nominal local-currency amount and a 2007 nominal local-currency amount differ in both currency unit and time.
Nominal measures are especially sensitive to the passage of time because inflation changes the number of local currency units associated with the same quantity of goods and services. A stale observation may also predate major economic shocks or currency changes. That does not make the historical value wrong; it means it answers a different time-specific question.
When current local-currency GNI per capita is useful
The indicator is useful when the analytical question is domestic. It can be paired with other statistics expressed in the same local currency, used to describe national accounts in familiar monetary units, or referenced in local policy and budget discussions. In those settings, keeping the measure in the domestic unit can be clearer than converting it to an external currency.
It can also be useful as an input to an within-country time-series workflow, provided the analyst chooses the correct nominal or real series and handles any currency changes carefully. Current LCU is appropriate when nominal monetary values are the object of interest. It is less appropriate when the purpose is to isolate real growth over long periods.
What to use for cross-country income comparisons
For cross-country comparisons, the first step is to choose a common basis. A series converted into a common currency can make nominal amounts numerically comparable, although exchange-rate movements can affect the result. A purchasing-power-based measure can focus more directly on differences in price levels and the quantity of goods and services that incomes can buy. Those approaches answer related but different questions.
The choice should follow the user’s question. If the question is “How is GNI per person expressed in this economy’s own currency?”, current LCU is the direct measure. If the question is “Which country has higher income per person on a common scale?”, a common-currency or purchasing-power measure is more appropriate. Treating those indicators as interchangeable can produce misleading conclusions even when every underlying number is correct.
Does using the same currency solve everything?
Economies that use the same currency remove the most obvious unit mismatch. Comparing two euro-denominated observations from the same year, for example, is more interpretable than comparing yen directly with euros. Even then, nominal income per person is not a complete measure of living standards. Price levels, the structure of the economy, cross-border income flows, and other differences still matter.
A shared currency therefore improves unit comparability but does not automatically create a purchasing-power comparison. The right adjustment depends on whether the intended interpretation is nominal income, real income, or living-standard purchasing power.
Four checks before using the figures
First, identify the currency unit. Second, check the observation year. Third, confirm whether the series is current-price or inflation-adjusted. Fourth, decide whether the task is domestic description or cross-country comparison. These four checks prevent the most common mistake with current-LCU data: treating a large native-currency number as evidence that an economy is richer than another one.
The file is kept in its original reported units. Missing observations are not filled with zero, and the map does not convert or normalize values behind the scenes. This preserves the meaning of the source series while making its limitation visible instead of hiding it inside a visually attractive but invalid global ranking.
Source and scope
The source is the World Bank indicator “GNI per capita (current LCU),” code NY.GNP.PCAP.CN. The verified file contains 209 countries and areas, one latest non-empty observation for each. Observation years range from 1985 through 2025. Because values are expressed in each economy’s current local currency unit, they should be interpreted in that domestic monetary context rather than ranked directly across countries.
Frequently Asked Questions
Does a larger current-LCU number mean a country is richer?
No. Countries use different currency units, so the raw numerical size can mostly reflect the denomination of the local currency rather than a comparable difference in income per person.
Are all observations from 2025?
No. 182 observations are from 2025 and 16 are from 2024, while the full year range is 1985–2025. The file uses the latest available non-empty value for each economy.
What should I use for cross-country income comparisons?
Use a measure expressed on a common comparison basis, such as a common-currency or purchasing-power-based series. The best choice depends on whether the question is about nominal exchange-rate values or purchasing power.
Related Articles
Green Map creates custom-edited map images using open geographic data sources such as geoBoundaries, Natural Earth, OpenStreetMap, and government open data.
These maps are edited visual materials, not raw data files, and are provided for education, documents, presentations, and graphic reference.