Population density varies enormously across Norway’s municipalities. Using the 2026 Statistics Norway observations for the 357 named municipalities, the median is only 8 people per square kilometre of land area, while Oslo reaches 1,709. The simple municipal mean is 53.4 people per km²—more than six times the median—because a small group of very dense municipalities pulls the average upward.
The measure used here is population per square kilometre of land area, not population divided by total administrative area including water. The reference date is 1 January 2026, and the published values are whole numbers. Very sparse municipalities can therefore appear as 0 or 1 person per km² even though they clearly have residents; a published zero in this table is not the same thing as a missing value or a population of zero.
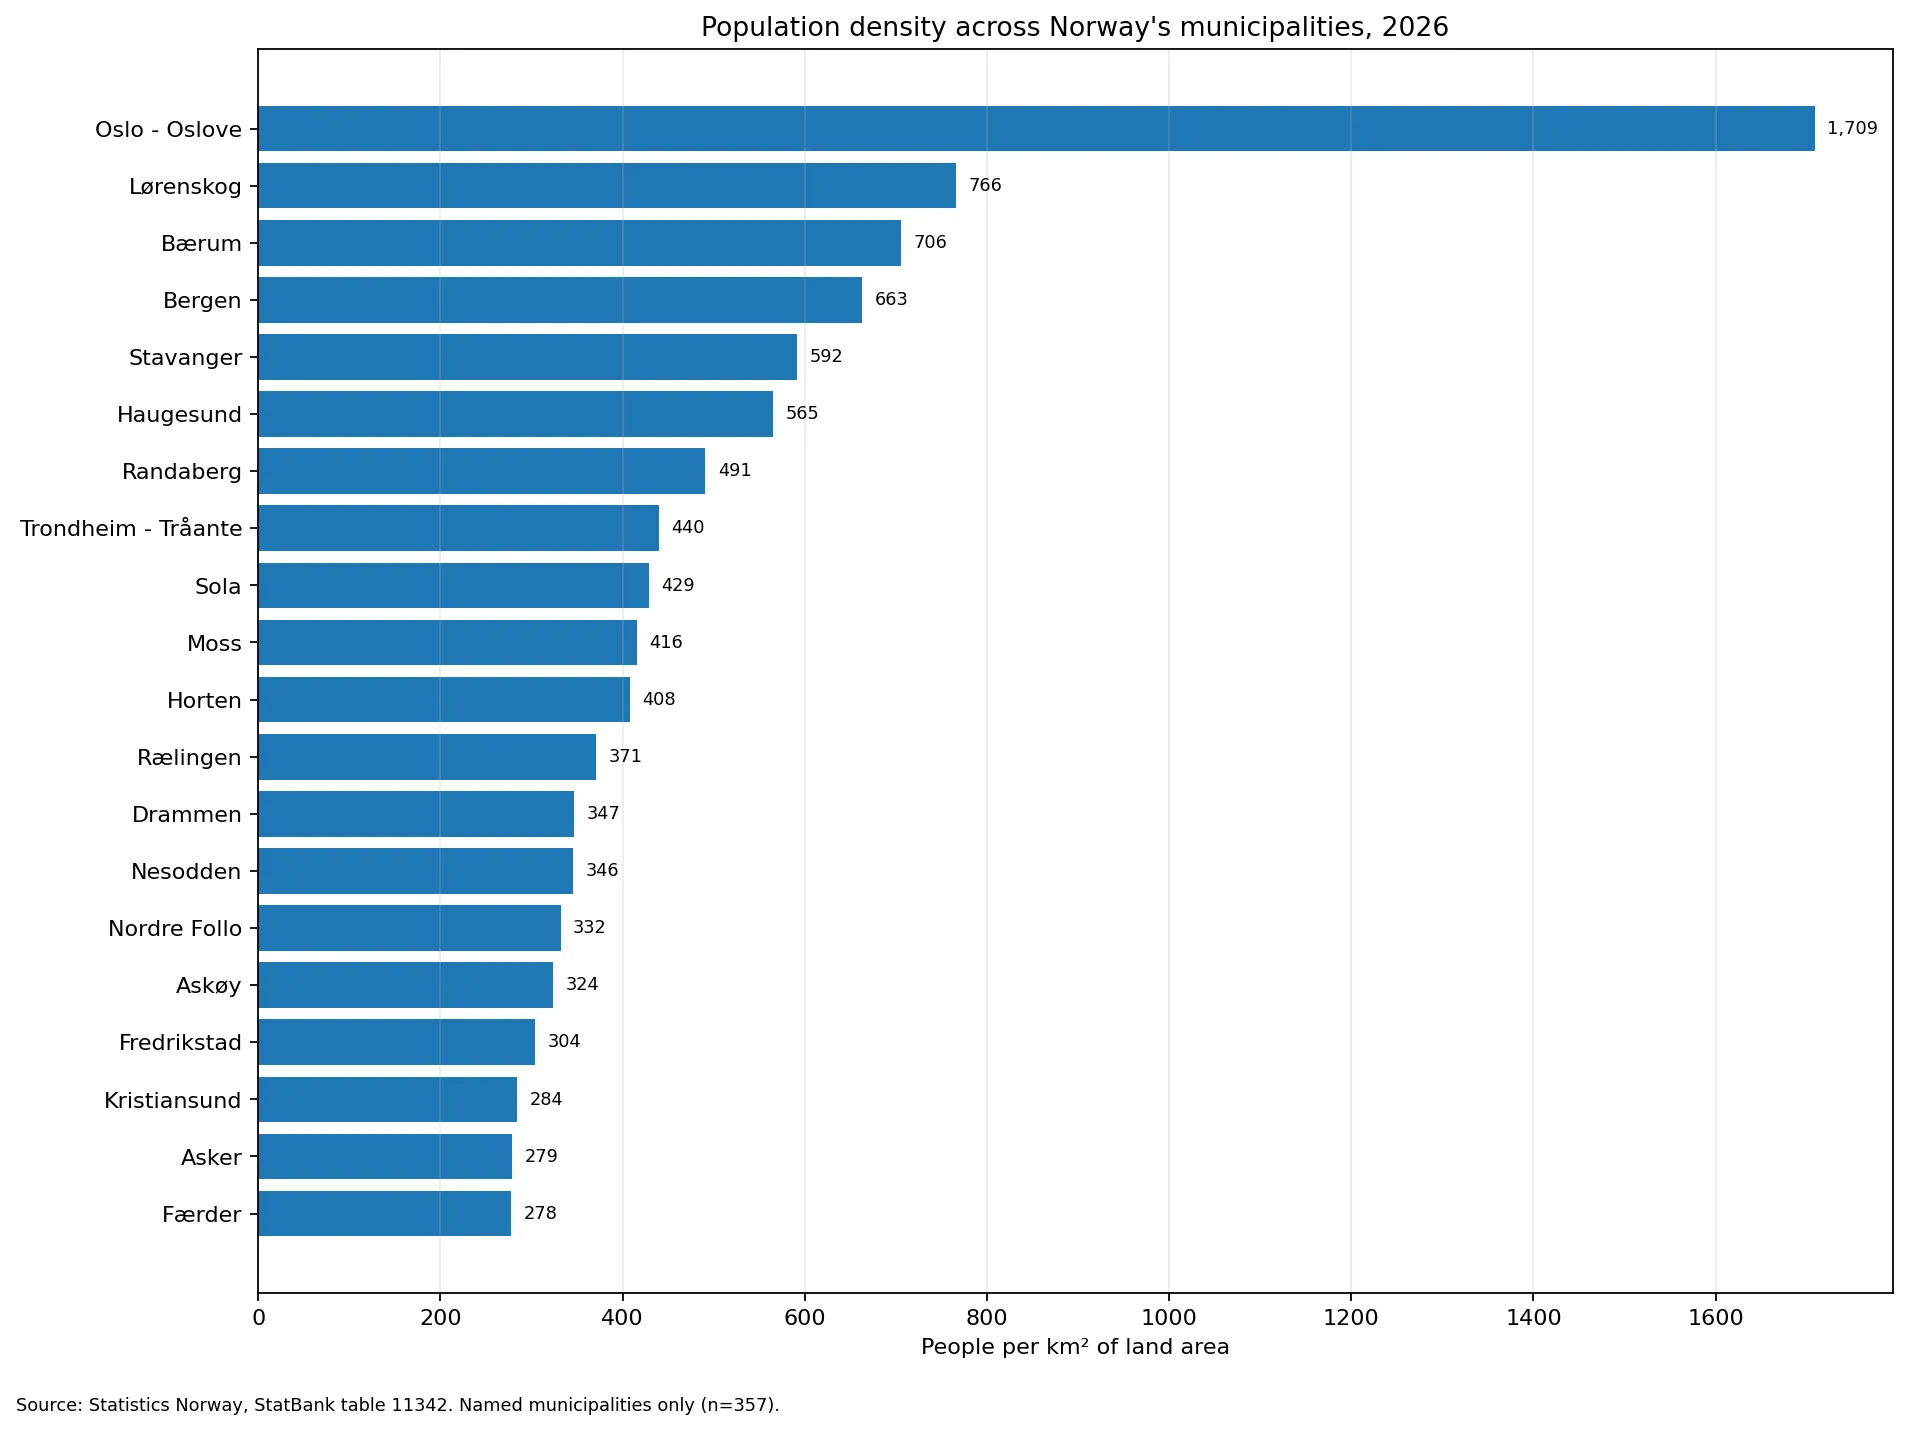
Table of Contents
How wide is the 2026 municipal population-density gap?
Across the 357 named municipalities, the published values range from 0 to 1,709 people per km². The first quartile is 3, the median is 8, and the third quartile is 36. In practical terms, half of the municipalities lie roughly between 3 and 36 people per km², and three quarters are at or below 36. Only 42 municipalities reach 100 or more, and just six reach 500 or more.
That shape makes the mean of 53.4 people per km² a poor description of a typical municipality. Oslo at 1,709, Lørenskog at 766, Bærum at 706, Bergen at 663, Stavanger at 592, and Haugesund at 565 create a long upper tail. For describing the centre of this municipality-level distribution, the median of 8 is much more representative than the mean. The mean is still useful as a mathematical summary, but it should not be mistaken for Norway’s national population density.
The most densely populated municipalities
Oslo is the clear outlier at the top. Its 1,709 people per km² is more than twice Lørenskog’s 766. Bærum follows at 706, Bergen at 663, Stavanger at 592, and Haugesund at 565. Randaberg, Trondheim, Sola, Moss, Horten, and Rælingen form the next group, all above 350 people per km².
| Municipality | People per km² of land area |
|---|---|
| Oslo – Oslove | 1,709 people/km² |
| Lørenskog | 766 people/km² |
| Bærum | 706 people/km² |
| Bergen | 663 people/km² |
| Stavanger | 592 people/km² |
| Haugesund | 565 people/km² |
| Randaberg | 491 people/km² |
| Trondheim – Tråante | 440 people/km² |
| Sola | 429 people/km² |
| Moss | 416 people/km² |
| Horten | 408 people/km² |
| Rælingen | 371 people/km² |
Even within the high-density group, the range is substantial. Færder, the twentieth-highest municipality in the data, is at 278 people per km², while Oslo is more than six times higher. This is why a single threshold such as 100 people per km² hides much of the upper-end variation. Separating 250, 500, and 1,000-plus bands gives a more informative picture.
Most municipalities are in low-density bands
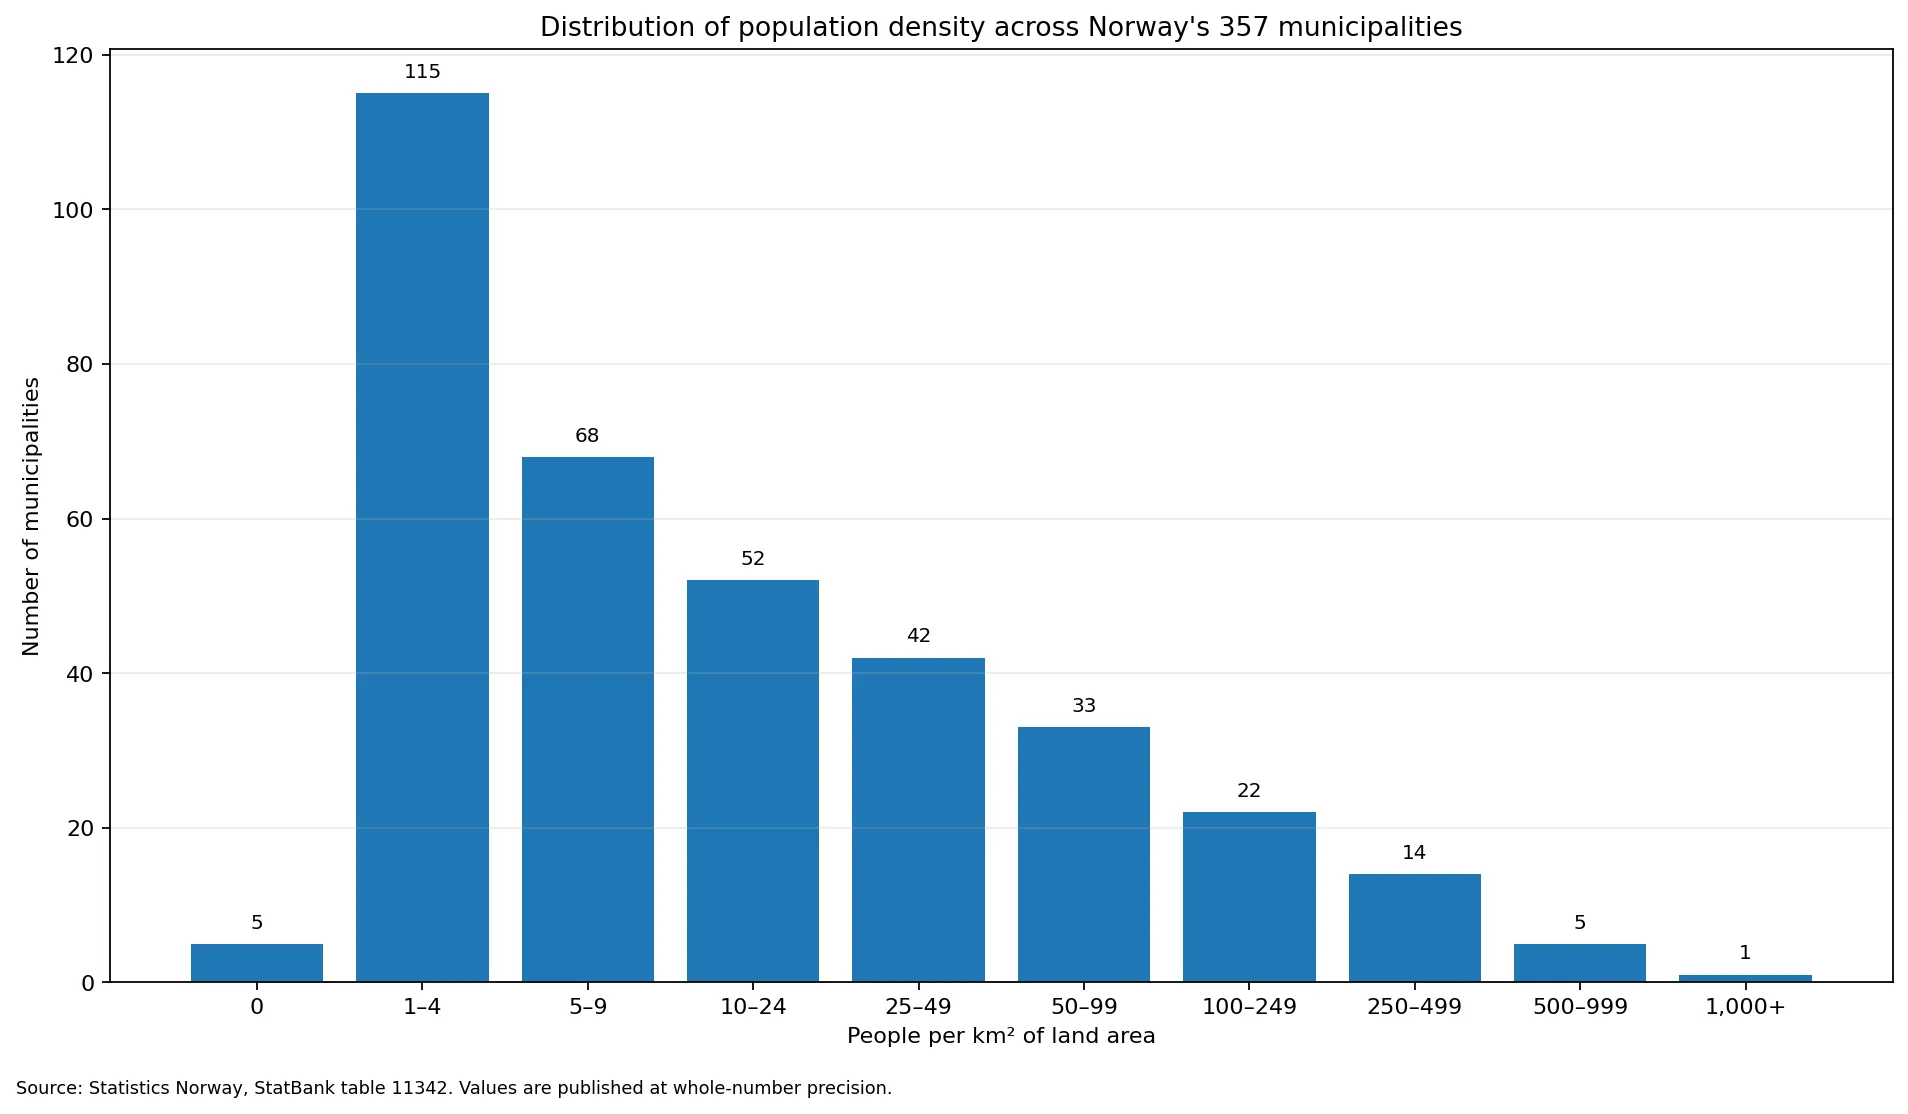
The majority of municipalities sit at the low end of the distribution. A total of 189 of the 357 named municipalities are below 10 people per km². The 1–4 band alone contains 115 municipalities, and another 68 are in the 5–9 band. At the other end, only 20 municipalities are at 250 or above, six are at 500 or above, and Oslo is the only municipality above 1,000.
| Density band (people/km²) | Municipalities |
|---|---|
| 0 | 5 |
| 1–4 | 115 |
| 5–9 | 68 |
| 10–24 | 52 |
| 25–49 | 42 |
| 50–99 | 33 |
| 100–249 | 22 |
| 250–499 | 14 |
| 500–999 | 5 |
| 1,000+ | 1 |
The band counts make the skew easier to see than the average does. There are 188 municipalities in the 0–9 range, compared with only 42 at 100 or above. The distribution therefore has many low values and a small number of very high values. When comparing Norway with another country, it is important to distinguish a distribution of municipality-level densities from a national density calculated as total population divided by total land area.
Published zeros are not missing observations
Five named municipalities—Lierne, Raarvihke – Røyrvik, Kárásjohka – Karasjok, Guovdageaidnu – Kautokeino, and Lebesby—have a published value of 0 people per km². These are not missing records. The dataset contains a value for every named municipality included in the analysis. Statistics Norway publishes this density measure at whole-number precision, so an extremely low density can be shown as zero after rounding.
Many other municipalities are published at 1 person per km², including Bindal, Vevelstad, Grane, Aarborte – Hattfjelldal, Beiarn, Sørfold – Fuolldá, Nore og Uvdal, Stor-Elvdal, Rendalen, Engerdal, Tolga, Folldal, Lesja, Skjåk, and Lom. The correct interpretation is that population is sparse relative to land area, not that these municipalities are empty.
Why the source file has 358 rows but the analysis uses 357 municipalities
The source extract contains 358 regional rows, but one of them is code 9999, labelled Unknown municipality. That row is a residual geographic category rather than a named municipality, so it is excluded from municipal rankings and summary statistics. The resulting comparison covers 357 named municipalities. Statistics Norway’s 2026 administrative-divisions statistics also report a total of 357 municipalities.
Treating all 358 rows as municipalities would introduce a non-municipal category into the minimum, rank list, and distribution counts. The numerical effect on the mean is small, but the geographic definition would be wrong. For regional statistics, keeping the unit of analysis clean matters more than preserving every row mechanically.
How to read a land-area population-density measure
- The denominator is land area. A measure based on total administrative area including inland or coastal water can produce different density values.
- Municipal boundaries matter. Mergers, splits, and boundary adjustments can change density even when population changes little, so historical comparisons should use compatible geography.
- A high population density does not by itself measure urbanisation, housing density, building height, transport use, or economic activity. It is simply population divided by land area.
- A low density can result from a large land area, a small population, or both. Population counts and land area should be examined separately when explaining why a municipality is sparse.
- Whole-number precision matters near the bottom of the ranking. Values shown as 0, 1, or 2 people per km² do not reveal the finer decimal differences among very sparse municipalities.
Why Oslo changes the mean so much
Oslo is the only municipality above 1,000 people per km², at 1,709. Because the municipal mean gives each municipality one equal-weight observation, Oslo and other dense municipalities have a large influence on the arithmetic average. The mean is 53.4 while the median is only 8, a gap of more than 45 people per km². That contrast is direct evidence of a strongly right-skewed distribution.
The 53.4 figure should not be quoted as Norway’s national population density. A national density needs a population-weighted geographic calculation: total population divided by total land area. Averaging the 357 municipal density ratios instead gives every municipality equal weight regardless of its population or land area. These are different statistics that answer different questions.
Data source and calculation notes
The primary source is Statistics Norway StatBank table 11342, using the 2026 value for ‘Population per km² land area’. Table 11342 also provides population, total area, and land area. This article uses the published municipal density observations and excludes only the code-9999 Unknown municipality category from municipality-level summaries.
The count of 357 municipalities was cross-checked against Statistics Norway administrative divisions. There are no missing density observations among the 357 named municipalities in the supplied extract. Means, medians, quartiles, density-band counts, and rankings were calculated directly from those 357 values. The five published zeros were retained as published; they were not converted to missing values or replaced with invented decimals.
Municipality-level population density is useful for seeing how concentrated or sparse settlement is relative to administrative land area, but it is not a direct measure of the density of built-up neighbourhoods. Large mountain, rural, or protected areas inside a municipality can lower its average density even if residents are concentrated in a small settlement. Conversely, a compact municipal boundary can create a high density. The denominator and the geography therefore belong in any careful interpretation.
Frequently Asked Questions
What is the median population density across Norway’s municipalities in 2026?
The median across the 357 named municipalities is 8 people per km² of land area. The mean is much higher at 53.4 because a small number of dense municipalities pull it upward.
Which Norwegian municipality has the highest population density?
Oslo is highest at 1,709 people per km² of land area, followed by Lørenskog at 766, Bærum at 706, and Bergen at 663.
Why are there 358 source rows but only 357 municipalities in the comparison?
One source row is code 9999, labelled Unknown municipality. It is a residual geographic category rather than a named municipality, so the municipality analysis uses the remaining 357 rows.
Do published values of 0 people per km² mean those municipalities have no residents?
No. Statistics Norway publishes this density at whole-number precision, so extremely low densities can be displayed as zero. These observations are not missing values.
Related Articles
Green Map creates custom-edited map images using open geographic data sources such as geoBoundaries, Natural Earth, OpenStreetMap, and government open data.
These maps are edited visual materials, not raw data files, and are provided for education, documents, presentations, and graphic reference.