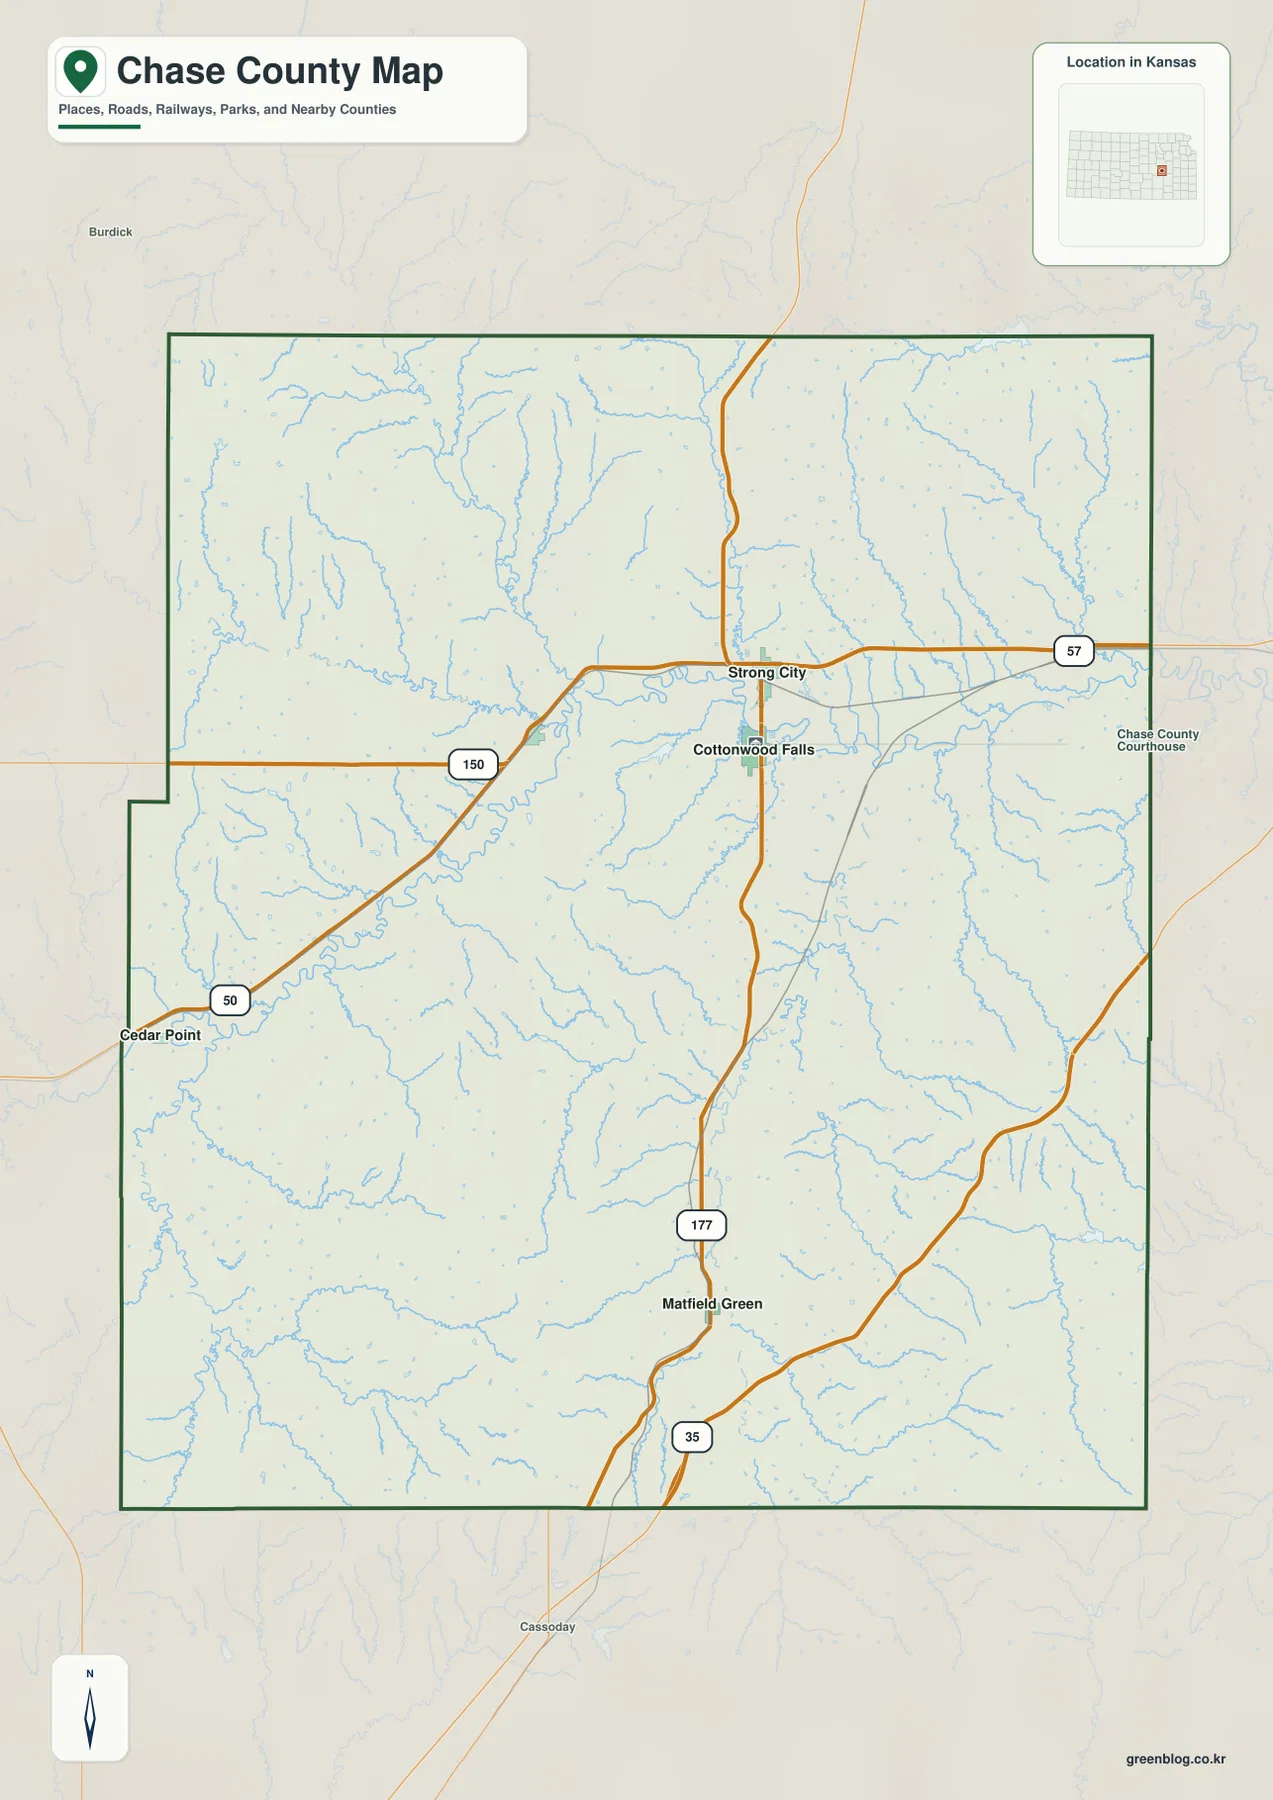
Chase County lies in the Flint Hills of east-central Kansas, and the easiest places to use as anchors on the map are Cottonwood Falls and nearby Strong City. U.S. 50 crosses the northern part of the county while K-177 runs south from the Strong City area toward Matfield Green, giving a clear framework for a county where settlements are small and widely spaced. This page includes a general county map, a ranked city map, a terrain-and-water map, and an elevation map. The matching high-resolution JPG files can be downloaded together from the download box below.
The county becomes much easier to understand when roads are compared with valleys and ridges. The Cottonwood River enters from the west and bends through the north-central part of the county near Cottonwood Falls and Strong City before continuing east. The South Fork Cottonwood River approaches from the south, and many smaller creeks cut narrow valleys into the surrounding uplands. On the supplied elevation map, Chase County ranges from about 341 to 505 meters with a mean near 416 meters, so the difference between green river bottoms and higher Flint Hills ridges is easy to see.
K-177 also connects the map to one of the county’s best-known landscapes. The National Park Service places Tallgrass Prairie National Preserve in northern Chase County about two miles north of Strong City along K-177. That makes the road, the river valleys, the small towns, and the surrounding grass-covered uplands part of one geographic story rather than separate map features. Looking at those relationships first gives a more useful introduction to Chase County than simply listing the four map types.
Table of Contents
Using Cottonwood Falls and Strong City to orient the county
On the general map, Cottonwood Falls and Strong City form the clearest pair of reference points. Strong City sits close to the meeting of U.S. 50 and K-177, while Cottonwood Falls is just to the south near the Cottonwood River. U.S. 50 approaches from the west by way of the Cedar Point area and continues east across the northern third of the county. K-177 creates the strongest north-south line, running from Strong City through the interior toward Matfield Green. Once those two roads are located, the remaining towns and natural features are much easier to place.
Cedar Point appears close to the western county line, while Matfield Green is well to the south along K-177. K-150 enters the Strong City area from the west across rolling country, and K-57 continues eastward from the northern road network. Because the county is dominated by ridges and branching stream valleys, a place that looks close in straight-line distance may still depend on a limited set of connecting roads. For general orientation, the road pattern is therefore more useful than judging distance from the page alone.
The surrounding county labels add another layer of context. Morris County is north, Lyon County is east, Butler County is west, and Greenwood and Marion counties are along the southern and southwestern sides. These labels are useful for understanding regional position, but the map is intended for general geographic reference rather than parcel, ownership, or legal-boundary work. For a legal or property decision, a current county GIS or recorded survey should be used instead of a generalized county map.
A settlement pattern concentrated in the Cottonwood River corridor
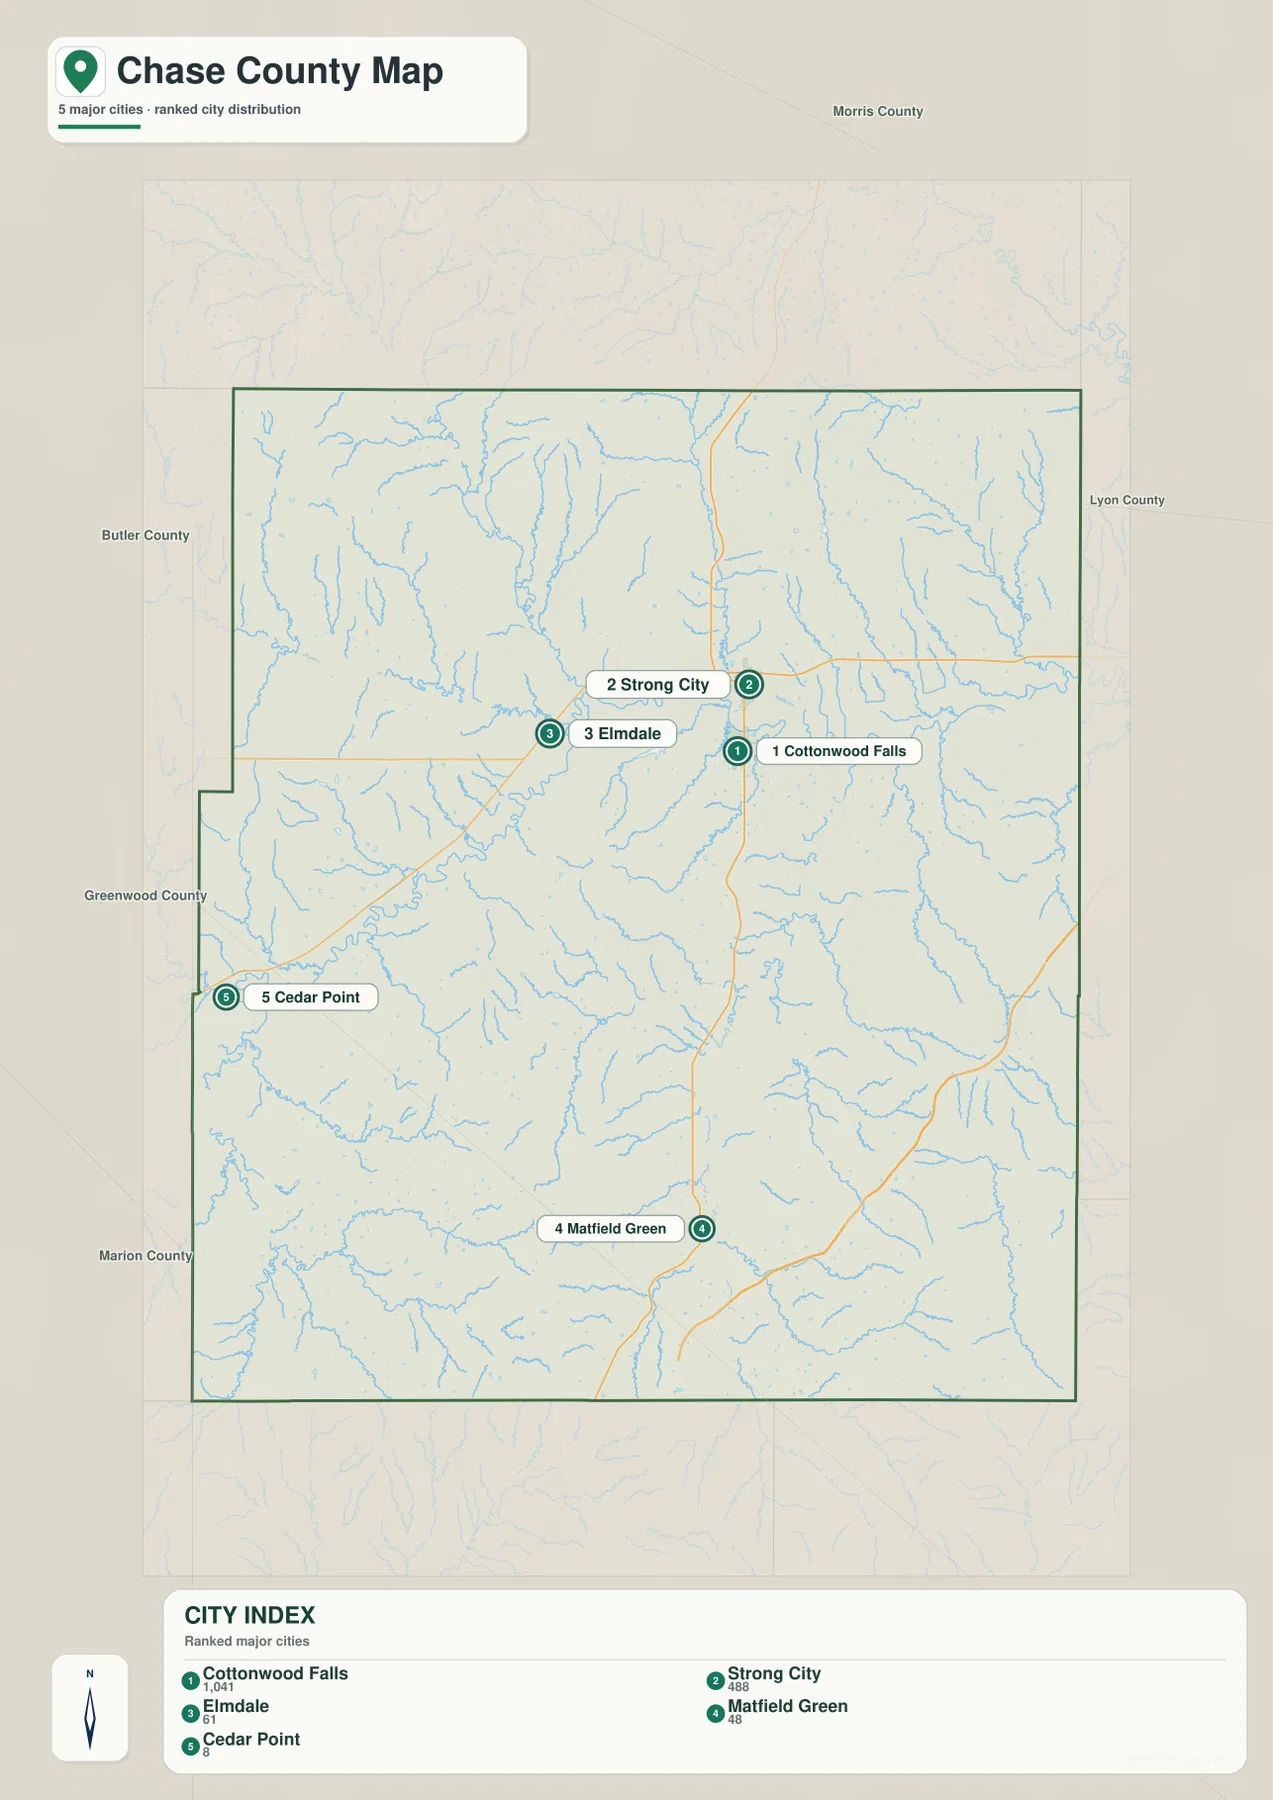
The ranked city map highlights five communities. The values printed on the map are Cottonwood Falls 1,041, Strong City 488, Elmdale 61, Matfield Green 48, and Cedar Point 8. These figures are best treated as the values used for the map’s relative ranking rather than as a substitute for the newest official population estimate. What matters visually is the sharp contrast between the two larger north-central communities and the very small settlements farther west and south.
Cottonwood Falls and Strong City are close enough to appear almost as a paired center, yet their positions differ in useful ways. Cottonwood Falls lies nearer the Cottonwood River, whereas Strong City is better positioned as a road reference near U.S. 50 and K-177. Elmdale is west of the pair along the U.S. 50 corridor, Cedar Point is farther toward the western edge, and Matfield Green stands apart in the southern half of the county. The result is not a continuous chain of towns but a small cluster in the north with isolated communities beyond it.
Comparing the settlement map with the water map helps explain the landscape around those places. Cottonwood Falls and Strong City are close to the broad Cottonwood River valley, and Elmdale is positioned between Middle Creek and the main river corridor. Much of the northwest and southeast has no similarly prominent settlement symbol even though it contains dense networks of small drainages. The maps do not prove that terrain alone determined settlement, but they do show that the most visible communities and the main transportation corridor are closely associated with lower valley terrain.
The city map is useful for relative scale and location, not for defining commuting areas, municipal service boundaries, or current demographic conditions. Population estimates change, and small communities can be especially sensitive to the year of the source. For current figures, consult the Census Bureau or local government. For this page, the ranked display is most valuable as a quick way to see where the county’s population centers sit in relation to roads, rivers, and the surrounding uplands.
Cottonwood River valleys and the branching creeks of the Flint Hills
The Cottonwood River is the dominant water feature on the terrain-and-water map. It crosses from the western side toward the north-central part of Chase County, makes pronounced bends near the Cottonwood Falls and Strong City area, and then continues toward the eastern boundary. Middle Creek enters the system from the west, while Diamond Creek, Fox Creek, Prather Creek, and Buckeye Creek descend through narrow northern valleys. Together these tributaries show how extensively the uplands are cut by drainage even where the general map appears relatively open.
South of the main river, the South Fork Cottonwood River creates another major valley extending northward through the county. Bloody Creek joins its eastern side, while Spring Creek and Rock Creek occupy the country between the South Fork and the main Cottonwood corridor. Farther southwest, Cedar Creek and Coal Creek form their own branching drainage lines. Near the southeast edge, North Branch Verdigris River appears as part of a different drainage direction, reminding the reader that Chase County is not shaped by a single river system alone.
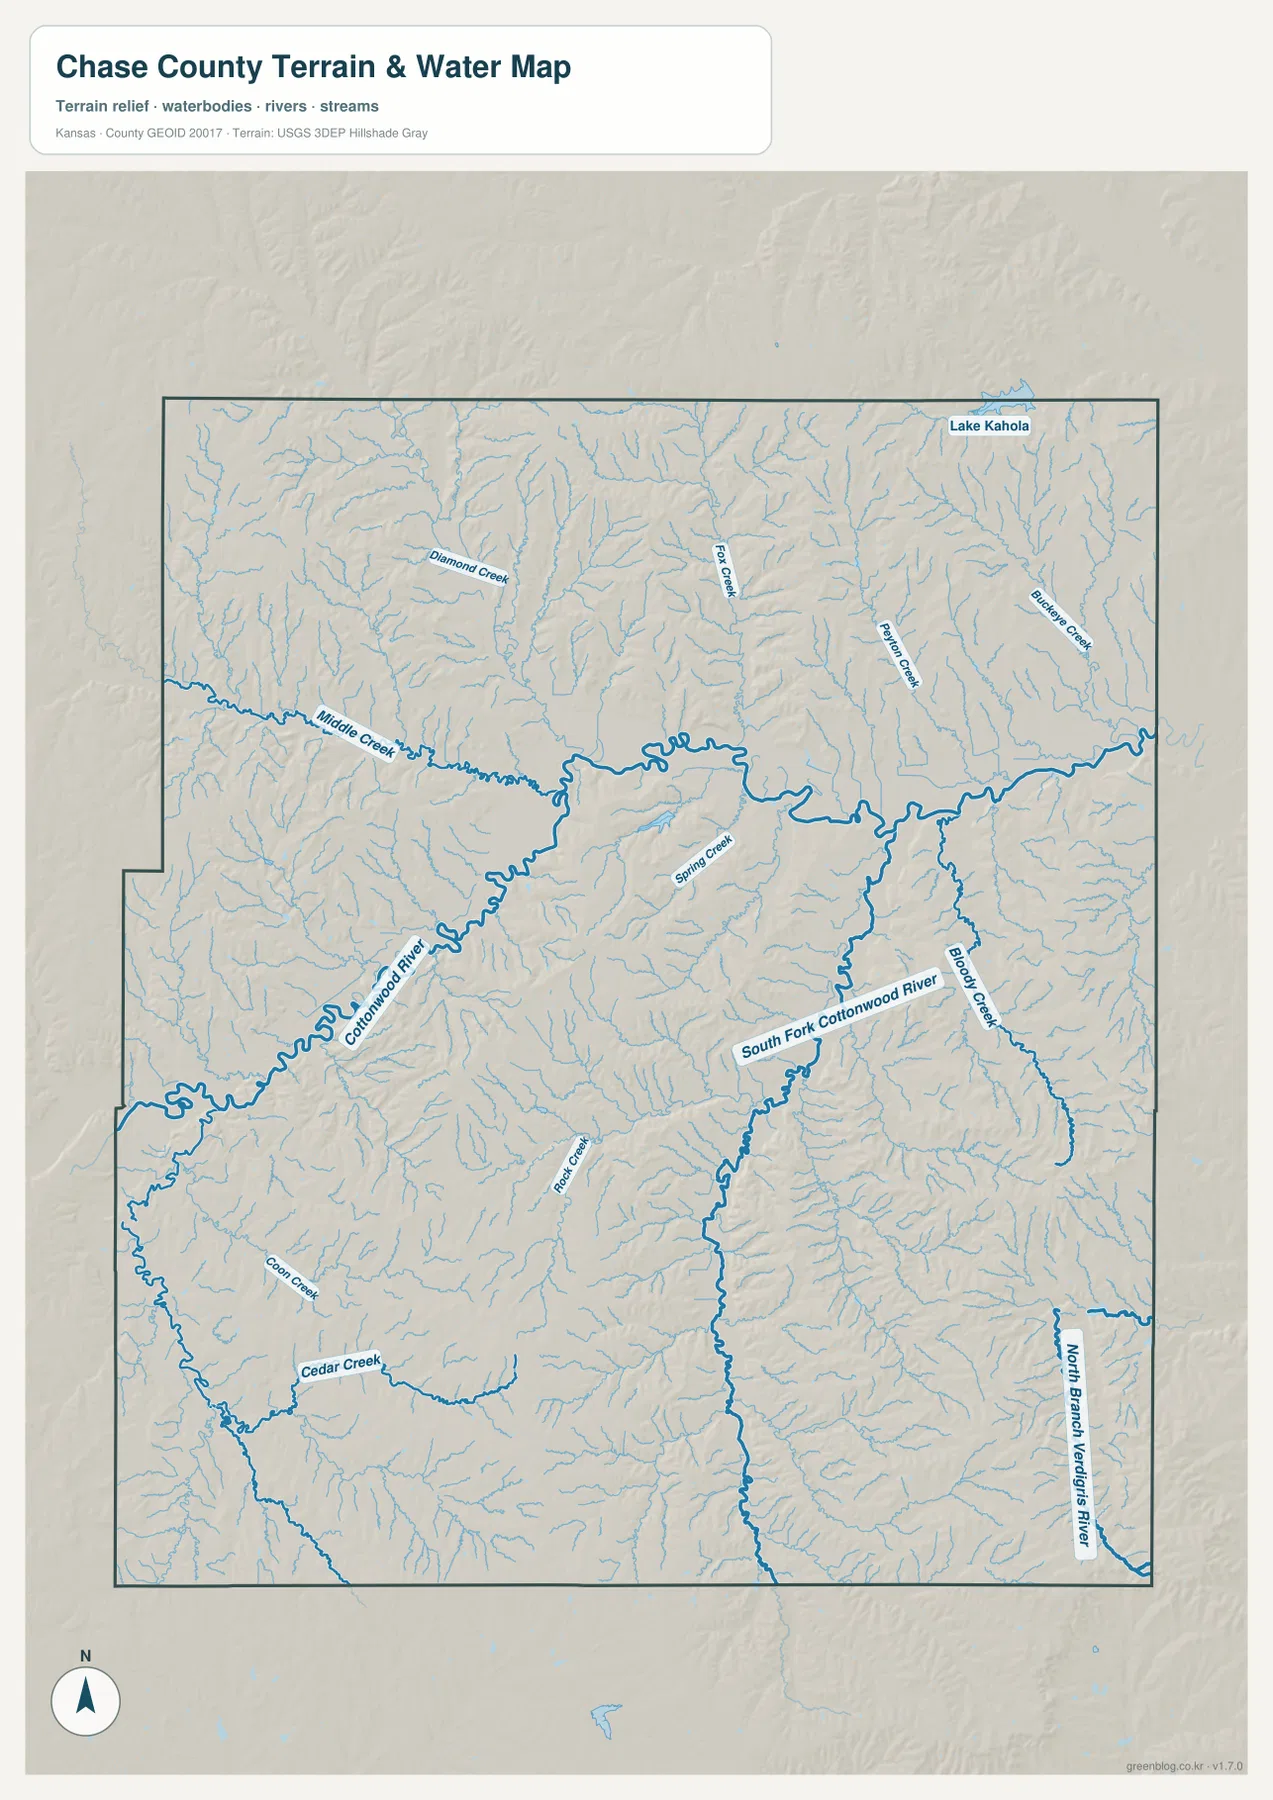
Lake Kahola is labeled near the northeastern edge, adding a visible lake to a map otherwise dominated by streams and river valleys. The map is not a real-time source for water levels, flood conditions, fishing rules, or public access. Anyone planning a visit to a river, lake, or trail should check current weather, road, land-access, and managing-agency information separately. Its best use here is to show where the major watercourses sit and how their valleys organize the county’s terrain.
The river network also clarifies the road map. The U.S. 50 corridor and the Cottonwood Falls-Strong City area lie close to the broad main valley, while many smaller roads enter side valleys or cross the ridges between them. In the south, K-177 runs through terrain influenced by the South Fork Cottonwood River and its tributaries. When the general and water maps are viewed together, the county’s road pattern looks less arbitrary and more closely connected to the physical shape of the land.
From 341 to 505 meters: ridges rising above the river bottoms
The elevation map reports an actual range of about 341 to 505 meters and a mean near 416 meters. The lowest terrain follows the Cottonwood River and South Fork Cottonwood River as long green corridors, while yellow and brown ridges rise between them. A vertical difference of more than 160 meters is substantial enough to give the county a strongly dissected appearance on the shaded-relief image. What can look like one broad grassland from a distance is actually a repeating pattern of upland ridges, short side valleys, and larger river bottoms.
The southeastern and northwestern portions contain broad areas of higher relief, while the north-central Cottonwood River corridor forms the most continuous low belt. The South Fork produces another green valley running from the south toward the center. Following K-177 from Matfield Green toward Strong City on the elevation map shows how a major road passes through a landscape that alternates between low drainage corridors and higher ridge country. This is one reason the terrain map adds so much information beyond a conventional road map.
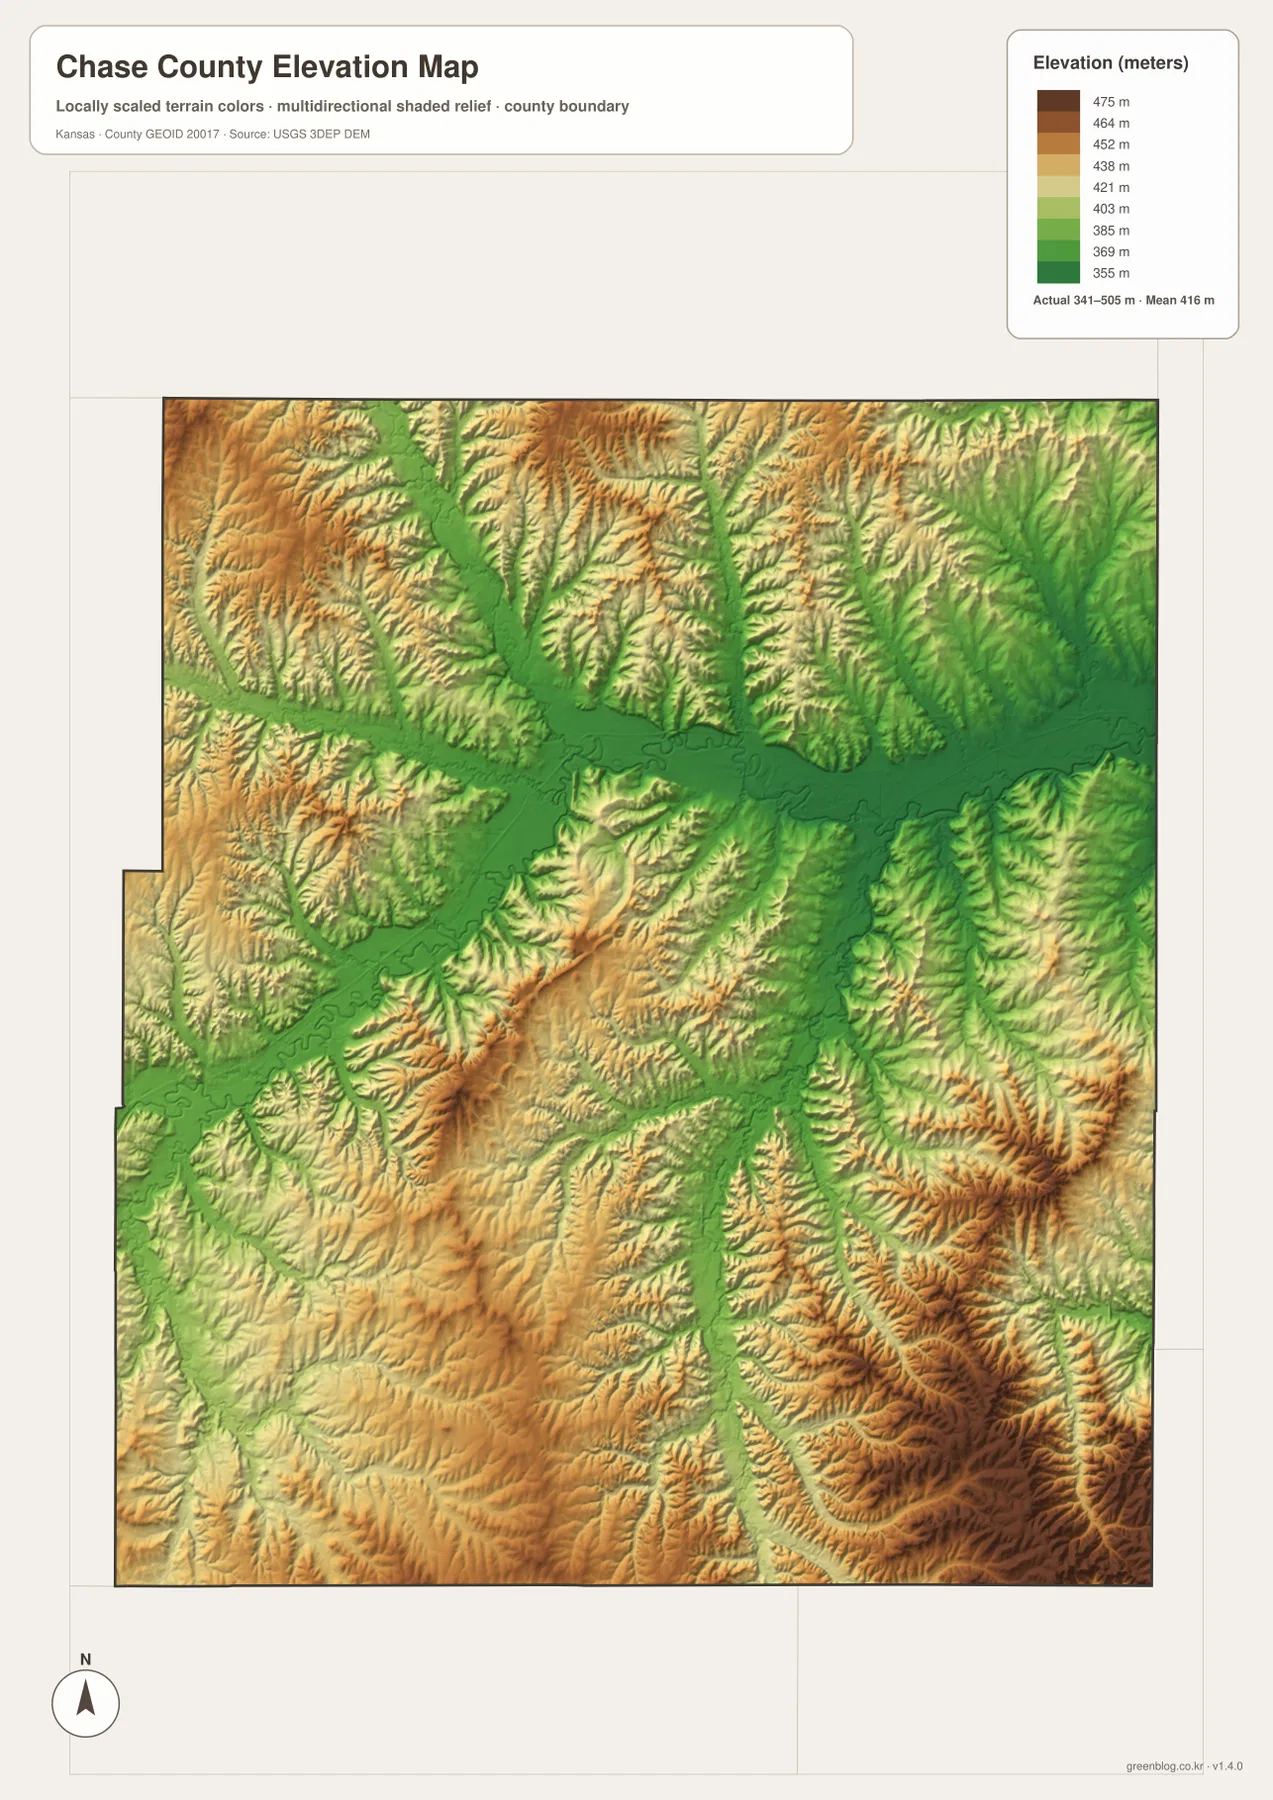
The colors and hillshade are intended to make broad differences easy to see. They should not be treated as survey-grade elevation for a building site, drainage design, or engineering calculation. Shaded relief can visually emphasize slopes, and the generalized raster does not replace a field survey. Where precise elevations matter, use the underlying USGS 3D Elevation Program data or a professional survey appropriate to the task.
K-177, Strong City, and the Tallgrass Prairie landscape
K-177 is especially useful because it connects the county map with the Tallgrass Prairie National Preserve. The National Park Service states that the preserve is in northern Chase County about two miles north of Strong City on K-177, close to the U.S. 50 intersection. Starting at Strong City on the general map and moving north along K-177 therefore gives a simple way to place the preserve within the larger county even though this map is not a detailed park map.
The preserve also gives context to the ridged appearance of the elevation map. The National Park Service describes it as protecting a nationally significant remnant of the tallgrass prairie ecosystem in the Kansas Flint Hills. On the county elevation map, the same regional setting appears as a dense pattern of uplands and stream-cut valleys. The page should not be used to locate individual preserve trails, parking areas, or access boundaries, but it is very useful for understanding why the preserve occupies a landscape that looks so different from a flat plains county.
South of Strong City, K-177 leads past Cottonwood Falls and continues toward Matfield Green through the interior of the county. U.S. 50, by contrast, provides the major east-west reference and connects the Elmdale and Cedar Point side of the map with Strong City. Seeing these roads alongside the river and elevation maps turns the county into a connected sequence of towns, valleys, scenic uplands, and open prairie rather than a collection of isolated labels.
Choosing the most useful map and working with the high-resolution files
The general map is the quickest choice for locating towns and highways. The ranked city map is better when the relative size and spacing of Cottonwood Falls, Strong City, Elmdale, Matfield Green, and Cedar Point are the main concern. The terrain-and-water map is the strongest option for following the Cottonwood River, South Fork Cottonwood River, and tributary valleys, while the elevation map is the clearest way to compare low river bottoms with higher Flint Hills ridges. Using two maps together is often more informative than trying to make one map answer every question.
The web previews are convenient for quick viewing, but the original JPG files are 2572 by 3638 pixels each. The larger files make it easier to inspect small stream labels, road numbers, bends in the Cottonwood River, and subtle elevation shading. For classroom work, a useful approach is to mark the towns and main highways on the general map, trace the rivers on the water map, and then use the elevation image to explain why the valleys and ridges look the way they do.
These maps are intended for geographic reference, study, presentations, and general printing. They do not replace live navigation, flood determinations, parcel maps, legal boundaries, engineering data, or property surveys. Road construction, river levels, preserve access, and other current conditions should always be checked with the responsible agency. Used within those limits, the set provides a compact way to understand one of the most distinctive Flint Hills counties in Kansas.
Frequently Asked Questions
Which map is best for finding Cottonwood Falls and Strong City?
The general county map is the fastest choice. Strong City is close to the U.S. 50 and K-177 junction, and Cottonwood Falls is just south near the Cottonwood River. If relative community size is also important, compare the ranked city map after locating the two towns on the road map.
Where do the lowest valleys and highest Flint Hills ridges appear?
The lowest terrain follows the Cottonwood River and South Fork Cottonwood River as green corridors. Higher yellow and brown ridges occupy much of the land between the drainages, with especially strong relief in the southeast and northwest. The supplied elevation map shows about 341 to 505 meters with a mean near 416 meters.
What is included in the downloadable ZIP?
The ZIP contains four high-resolution JPG files matching the general county map, ranked city map, terrain-and-water map, and elevation map shown on this page. Each original is 2572 × 3638 pixels, which is useful when small creek labels, road numbers, or terrain shading need to be enlarged.
Map File Information
The high-resolution JPG originals corresponding to the general county map, ranked city map, terrain-and-water map, and elevation map on this page are packaged together.
- File Type: ZIP containing 4 JPG files
Related Maps
Sources and reference links
For boundary and base geography, see the U.S. Census Bureau TIGER/Line Shapefiles. Water features can be checked against USGS National Hydrography, and elevation data against the USGS 3D Elevation Program. For county-specific Flint Hills context, use the National Park Service Tallgrass Prairie National Preserve site and its official directions page. The descriptions on this page focus on the towns, roads, water features, and elevation patterns that are visible in the supplied Chase County maps.
Green Map creates custom-edited map images using open geographic data sources such as geoBoundaries, Natural Earth, OpenStreetMap, and government open data.
These maps are edited visual materials, not raw data files, and are provided for education, documents, presentations, and graphic reference.