External resources flowing into national health systems differed sharply on a per-person basis in 2023. World Bank series SH.XPD.EHEX.PP.CD reports external health expenditure per capita in current international dollars at purchasing power parity. External sources include direct foreign transfers and foreign transfers distributed by government, covering financial inflows into the national health system from outside the country. The measure is therefore neither total health spending nor the percentage of health spending financed externally.
The latest-available extract contains 181 economies, but the observations are not from a single year. There are 171 observations for 2023, three for 2024, and seven from 2008 through 2022. Mixing them into one “latest” ranking would combine different price conditions, financing environments and reporting periods. The map, table, mean, median and rankings below therefore use only the 171 observations dated 2023.
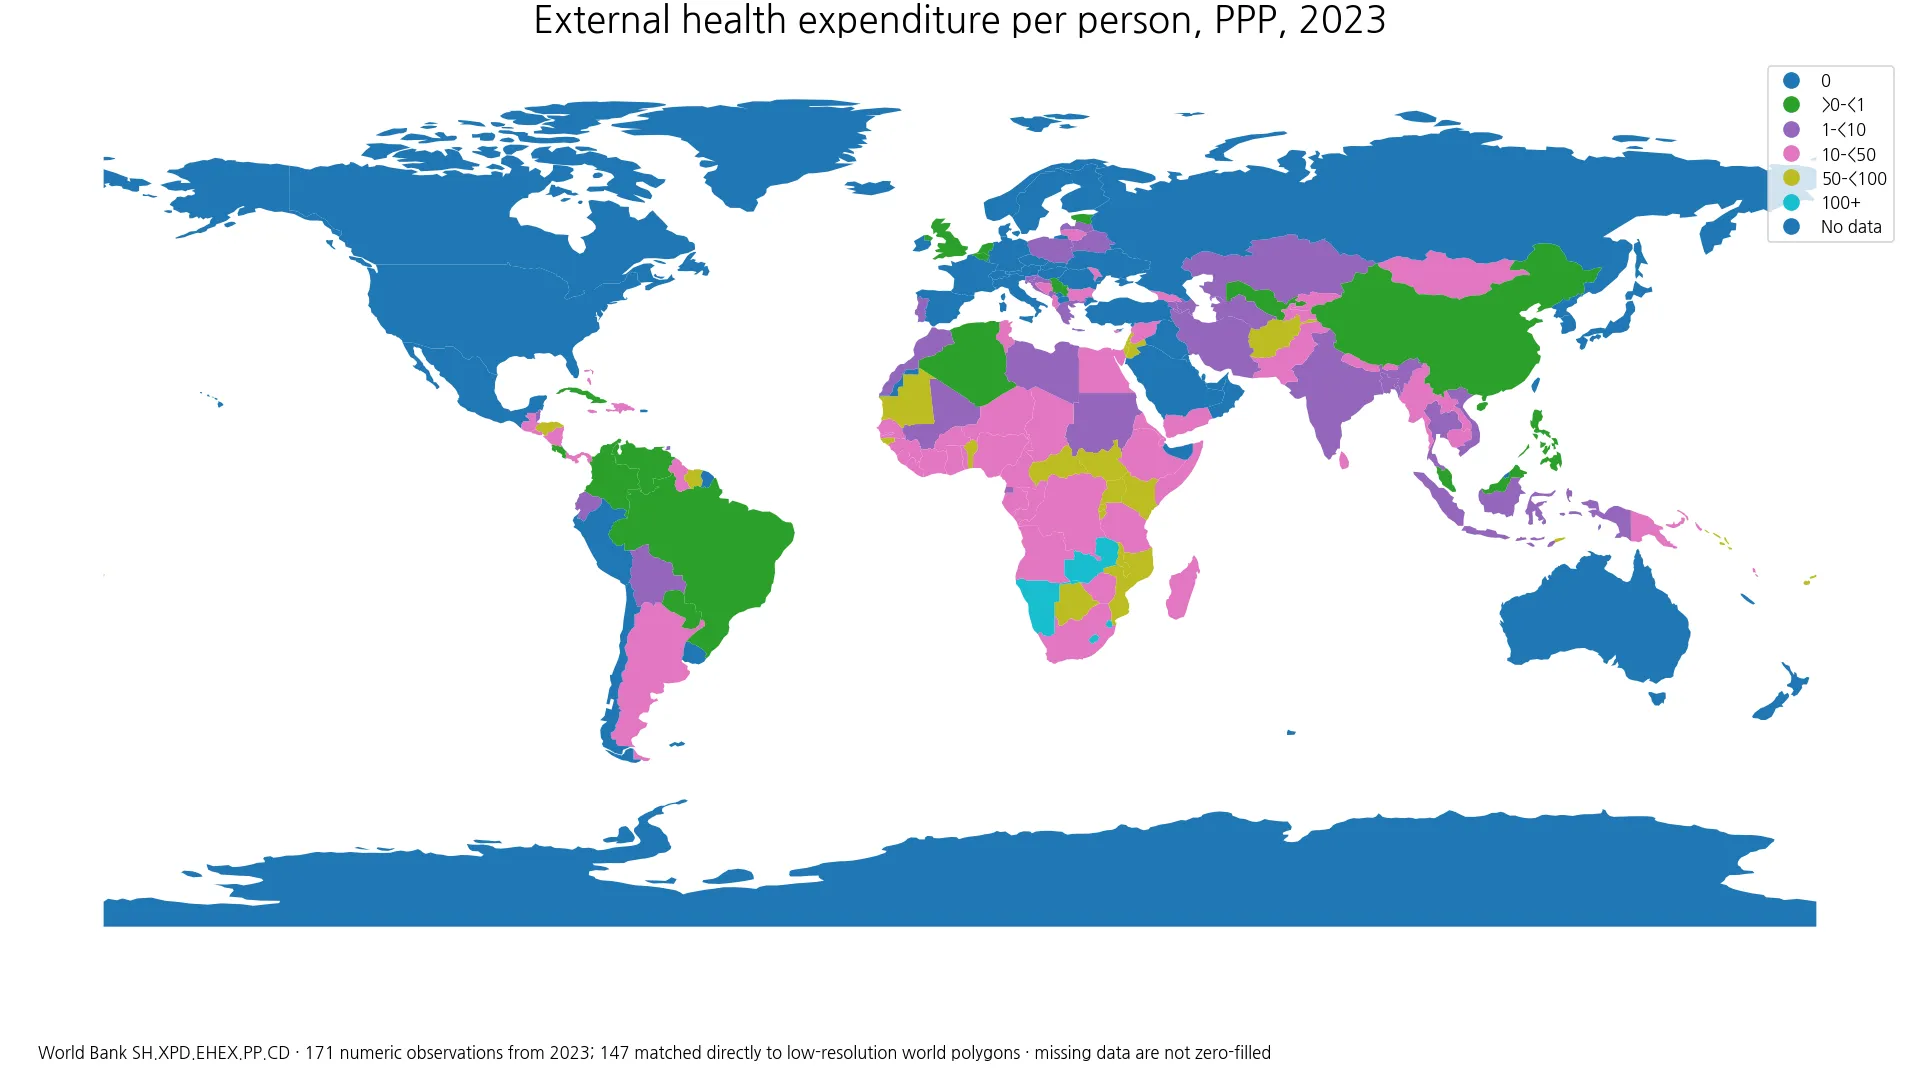
Table of Contents
The indicator is not a ranking of total foreign health aid
A per-capita PPP measure answers a different question from a country total. Purchasing power parity adjusts for differences in price levels so that an international dollar is a comparative unit of purchasing power rather than a currency that was literally transferred across borders. Values in current international dollars should not be read as market-exchange-rate US dollars. The adjustment is useful for comparing the approximate real scale of health resources available per resident across countries with very different domestic price levels.
The series also does not equal every foreign-aid commitment announced for a country. Its scope is financial inflows from outside the country into the national health system, including direct foreign transfers and foreign transfers administered through government. Donor commitments, project budgets, humanitarian operations, research funding and disbursements reported in other aid databases may follow different accounting rules or timing. Comparisons are most defensible when the same indicator and reference year are kept constant.
The median is 17.30 international dollars, far below the mean of 36.81
Across the 171 same-year observations, the median is 17.30 international dollars per person and the simple mean is 36.81. The first quartile is 1.36, while the third quartile is 43.48. The mean is more than twice the median because a relatively small group of countries records values above 100 and several exceed 300. The distribution is therefore strongly right-skewed, making the median a more useful description of a typical observation than the mean alone.
Twenty-six economies report exactly 0 in 2023, and 42 are below 1 international dollar per person. At the other end, 102 are at or above 10, 37 are at or above 50, and 11 reach 100 or more. Missing observations were never replaced with zero. A reported zero is a numeric value in the source, while a country without a 2023 observation remains outside the same-year statistics and is shown as no data on the map.
| PPP international dollars per person | Countries/economies |
|---|---|
| 0 | 26 |
| >0–<1 | 16 |
| 1–<10 | 27 |
| 10–<50 | 65 |
| 50–<100 | 26 |
| 100+ | 11 |
The highest per-person values are concentrated among several small Pacific states and parts of Southern Africa
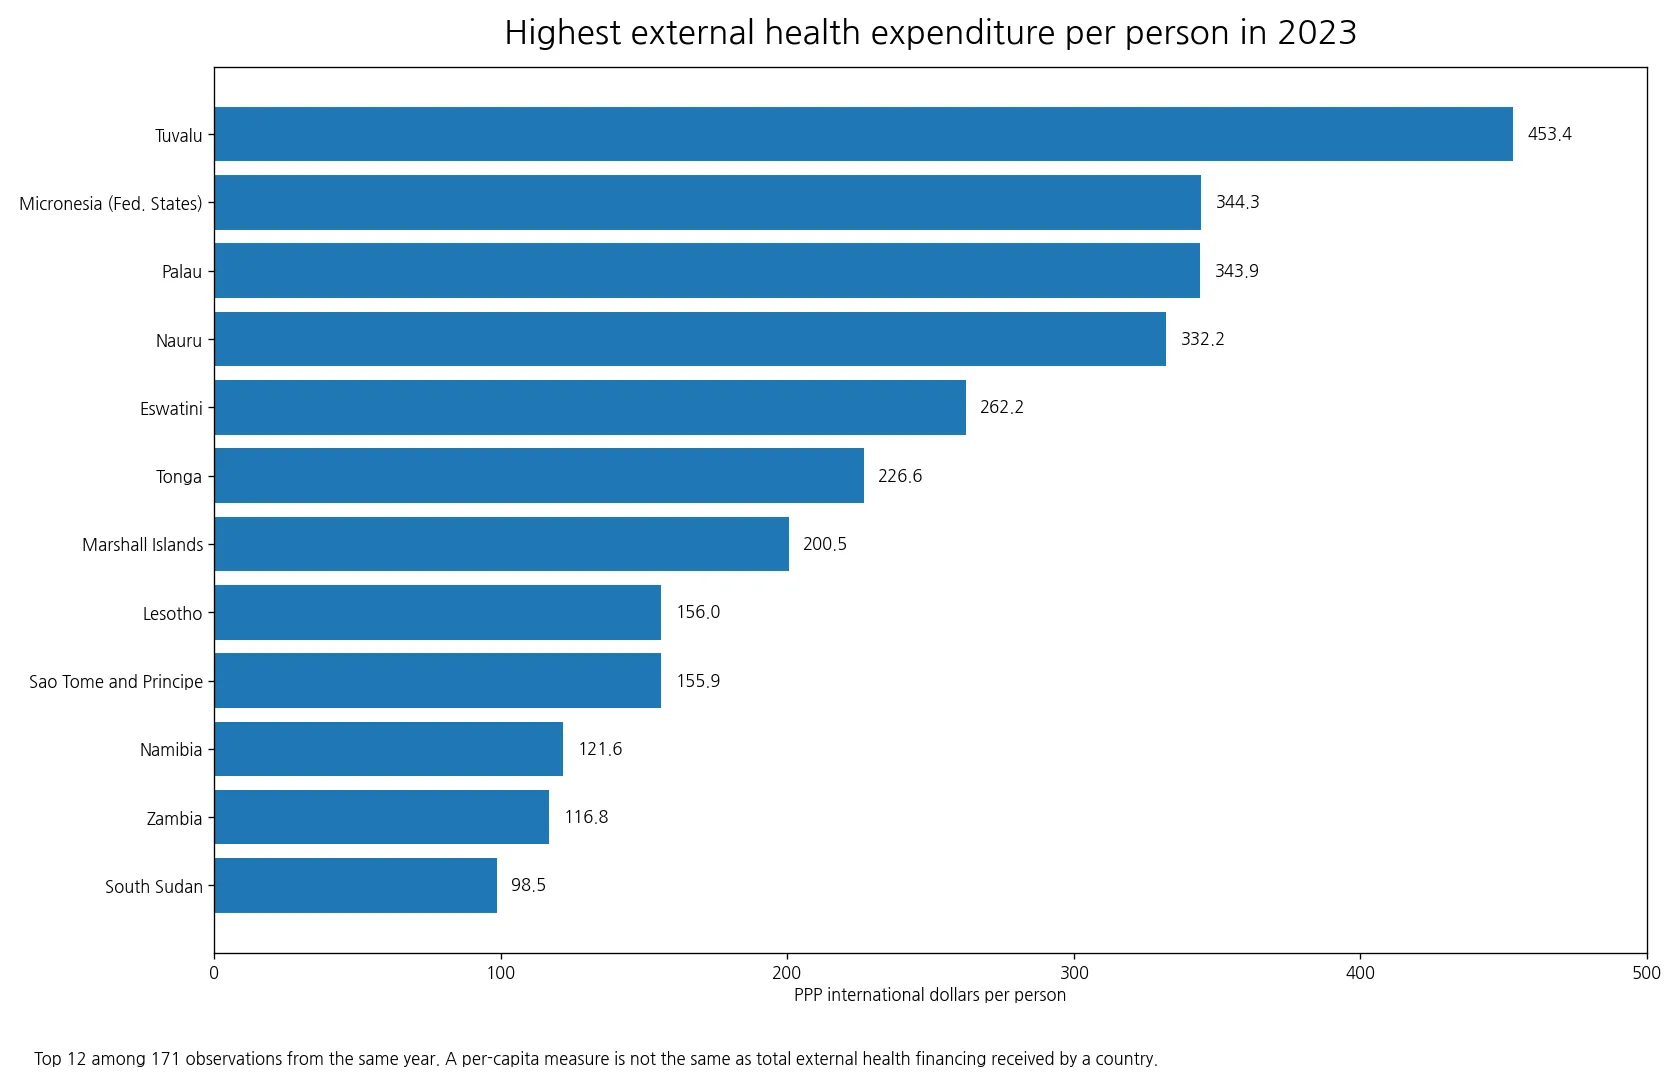
Tuvalu records the highest 2023 value at 453.38 international dollars per person. It is followed by the Federated States of Micronesia at 344.31, Palau at 343.88, and Nauru at 332.18. Eswatini reaches 262.22, Tonga 226.59, and the Marshall Islands 200.49. Lesotho and São Tomé and Príncipe are both near 156, while Namibia reaches 121.64 and Zambia 116.77. South Sudan is just below 100 at 98.47.
| Country/economy | 2023 PPP international dollars per person |
|---|---|
| Tuvalu | 453.38 |
| Micronesia (Fed. States) | 344.31 |
| Palau | 343.88 |
| Nauru | 332.18 |
| Eswatini | 262.22 |
| Tonga | 226.59 |
| Marshall Islands | 200.49 |
| Lesotho | 156.03 |
| Sao Tome and Principe | 155.94 |
| Namibia | 121.64 |
| Zambia | 116.77 |
| South Sudan | 98.47 |
The prominence of small island states is a reminder that this is a per-person measure. A modest aggregate inflow can translate into a large per-capita figure when population is small. The ranking therefore does not show which countries received the largest total amount of external health financing. To answer that question, an aggregate expenditure measure or the per-capita value combined with population would be needed. Nor does the ranking identify the programs, donors or diseases responsible for the inflows.
A reported zero is different from missing data
Twenty-six countries and economies have a numeric value of 0 in 2023, including the United States, Japan, Australia, Austria, Norway, Saudi Arabia and Singapore. These zeros come from the indicator itself; they are not replacements for missing data. Economies without a 2023 observation are excluded from the mean, median and ranking. On a choropleth, an unshaded or no-data area must therefore not be interpreted as having zero external health expenditure.
A zero should also not be expanded into the broader claim that no health-related resources of any kind crossed the border. The indicator follows a specific health-financing accounting boundary. Research activity, emergency operations, commitments not yet disbursed, or spending recorded outside the national health-system accounts may appear differently in other datasets. The safest interpretation is narrow: the World Bank series reports zero external health expenditure per person for that economy under this indicator in 2023.
Per-person external funding and the external share of health spending answer different questions
A related World Bank indicator expresses external health expenditure as a percentage of current health expenditure. That measure describes the role of external financing in the overall health-financing mix. The present series instead describes the amount per resident after a PPP adjustment. A country can have a comparatively high per-person amount but a modest external share if domestic public and private health spending is much larger. Another country can show a high external share even when its per-person external amount is not among the largest.
Reading the two measures together separates scale from dependence. Per-capita PPP values are useful for comparing the real purchasing-power scale of external health resources available per resident. Percentage shares are better for asking how dependent health financing is on sources from outside the country. Neither measure replaces total health expenditure per capita, domestic government funding, domestic private funding, or out-of-pocket spending; those indicators describe other parts of the financing structure.
The world map reveals broad regional patterns, but small states need the table and chart
Among the 147 observations that match directly to the simplified world boundary layer, many countries in Sub-Saharan Africa fall in the 50-or-more bands. Eswatini, Lesotho, Namibia, Zambia, Mozambique and Malawi are examples. Afghanistan and Timor-Leste also sit well above the global median. Yet many of the very highest Pacific observations—Tuvalu, Palau, Micronesia, Nauru, the Marshall Islands and Tonga—either lack a distinct polygon at this map resolution or are visually tiny at world scale.
That limitation changes how the visuals should be used. The map is effective for broad spatial structure across large land areas, while the bar chart and table are essential for small-island economies and extreme values. All 171 observations remain in the statistics and rankings even though only 147 are directly represented as polygons. Unmatched countries are not assigned a value of zero simply to make the map look complete.
Country size and health-system structure matter when interpreting a per-capita ranking
Per-capita measures remove the direct effect of population size from the comparison, but they are not a score of health-system performance or aid effectiveness. A high value only establishes that external health expenditure was large relative to population after PPP adjustment. The indicator cannot by itself explain whether that reflects limited domestic fiscal capacity, a major disease-control program, temporary emergency assistance, a large infrastructure investment, or another financing arrangement.
PPP adjustment also does not erase every difference in the prices and delivery costs of health services. Health-worker wages, imported medicines, logistics costs, procurement channels and geographic constraints can vary substantially. A value of 400 international dollars should not be interpreted as literal cash worth ten times a value of 40 at market exchange rates. International dollars are designed for cross-country real-purchasing-power comparison, not for describing the currency actually paid to providers or transferred by donors.
Why the analysis uses 2023 rather than all 181 latest observations
Using all 181 latest non-missing observations would increase nominal coverage but reduce time comparability. Health financing can change quickly with epidemics, donor programs, fiscal conditions, exchange rates and domestic reforms. A 2008 value and a 2024 value should not be treated as if they describe the same global snapshot. Because 171 economies report a 2023 observation, that year provides a much more coherent cross-section than the three 2024 observations alone.
The same-year approach has its own limitation: economies without a 2023 observation are left out, and one year cannot establish a long-run trend. A country may have received unusually high or low external financing in 2023. Trend analysis would require the same series over several years and should keep missing years distinct. It is also useful to compare this indicator with total health expenditure per person and the external share of current health expenditure before drawing conclusions about financing dependence or change over time.
Data source and calculation method
The numeric source is World Bank World Development Indicators series SH.XPD.EHEX.PP.CD. The indicator covers external sources flowing into the national health system, including direct foreign transfers and foreign transfers distributed through government, and expresses the result per capita in current international dollars at purchasing power parity. Every mean, median, distribution count and ranking above is calculated from the 171 numeric observations dated 2023. Ten latest-available observations from other years are excluded from the same-year comparison.
For the map, ISO-3 country codes were joined to a simplified Natural Earth world boundary layer. That produced 147 direct polygon matches. The remaining 24 observations are mainly small islands and territories that are not represented cleanly at this global resolution. They remain in the table and statistical calculations, while missing or unmatched polygons are never filled with zero. This distinction keeps the map visually useful without changing the underlying data.
Frequently Asked Questions
Is external health expenditure per person the same as total health spending per person?
No. It measures health financing from sources outside the country, expressed per person in PPP international dollars. Total health spending also includes domestic public and private sources.
Are PPP international dollars the same as US dollars transferred by donors?
No. An international dollar is a statistical purchasing-power unit used for cross-country comparison. It is not the currency actually transferred and should not be read as a market-exchange-rate US-dollar amount.
Which economy has the highest 2023 value?
Among the 171 numeric observations from 2023, Tuvalu is highest at about 453.38 PPP international dollars per person, followed by the Federated States of Micronesia, Palau and Nauru.
Why are only 171 observations used when the latest-available dataset has 181?
The 181 latest values span 2008 to 2024. The analysis uses the 171 observations dated 2023 so the map, rankings and summary statistics describe the same reference year.
Related Articles
Green Map creates custom-edited map images using open geographic data sources such as geoBoundaries, Natural Earth, OpenStreetMap, and government open data.
These maps are edited visual materials, not raw data files, and are provided for education, documents, presentations, and graphic reference.