Sioux County in northwestern Iowa is centered on Sioux Center and includes Orange City, Rock Valley, Hawarden, Hull, Alton, and several smaller communities. Route 75 runs north-south through the middle of the county, route 18 crosses the northern tier, and route 10 connects the Hawarden-Orange City-Alton side. Route 60 appears in the southeast and route 12 near the southwest edge. This page explains the supplied county, city, terrain-and-water, and elevation maps, and high-resolution JPG versions can be downloaded in a ZIP near the end of the article. High-resolution map files are available for download in the section below.
The landscape changes strongly across the county. A broad lowland follows Rock River along the western side, while higher rolling terrain dominates much of the central and eastern interior. W Branch Floyd River and N Branch Floyd River create separate lower corridors, and Floyd River forms another important valley near the eastern side. The supplied elevation map spans 348 to 455 meters, with a mapped mean of 417 meters.
Table of Contents
Sioux Center and Route 75 provide the main central reference
Sioux Center is the clearest starting point on the general county map. Route 75 passes directly through the central part of the county, connecting areas north and south of the city. Orange City lies to the southeast, with Alton farther east and Route 60 continuing toward the southeastern edge.
Across the north, Route 18 provides the main east-west reference through the Rock Valley and Hull area. Boyden lies east of Hull, while Sheldon is shown just beyond the northeastern side. Hawarden anchors the southwest near routes 10 and 12, and Maurice and Ireton provide additional references across the southern half.
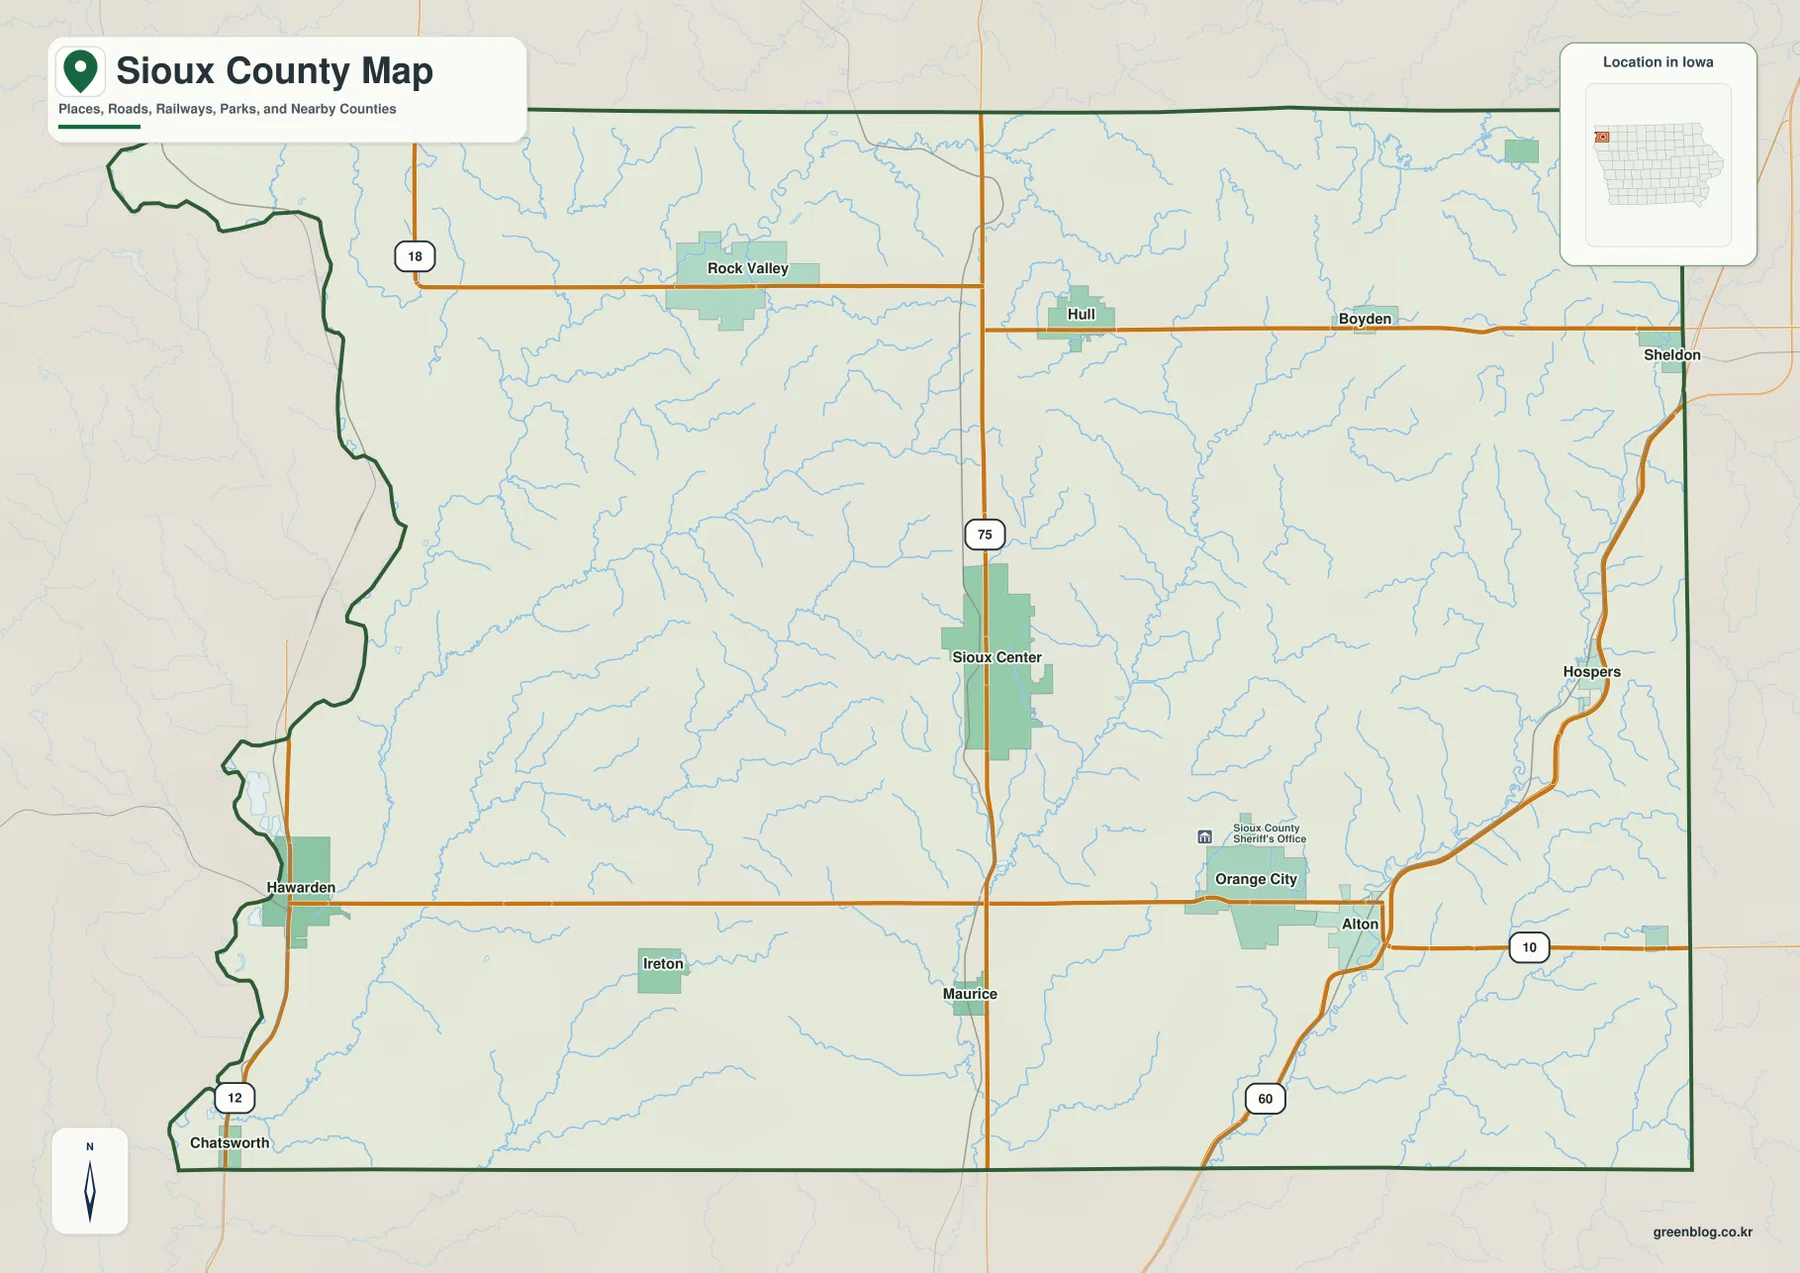
Hospers provides another useful eastern-central reference. The western county boundary is much more irregular than the straighter eastern and southern sides because it follows the terrain and drainage more closely. The map is intended for county-scale orientation rather than live traffic conditions or current construction information.
Sioux Center and Orange City lead the six-city distribution
The city map ranks Sioux Center first with a mapped population of 8,454. Orange City is second at 6,426 and Rock Valley third at 4,059. Hawarden is fourth at 2,658, Hull fifth at 2,317, and Alton sixth at 1,459.
Sioux Center sits near the county center, while Orange City is farther southeast. Rock Valley anchors the northwest and Hawarden the southwest. Hull and Alton provide northeastern and southeastern references, so the six highlighted communities are spread across most parts of the county rather than concentrated in one corner.
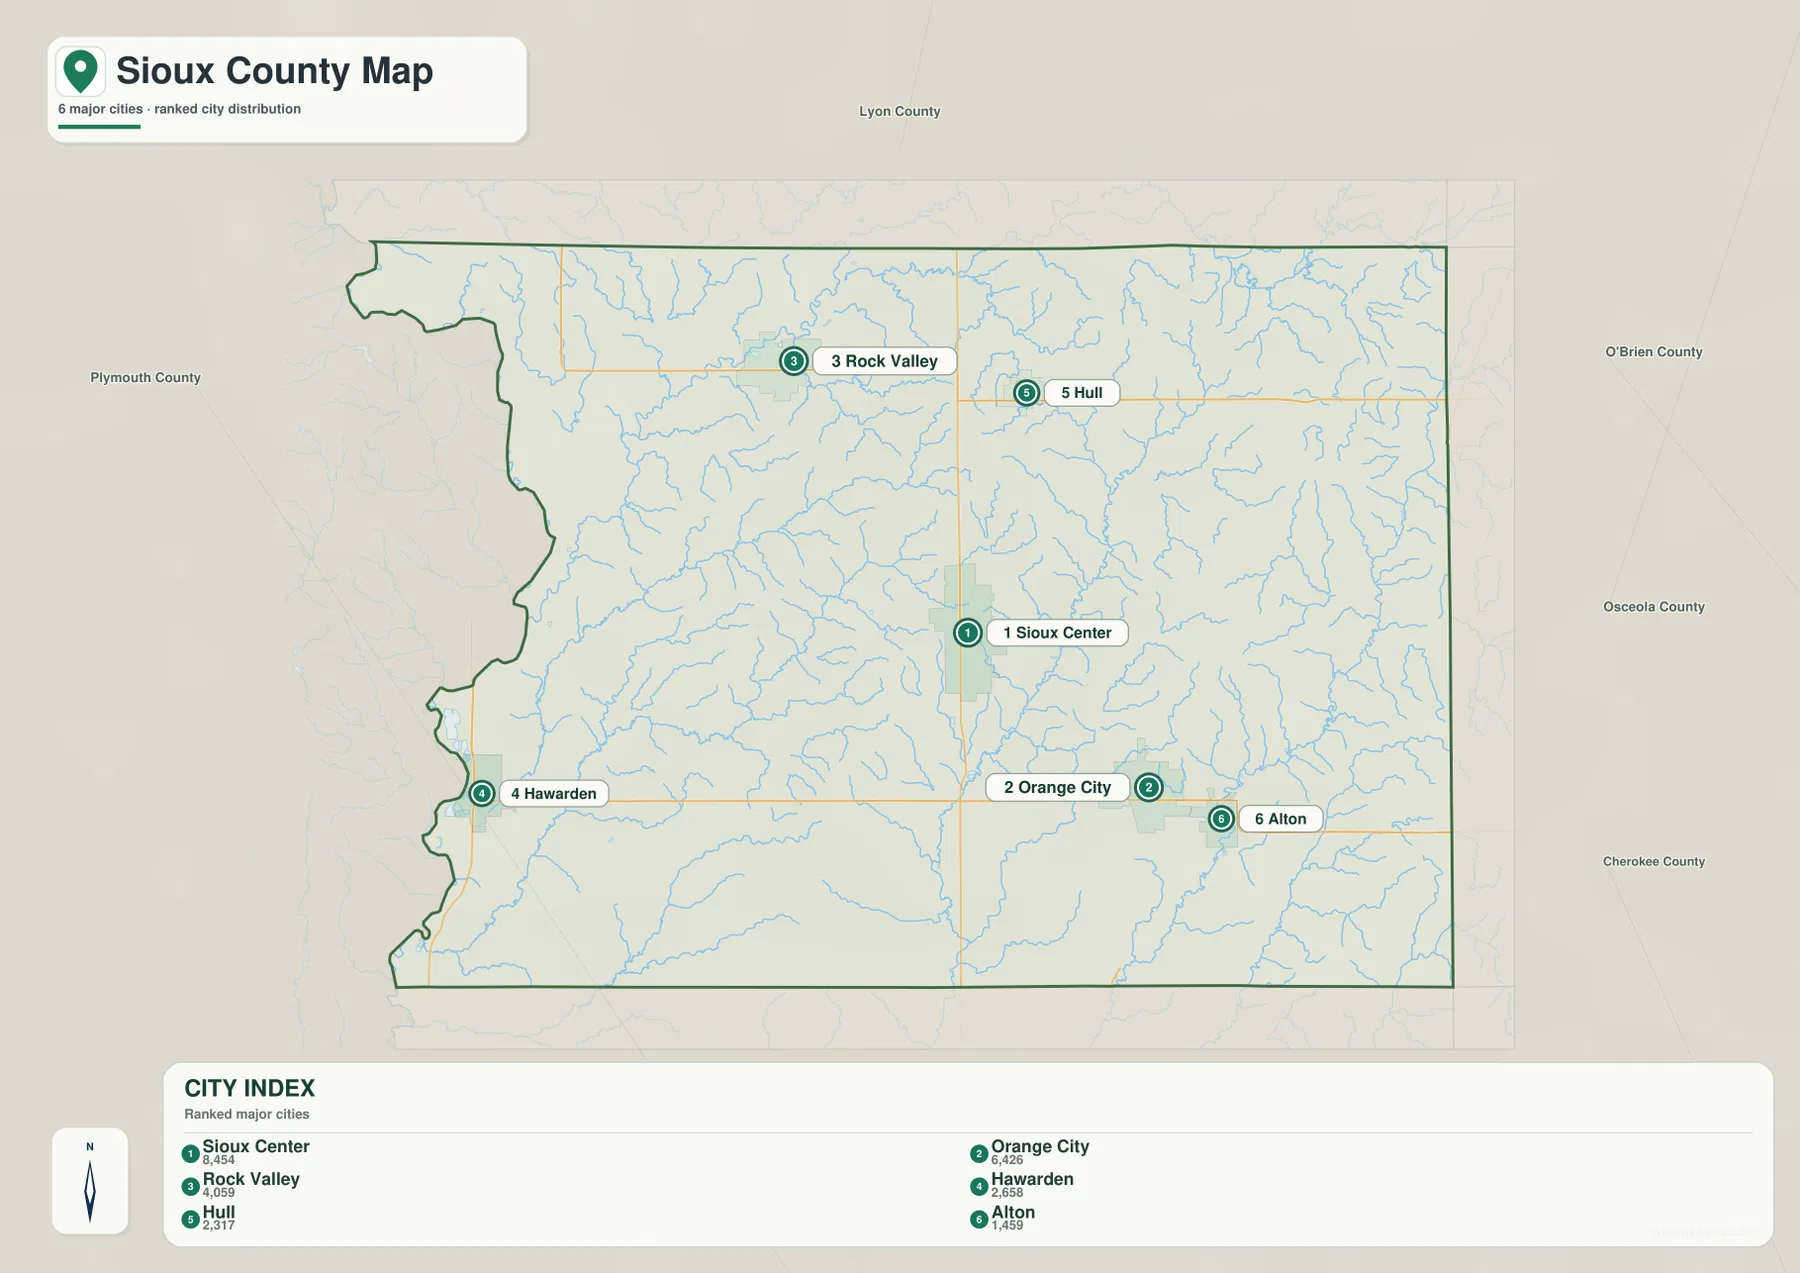
Neighboring county labels include Lyon County to the north, Plymouth County to the west and southwest, and O’Brien, Osceola, and Cherokee counties to the east. Those labels help place Sioux County within the broader northwestern Iowa region and make the east-west spread of the highlighted communities easier to understand.
Rock River creates the broadest lowland on the western side
Rock River is the most prominent waterway on the western side of the terrain-and-water map. It winds from the northwest toward the south and creates a long, broad low corridor. On the elevation map, that same valley appears in green, clearly separated from the higher brown terrain farther inland.
Dry Creek enters the western interior, while Sixmile Creek and Spring Creek form additional valleys farther south. Indian Creek creates another lower corridor in the south-central part of the county. These waterways help explain why the Rock Valley and Hawarden sides look lower and more dissected than the central uplands.
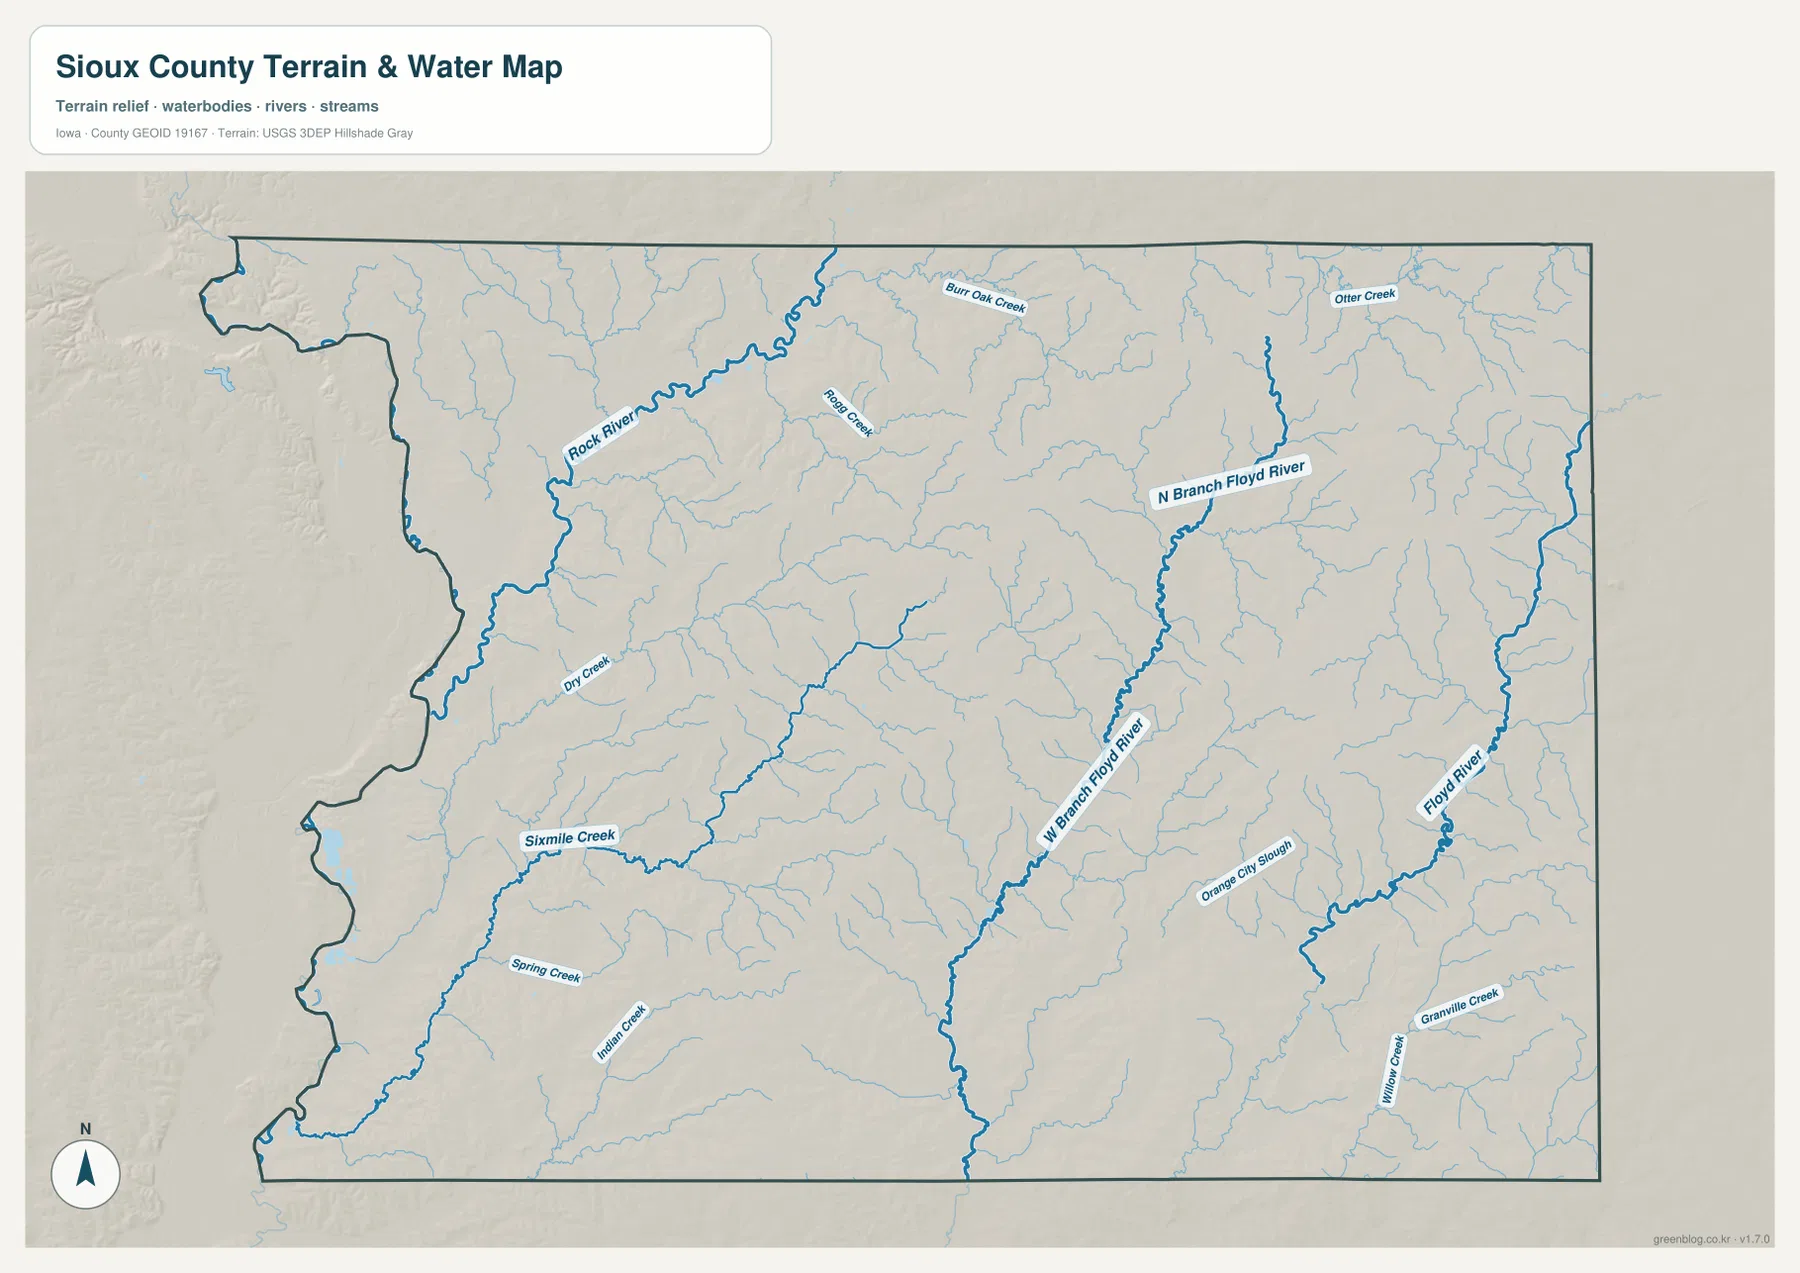
This terrain-and-water sheet is intended for general geographic reference. It does not provide current flood conditions, water depths, navigation limits, parcel boundaries, or legal water boundaries, so those questions require current agency data.
The Floyd River branches divide the central and eastern uplands
W Branch Floyd River forms a long north-south valley through the central interior. It passes east of Sioux Center and west of Orange City, creating a lower corridor between higher ridges. Numerous small tributaries feed into the branch and break the surrounding uplands into smaller hills.
N Branch Floyd River occupies another valley farther east, while Floyd River follows the eastern side of the county. Orange City Slough is labeled near the Orange City area, and Willow Creek with Granville Creek adds more lower channels in the southeast. These waterways make the eastern half much more varied than the road grid alone suggests.
Burr Oak Creek and Rags Creek are labeled across the northern interior, and Otter Creek appears in the northeast. Although these are smaller streams, they are useful references when matching the Rock Valley, Hull, and Boyden areas with the elevation map.
Elevation ranges from 348 to 455 meters
The supplied elevation map shows an actual county range of about 348 to 455 meters, with a mean elevation of 417 meters. The lowest terrain forms a broad green band along Rock River on the western side. Higher brown terrain covers much of the central and eastern county, with additional elevated ridges across the north and south.
W Branch Floyd River and N Branch Floyd River create long lower corridors through the interior, while Floyd River adds another relatively low valley along the east. These waterways divide the higher ground into a series of ridges rather than one continuous plateau. The difference between the mapped high and low ends is about 107 meters.
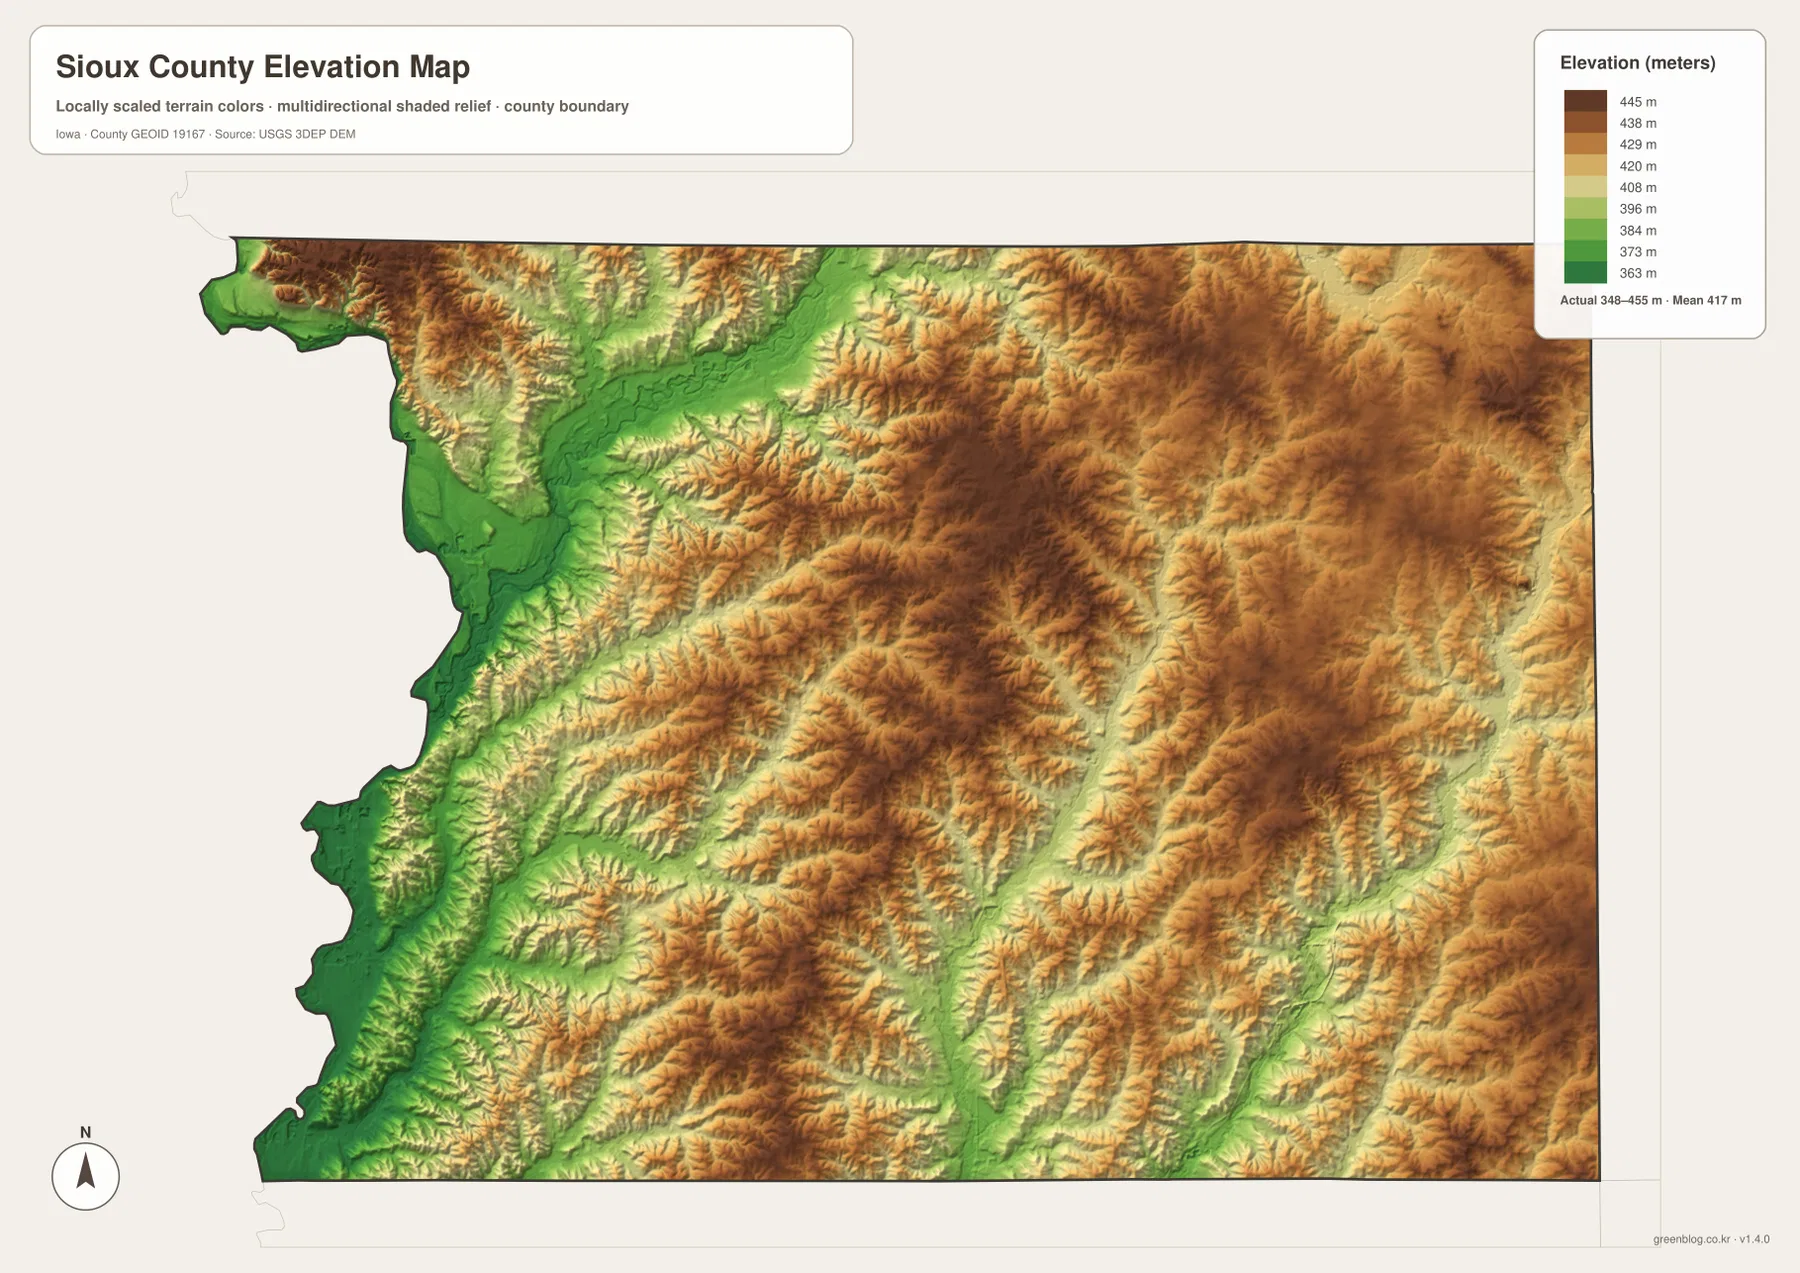
The elevation colors are designed for broad terrain comparison rather than survey-grade measurement. Exact parcel elevations, road grades, engineering design, or construction work requires original elevation data or professional surveying.
Rock Valley to Orange City shows the county’s terrain transition
Rock Valley is a useful northwestern reference because it lies close to the Rock River lowland. Moving toward Sioux Center brings the map reader into higher central terrain, while the Orange City side includes another set of lower valleys along W Branch Floyd River and Orange City Slough.
Hawarden works well for the southwestern Rock River side and the route 10-12 area. Hull and Alton provide eastern references near the Floyd River system and higher inland hills. Looking at the same towns on the road, water, and elevation maps makes the county’s terrain changes much easier to follow.
Choose the Sioux County Iowa map that fits the task
Use the general county map when you need towns and numbered routes in one view. It is the quickest way to compare Sioux Center, Orange City, Rock Valley, Hawarden, Hull, and Alton with routes 18, 75, 10, 60, and 12. The city map is better for comparing the six highlighted communities and their mapped population ranking.
The terrain-and-water map is best for Rock River, W Branch Floyd River, N Branch Floyd River, Floyd River, Sixmile Creek, Spring Creek, Indian Creek, Orange City Slough, Willow Creek, and Granville Creek. The elevation map adds the 348–455 m range and makes the western lowland and higher interior much easier to compare.
The WebP images in the article are optimized for quick browser viewing. For printing, classroom use, presentations, or closer regional comparison, the ZIP below contains the county, major-city, terrain-and-water, and elevation maps as high-resolution JPG files. They are general-reference maps rather than legal, flood, navigation, or engineering products.
Frequently Asked Questions
Which map is best for locating Sioux Center and Orange City?
The general county map is the best starting point. Sioux Center lies near the middle of the county and Orange City is farther southeast. Routes 75 and 10 provide clear references, and Rock Valley, Hawarden, Hull, and Alton can be compared on the same map.
What are the main rivers and creeks shown in Sioux County?
Rock River is the strongest western reference. W Branch Floyd River crosses the central interior, while N Branch Floyd River and Floyd River occupy the east. Sixmile Creek, Spring Creek, Indian Creek, Orange City Slough, Willow Creek, and Granville Creek are also labeled.
What does the 348–455 m elevation range show?
The elevation map shows a broad lowland along Rock River and higher terrain across much of the central and eastern county. The mapped mean elevation is 417 meters. Precise site elevations require original elevation data or professional survey information.
Map File Information
The ZIP contains four high-resolution JPG maps for Sioux County, Iowa: county, major cities, terrain and water, and elevation.
- Included Files: Use only the versions confirmed in the article and supplied images
- File Type: Use the confirmed download contents
- Intended Use: Printing, education, presentations, and map-based projects
Related Maps
Sources and reference data
Sioux County’s official assessor page provides access to county GIS resources, while the federal links below provide boundary, hydrography, and elevation source data.
- Sioux County Assessor – GIS Website
- U.S. Census Bureau TIGER/Line Shapefiles
- USGS National Hydrography
- USGS 3D Elevation Program
These maps are intended for general geographic reference, learning, printing, and visual comparison. Legal boundaries, ownership, current road conditions, flood risk, water levels, and precise elevations should be checked against the responsible agency’s current records.
Green Map creates custom-edited map images using open geographic data sources such as geoBoundaries, Natural Earth, OpenStreetMap, and government open data.
These maps are edited visual materials, not raw data files, and are provided for education, documents, presentations, and graphic reference.