The share of merchandise imports sourced from low- and middle-income economies in South Asia varies sharply across reporting economies. World Bank indicator TM.VAL.MRCH.R5.ZS shows a small number of economies with very strong sourcing links to this partner group, while most of Europe and the Americas record much smaller shares. The key point is that this indicator measures a percentage of each economy’s total merchandise imports, not the absolute dollar value of trade.
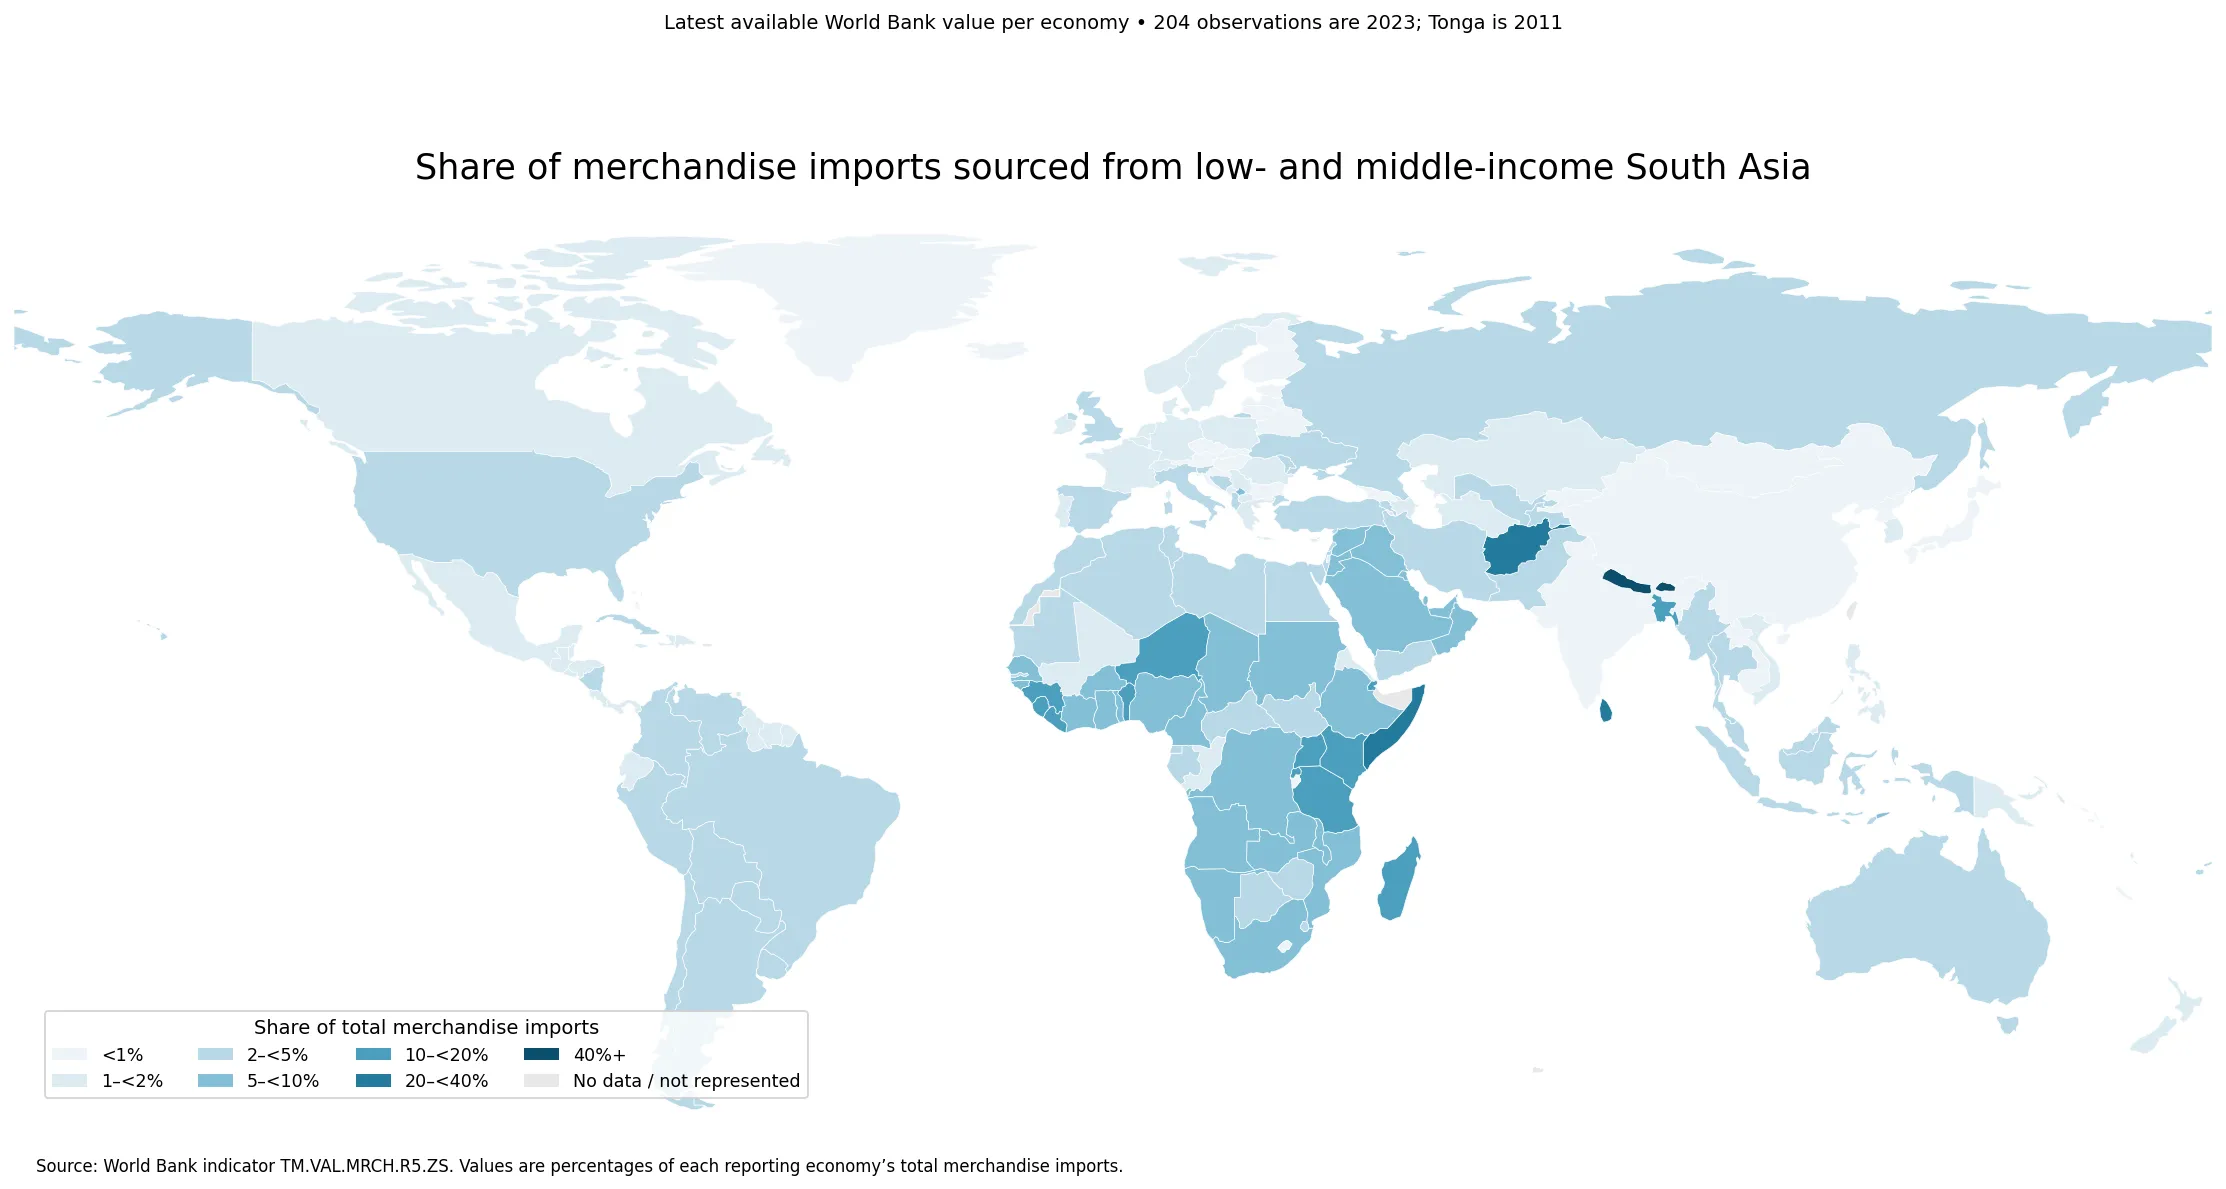
Table of Contents
What the indicator measures
The World Bank defines this series as merchandise imports from low- and middle-income economies in South Asia as a percentage of the reporting economy’s total merchandise imports. The unit is percent. The series is computed only when at least half of the economies in the partner group have non-missing data. A value of 20% therefore means that roughly one-fifth of the reporting economy’s merchandise imports came from this partner group; it does not mean that the economy has a large import bill in absolute terms.
The verified dataset contains 205 economies using the most recent non-missing observation available in the source. 204 observations are from 2023, while Tonga’s latest value is from 2011. The map is therefore very close to a 2023 global snapshot, but technically it is a latest-available comparison rather than a perfectly synchronized cross-section. Small islands and some territories may also be absent from the low-resolution world boundary layer even when a row exists in the source data.
The global distribution is concentrated at low shares
Across all 205 observations, the median is 2.02% and the mean is 4.39%. The mean is more than twice the median because a few very large values pull the distribution upward. 48 economies are below 1%, while only 20 are at or above 10%. Even the 75th percentile is just 4.58%, so a single-digit share is the normal pattern for most reporting economies.
| Economy | Share | Observation year |
|---|---|---|
| Bhutan | 91.50% | 2023 |
| Nepal | 61.47% | 2023 |
| Somalia, Fed. Rep. | 22.78% | 2023 |
| Sri Lanka | 21.56% | 2023 |
| Afghanistan | 21.02% | 2023 |
| Maldives | 20.68% | 2023 |
| Benin | 17.53% | 2023 |
| Liberia | 16.56% | 2023 |
| Djibouti | 16.41% | 2023 |
| Bangladesh | 15.41% | 2023 |
The top of the distribution is highly uneven. Bhutan reaches 91.50% and Nepal 61.47%, far above the rest. The next group consists of the Federal Republic of Somalia at 22.78%, Sri Lanka at 21.56%, Afghanistan at 21.02%, and Maldives at 20.68%. Benin, Liberia, Djibouti, and Bangladesh round out the top ten. The large gap between the two highest values and the rest makes it clear that proximity alone cannot explain the pattern.
South Asia itself shows very different sourcing relationships
Within South Asia, the share ranges from extremely high to very low. Bhutan and Nepal source well over half of their merchandise imports from low- and middle-income economies in the same region. Sri Lanka, Afghanistan, and Maldives are around one-fifth, and Bangladesh is 15.41%. Pakistan is much lower at 2.17%, while India is 0.76%.
| South Asian economy | Share of total merchandise imports |
|---|---|
| Bhutan | 91.50% |
| Nepal | 61.47% |
| Sri Lanka | 21.56% |
| Afghanistan | 21.02% |
| Maldives | 20.68% |
| Bangladesh | 15.41% |
| Pakistan | 2.17% |
| India | 0.76% |
These differences should not be reduced to distance. Market size, land borders, port access, domestic production, energy and raw-material sourcing, transport routes, and trade arrangements can all affect the composition of imports. The indicator itself does not identify causes. Explaining why one economy has a high or low share requires partner-level and product-level trade data in addition to this percentage series.
Several African economies also record double-digit shares
Another clear geographic feature is the cluster of relatively high shares across parts of eastern and western Africa. Benin is 17.53%, Liberia 16.56%, Djibouti 16.41%, Tanzania 13.67%, Comoros 13.58%, Sierra Leone 12.47%, Madagascar 12.11%, Niger 11.95%, Kenya 11.71%, and Uganda 11.15%. These values show that sourcing links to South Asian suppliers can be important well beyond South Asia itself, potentially reflecting Indian Ocean shipping connections, competitive manufactured goods, pharmaceuticals, textiles, food products, or other product-specific supply relationships. The indicator does not reveal which products dominate, so those explanations remain hypotheses until product-level data are checked.
By contrast, much of Europe sits near 1–2%, and the Americas are generally low as well. Among economies represented in the Natural Earth map layer, the median is about 6.73% for Africa, 2.73% for Asia, 2.08% for South America, 1.75% for North America, and 1.25% for Europe. These continent medians are descriptive summaries of the mapped polygons, not official World Bank regional aggregates, because small territories and a few unmatched boundaries are not included in that calculation.
A low share does not mean little trade in dollar terms
The denominator matters. A large trading economy can import a substantial amount from South Asian suppliers and still show a small percentage because its total merchandise imports are enormous and geographically diversified. A smaller economy can show a high percentage when a few suppliers account for a large portion of its import basket. This map therefore answers a composition question: how important is this partner group inside each reporting economy’s merchandise-import mix? It does not rank economies by the dollar value of imports from South Asia.
The partner group is also based on World Bank regional and income classifications rather than a simple list of every economy geographically located in South Asia. If classifications change over time, long-run comparisons should check whether the composition of the partner group has also changed.
Freshness and map limitations
The source uses the most recent non-missing observation for each economy in this dataset. Because Tonga’s latest value is from 2011 while the other 204 rows are 2023, the dataset should not be described as a perfectly uniform 2023 panel. The map also uses a low-resolution country boundary layer: tiny islands and some territories may have valid source rows but no separate visible polygon. A blank area on the map therefore does not automatically mean that the World Bank has no observation.
This single indicator also cannot measure supply-chain resilience, bilateral trade balances, political relationships, or the product composition of imports. Those questions require additional data such as HS-level goods, partner-country values, freight costs, exchange rates, and domestic demand. The purpose of this map is narrower: it shows where low- and middle-income South Asian economies occupy a large or small share of each reporting economy’s merchandise-import basket.
What stands out most
The dominant feature is not a smooth global gradient but a highly asymmetric pattern. Most economies have small shares, a limited set of African economies are in the double digits, and a few South Asian economies have exceptionally high intraregional sourcing. Bhutan and Nepal are extreme outliers, while only six economies exceed 20%. That combination of a low global median and a handful of very high observations is the central fact to keep in mind when reading the map.
The official source is World Bank indicator TM.VAL.MRCH.R5.ZS. When comparing it with other trade indicators, first check whether the denominator is total merchandise imports, whether the measure is a value or a share, and whether the partner group uses the same income and regional classification.
Frequently Asked Questions
What does this import-share indicator measure?
It measures merchandise imports from low- and middle-income economies in South Asia as a percentage of the reporting economy’s total merchandise imports.
Are all observations from 2023?
No. 204 of the 205 rows are from 2023, while Tonga’s latest available observation is from 2011. The dataset is best read as a latest-available comparison.
Does a low share mean a country imports little from South Asia in dollar terms?
Not necessarily. The indicator is a percentage of total merchandise imports, so a large trading economy can import substantial amounts while still recording a small share.
Related Articles
Green Map creates custom-edited map images using open geographic data sources such as geoBoundaries, Natural Earth, OpenStreetMap, and government open data.
These maps are edited visual materials, not raw data files, and are provided for education, documents, presentations, and graphic reference.