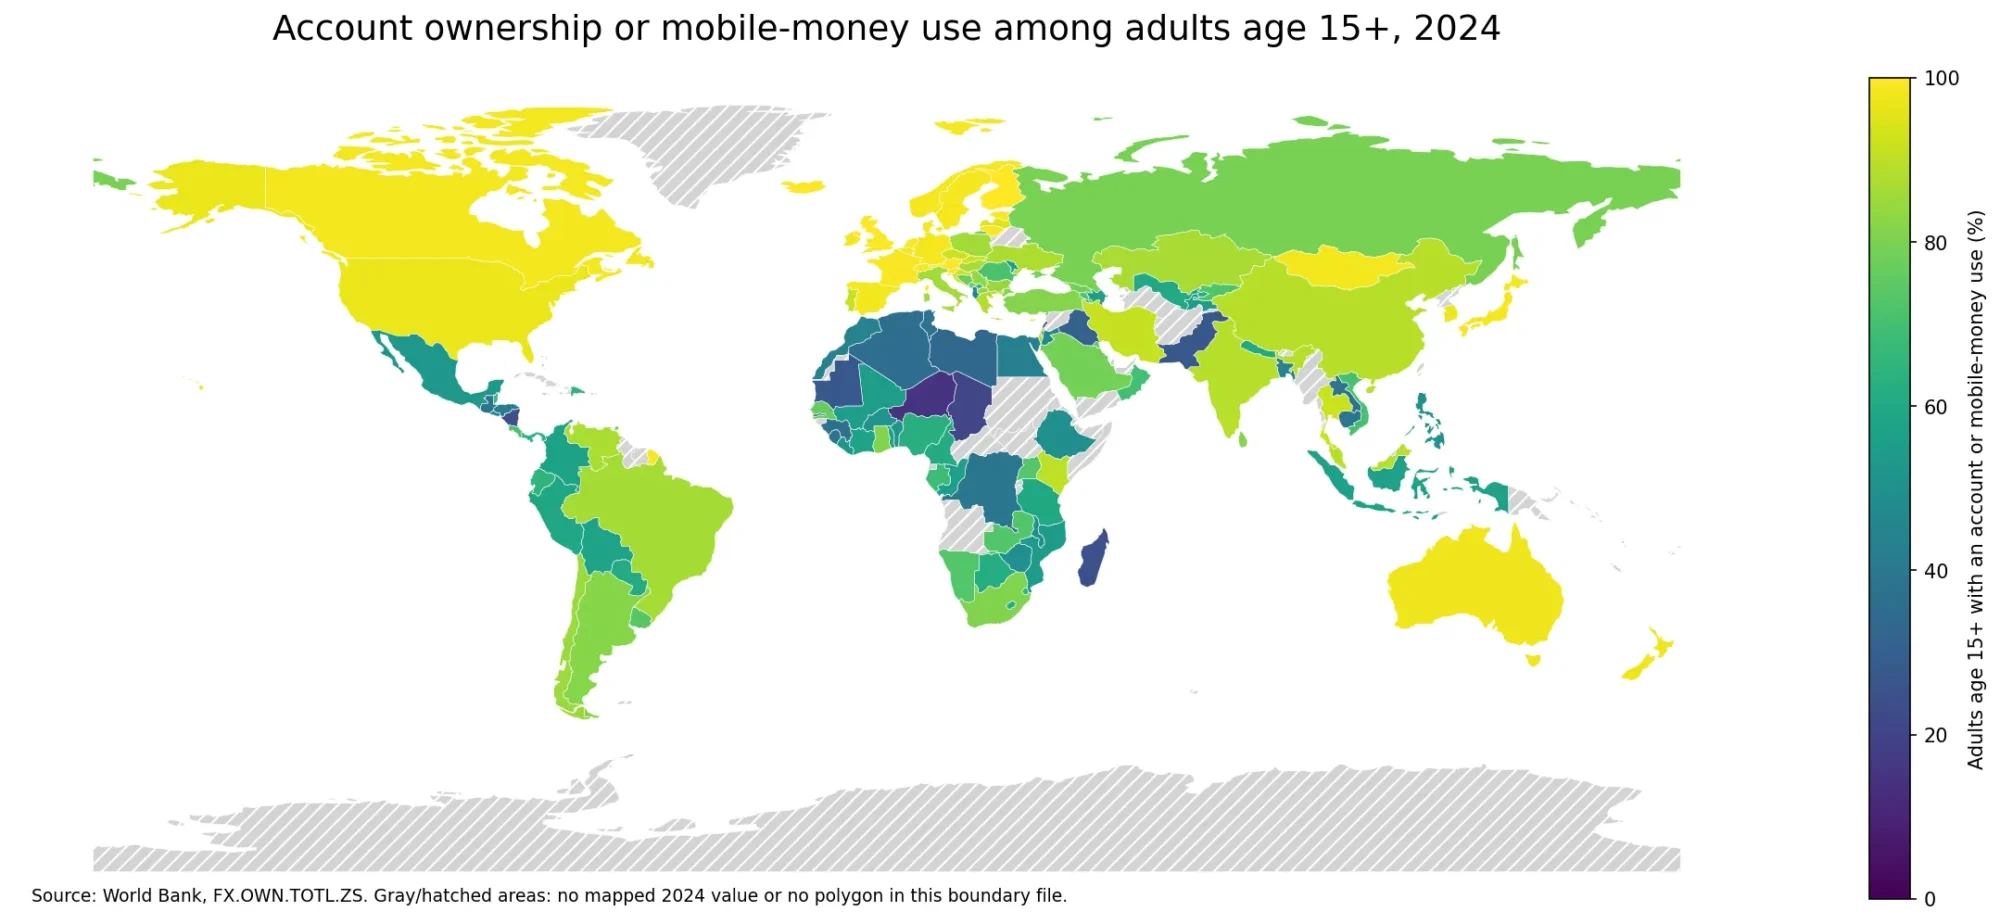
The 2024 account-ownership indicator for adults with secondary education or more compares financial access within a relatively more educated subgroup. In the World Bank Global Findex definition, account ownership means respondents report having an account, individually or jointly, at a bank or other financial institution, or personally using a mobile-money service in the previous 12 months. This series focuses on respondents ages 15 and older with secondary education or more.
The 2024 dataset contains observed values for 139 economies, while 78 are source-missing. The median is 80.27% and the mean is 77.77%. The first quartile is 65.18% and the third quartile is 94.36%. Finland has the highest observation at 99.79%, while Lebanon has the lowest at 26.28%.
This is not the same as the overall adult account-ownership rate. It is an education-subgroup measure, so it is most useful for asking whether financial access remains broad among adults with at least secondary education and for comparing that pattern with other education groups. It also combines financial-institution accounts and mobile-money use, so it should not be interpreted as a traditional bank-account rate alone.
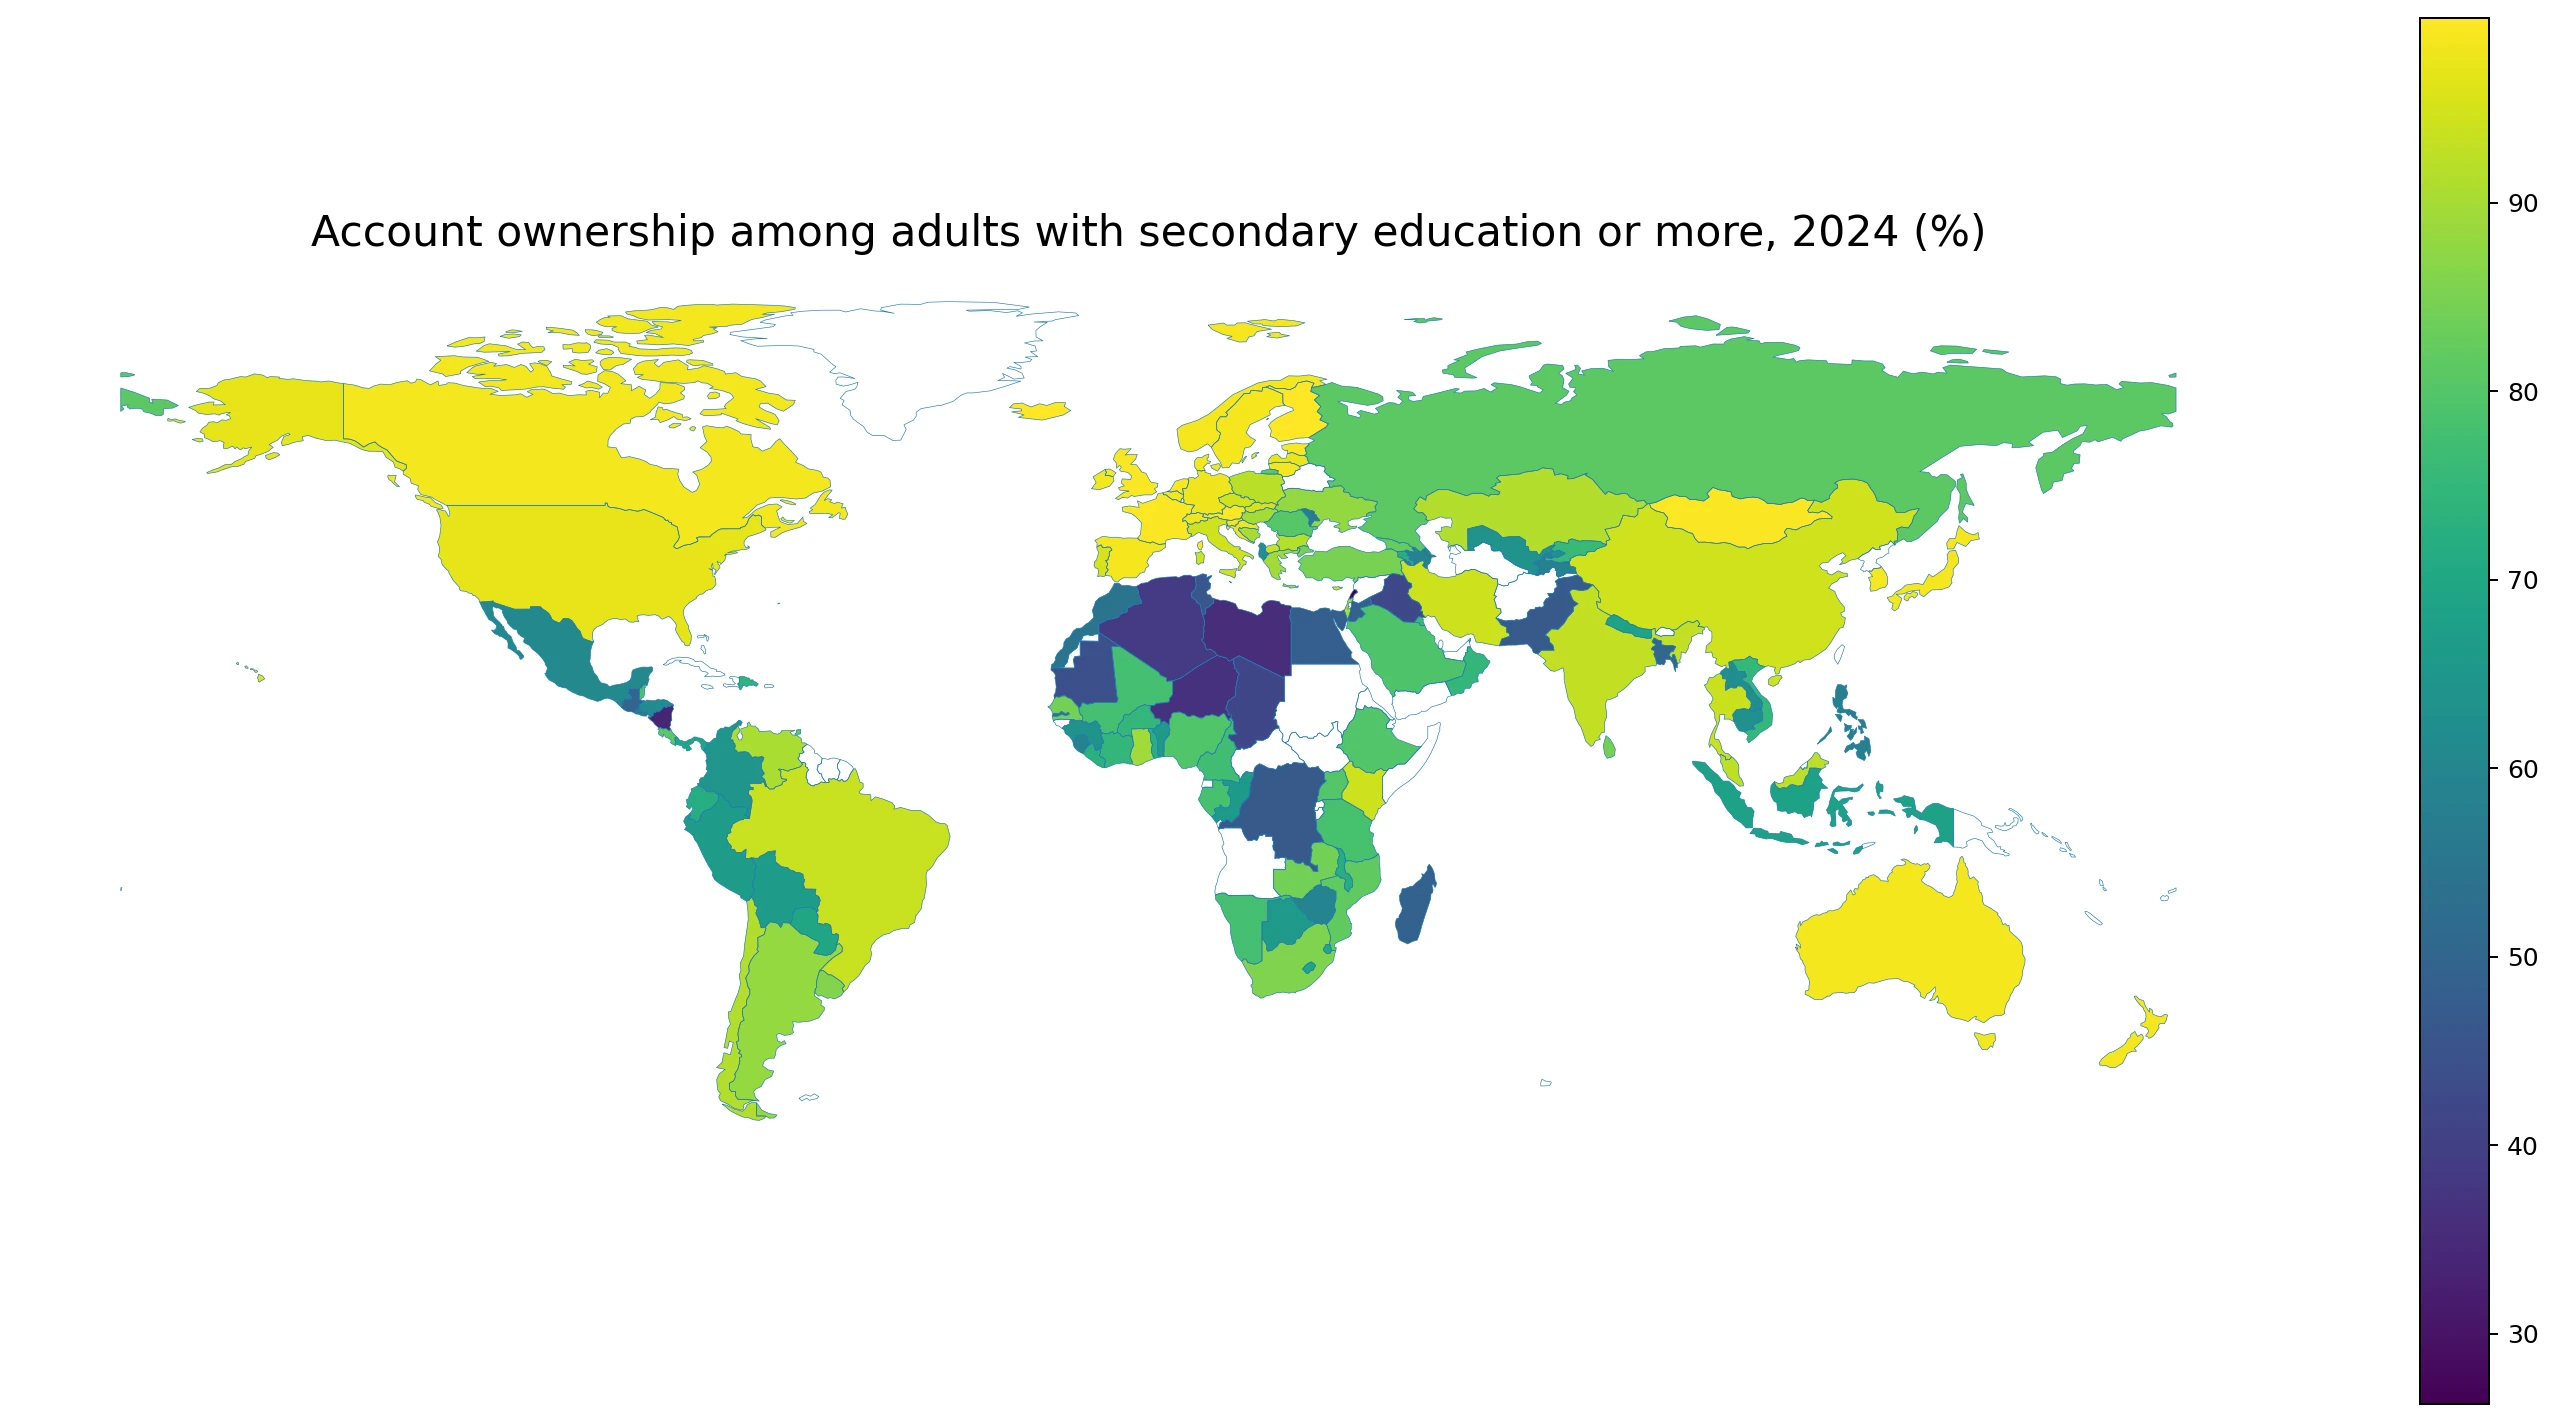
Table of Contents
The median is 80.27%, but access remains uneven
Among the 139 observed economies, 16 are below 50%, 30 are from 50% to under 70%, 34 are from 70% to under 85%, 27 are from 85% to under 95%, and 32 are at 95% or more. Half of all observations lie between about 65.18% and 94.36%. The upper end is close to universal access, while a meaningful group remains far below that level.
The wide distribution shows that education alone does not eliminate financial-access differences. Adults with secondary education or more may still face different banking infrastructure, digital-connectivity conditions, documentation requirements, fees, trust in financial institutions, labor-market arrangements, and income constraints across economies. The indicator identifies where the gap exists but does not quantify which factor causes it.
The measure also captures two access routes. A respondent qualifies by reporting an account at a financial institution or by personally using a mobile-money service. That matters in economies where mobile financial services extend access beyond the traditional branch-banking system. A country can therefore have a relatively high value even if conventional bank-branch access is limited.
| Reported share | Economies |
|---|---|
| Below 50% | 16 |
| 50% to under 70% | 30 |
| 70% to under 85% | 34 |
| 85% to under 95% | 27 |
| 95% or more | 32 |
The highest values are close to universal access
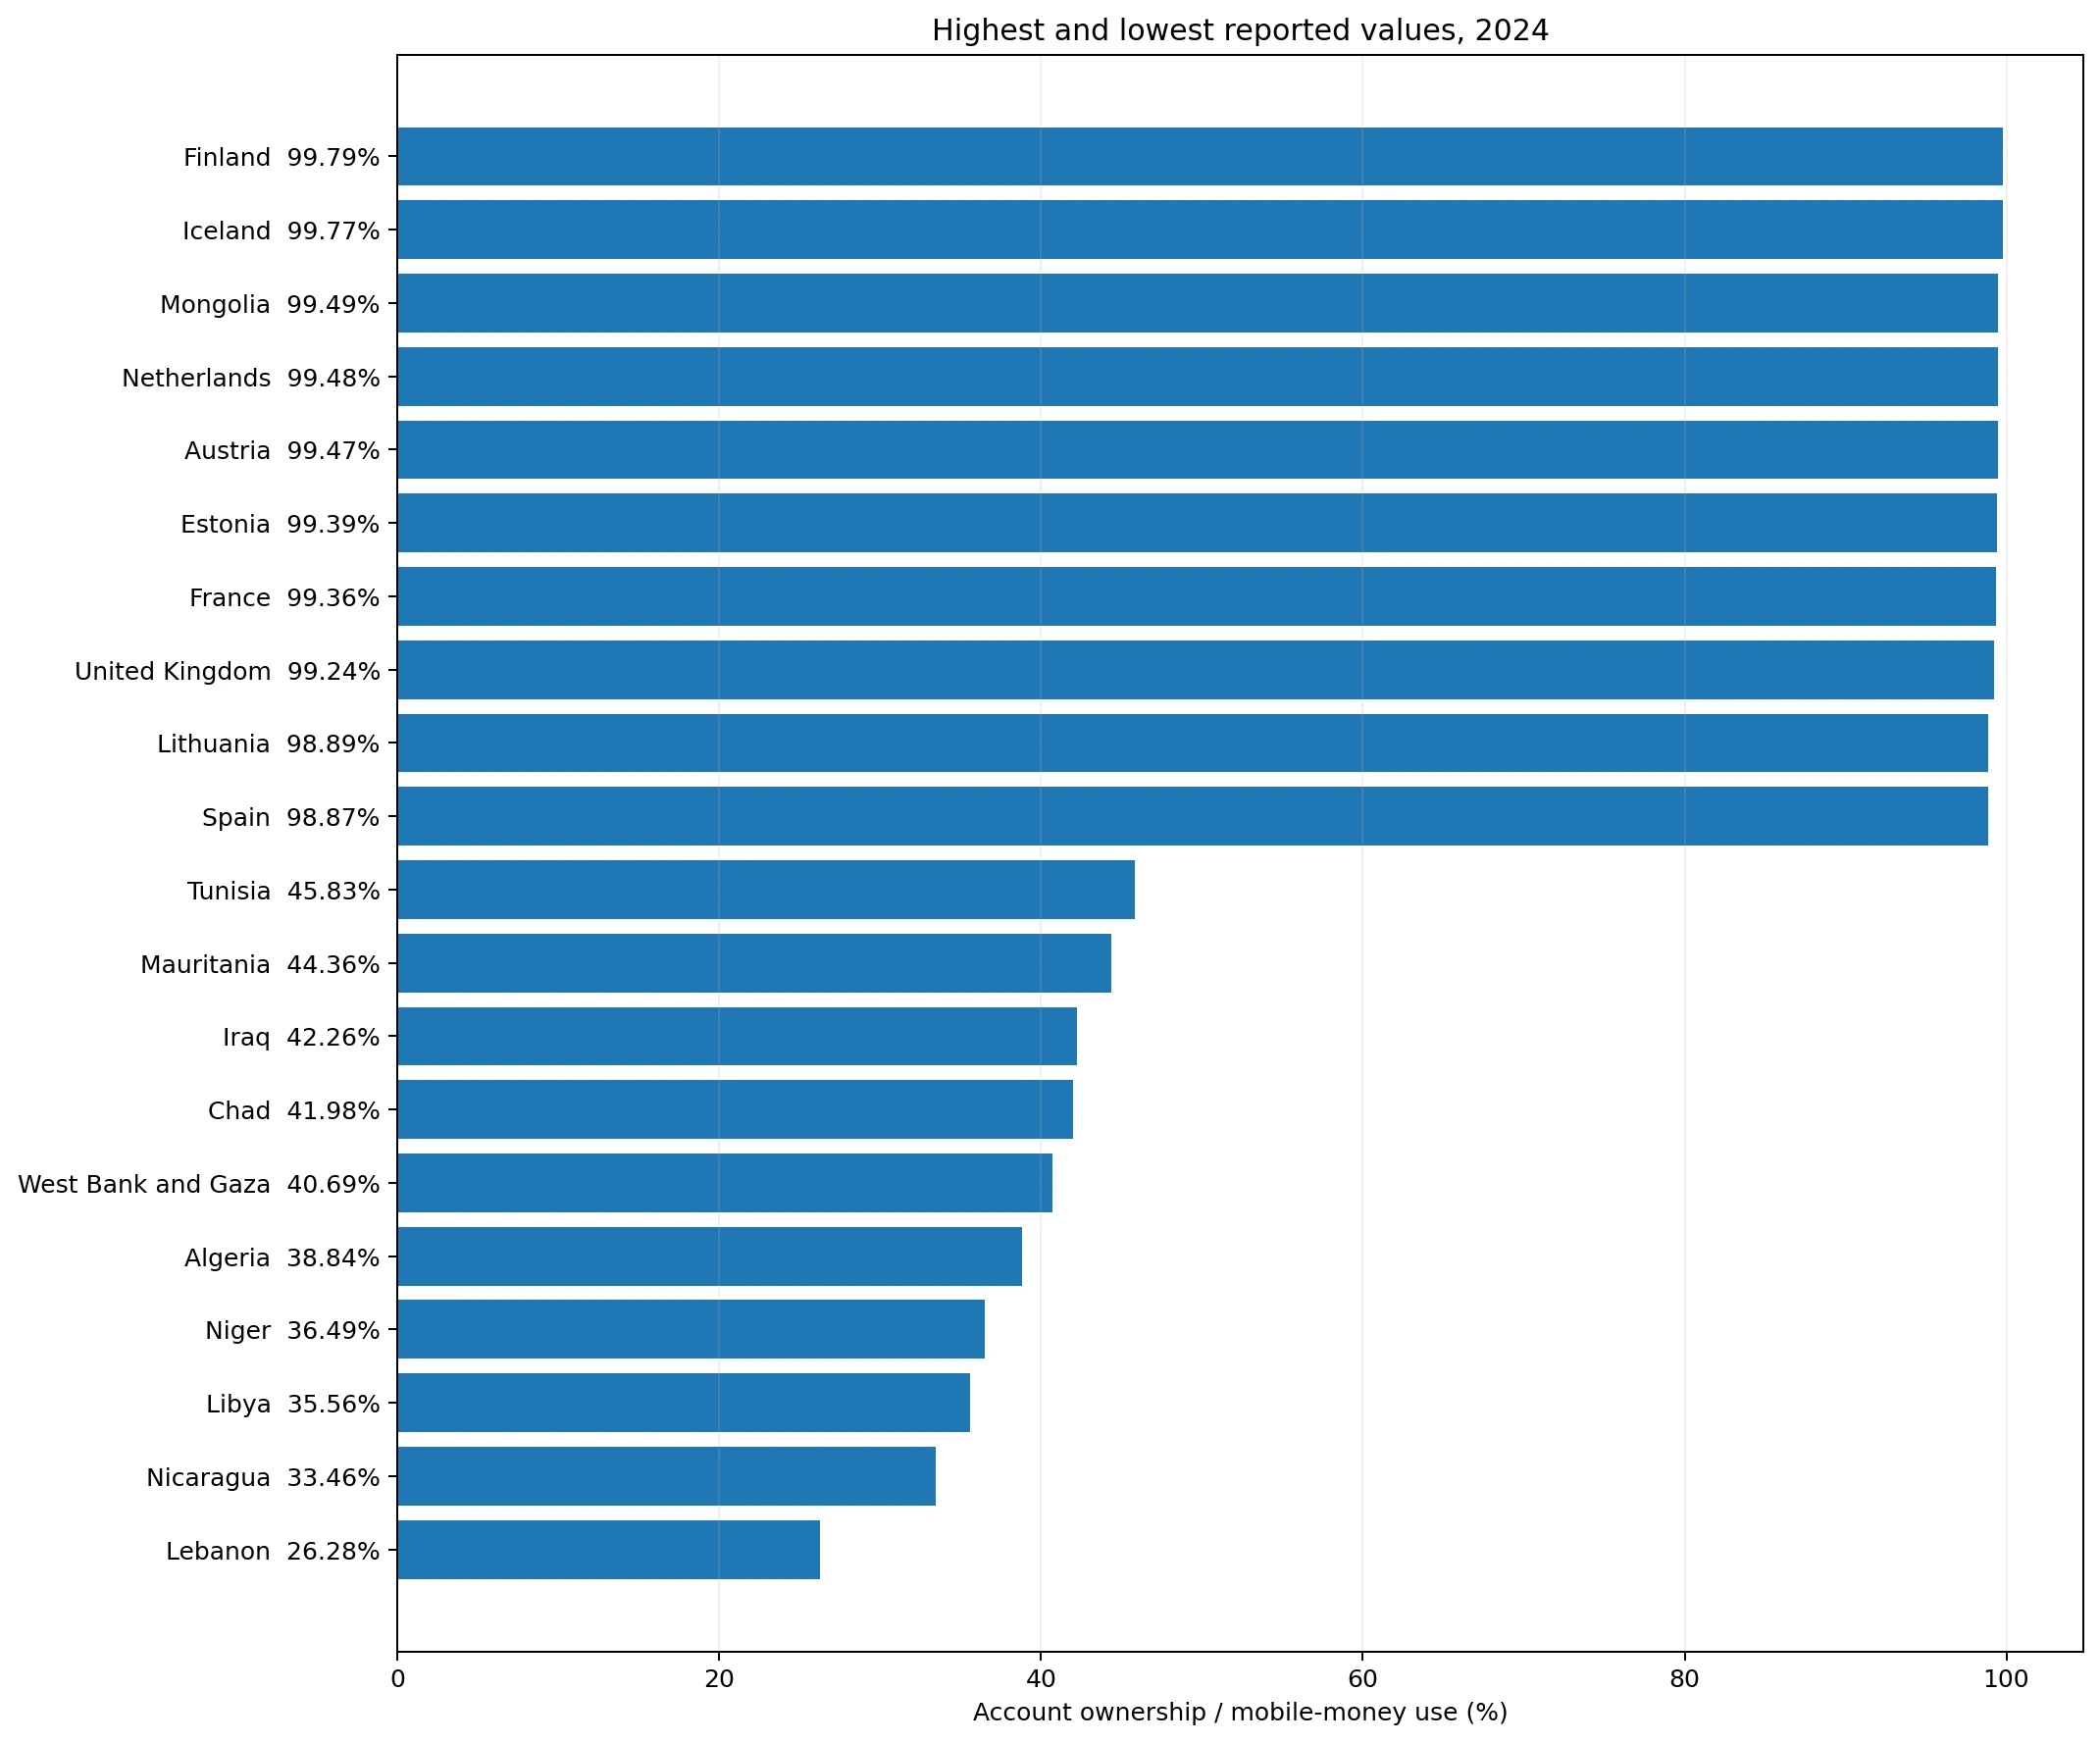
Finland records 99.79%, followed by Iceland at 99.77%, Mongolia at 99.49%, the Netherlands at 99.48%, Austria at 99.47%, Estonia at 99.39%, France at 99.36%, and the United Kingdom at 99.24%. At this end of the distribution, nearly every respondent in the education subgroup reports financial-institution account ownership or mobile-money use.
Many of the highest observations are in Europe, but Mongolia shows that the upper tail is not exclusively European. The common feature visible in the data is the near-saturation level rather than a single regional explanation. Digital payment systems, account-based wage and transfer payments, banking coverage, and institutional factors can all contribute, but the indicator does not isolate their individual effects.
Differences of a few tenths of a percentage point within the 99% range should not be exaggerated. Once an indicator approaches 100%, ranking becomes less informative because several economies have effectively universal reported access. Measures of usage intensity, saving, borrowing, digital payments, and inactive accounts would provide more differentiation among these high-access economies.
| Highest observations | Share |
|---|---|
| Finland | 99.79% |
| Iceland | 99.77% |
| Mongolia | 99.49% |
| Netherlands | 99.48% |
| Austria | 99.47% |
| Estonia | 99.39% |
| France | 99.36% |
| United Kingdom | 99.24% |
| Lithuania | 98.89% |
| Spain | 98.87% |
The lowest values show that education does not guarantee access
Lebanon has the lowest observed value at 26.28%, followed by Nicaragua at 33.46%, Libya at 35.56%, Niger at 36.49%, Algeria at 38.84%, West Bank and Gaza at 40.69%, Chad at 41.98%, and Iraq at 42.26%. Even within the secondary-or-more education group, financial access varies widely across economies.
A low value should not be interpreted as evidence that education has no relationship with financial inclusion. The indicator is a cross-country subgroup comparison, and many other factors differ at the same time. Financial infrastructure, digital networks, household income, employment form, identification systems, regulation, and trust can all affect whether people actually use an account or mobile money.
The combined account-and-mobile-money definition is especially important at the lower end. Some economies can expand access through mobile services even when conventional bank coverage remains limited. Others may have relatively limited mobile-money ecosystems, leaving adults dependent on traditional financial institutions. A bank-only indicator would answer a narrower question.
| Lowest observations | Share |
|---|---|
| Lebanon | 26.28% |
| Nicaragua | 33.46% |
| Libya | 35.56% |
| Niger | 36.49% |
| Algeria | 38.84% |
| West Bank and Gaza | 40.69% |
| Chad | 41.98% |
| Iraq | 42.26% |
| Mauritania | 44.36% |
| Tunisia | 45.83% |
The education subgroup should not be confused with the whole adult population
The indicator name includes “% of population ages 15+” but also specifies “secondary education or more.” It is designed as a subgroup measure within the Global Findex education comparison. A value of 80% should therefore be read as financial-account or mobile-money access within the secondary-or-more group, rather than as 80% of all adults simultaneously having secondary education and an account.
This distinction matters because the size of the secondary-or-more population differs greatly across economies. In one country the subgroup may represent most adults; in another it can be much smaller. The same 80% subgroup rate can therefore correspond to very different numbers of people in absolute terms.
The indicator is most useful when paired with other education groups
The strongest analytical use is to compare this series with the primary-education-or-less account-ownership measure for the same year. A large gap would indicate that financial access differs substantially by education level, while a small gap would suggest more even access across education groups. A valid gap calculation requires matching survey years and definitions.
Education may be associated with financial literacy, digital skills, income, employment stability, and urban residence. Those characteristics can move together, so a difference between education groups should not automatically be interpreted as a direct causal effect of schooling. The data identify disparities; causal explanation requires additional analysis.
For policy analysis, education-group data can help reveal whether a strong national average masks exclusion among less-educated adults. If both education groups have similarly high access, attention may shift to gender, age, or income gaps. If the gap is large, account-opening barriers and digital inclusion among adults with less schooling may warrant closer examination.
A percentage is not the number of account holders
A subgroup percentage describes composition, not market size. A large economy with a 70% rate can contain far more account users than a small economy at 95%. Estimating the actual number of users requires the size of the secondary-or-more adult population.
The measure also does not count the number of accounts. A respondent with several bank accounts is still one respondent reporting account ownership. Administrative statistics on bank accounts, mobile wallets, deposits, or transactions answer different questions from a survey-based access rate.
The 2024 comparison is a snapshot, not a trend
Every value here refers to 2024. A high level does not mean the rate has recently risen, and a low level does not establish a decline. Global Findex is repeated periodically, so changes in financial inclusion should be evaluated by comparing the same indicator across survey rounds.
Financial access can change quickly when digital-payment systems expand, government transfers move into accounts, identification systems improve, smartphone use grows, or regulation changes. The one-year map is designed to show the current cross-country pattern; a time series is needed to discuss the speed and direction of change.
The 78 missing economies are not zero-access economies
Of the 217 rows in the country-and-economy table, 139 have a 2024 observation and 78 are source-missing. Missing means that a comparable 2024 value is unavailable in this series; it does not mean that no one in the subgroup has an account or uses mobile money. Missing economies are excluded from the median, ranking, and distribution calculations.
This distinction is important on the map. A blank economy should not be interpreted as having less financial access than a lightly shaded economy. Observed low values and missing observations are statistically different states and are kept separate.
Key takeaways
Across the 139 economies with 2024 observations, account ownership or mobile-money use among adults with secondary education or more ranges from 26.28% to 99.79%, with a median of 80.27%. There are 32 economies at 95% or more and 16 below 50%.
The main interpretation rules are straightforward: this is an education-subgroup indicator, it combines financial-institution accounts with mobile-money use, and missing observations are not zero. It is most informative when compared with overall adult access and the primary-education-or-less subgroup, while sex, age, and income breakdowns can reveal other dimensions of financial inclusion.
Frequently Asked Questions
What does the secondary-education-or-more account-access indicator measure?
It measures the share of people ages 15 and older in the secondary-education-or-more group who report a financial-institution account or personal mobile-money use in the previous 12 months.
Is this a bank-account-only measure?
No. It includes both accounts at financial institutions and personal use of mobile-money services.
What is the 2024 median?
The median across the 139 observed economies is about 80.27%.
Are missing observations treated as zero access?
No. Missing means a comparable 2024 observation is unavailable; it does not imply zero account or mobile-money use.
Related Articles
Green Map creates custom-edited map images using open geographic data sources such as geoBoundaries, Natural Earth, OpenStreetMap, and government open data.
These maps are edited visual materials, not raw data files, and are provided for education, documents, presentations, and graphic reference.