Among the 201 countries and economies with a reported 2023 value, the median share of merchandise exports going to low- and middle-income economies outside the reporting economy’s region is 11.4%. The mean is higher at 18.5%, because a relatively small group of economies reports shares above 60%, 70% or even 90%. This indicator is a share of export destinations, not a measure of the absolute value of exports.
World Bank indicator TX.VAL.MRCH.OR.ZS uses total merchandise exports of the reporting economy as the denominator. The numerator is merchandise exports to low- and middle-income economies located in other World Bank regions. Exports to low- and middle-income partners within the reporting economy’s own region are therefore not counted in the numerator. A high value does not by itself mean that an economy is a large exporter, runs a trade surplus or has faster export growth.
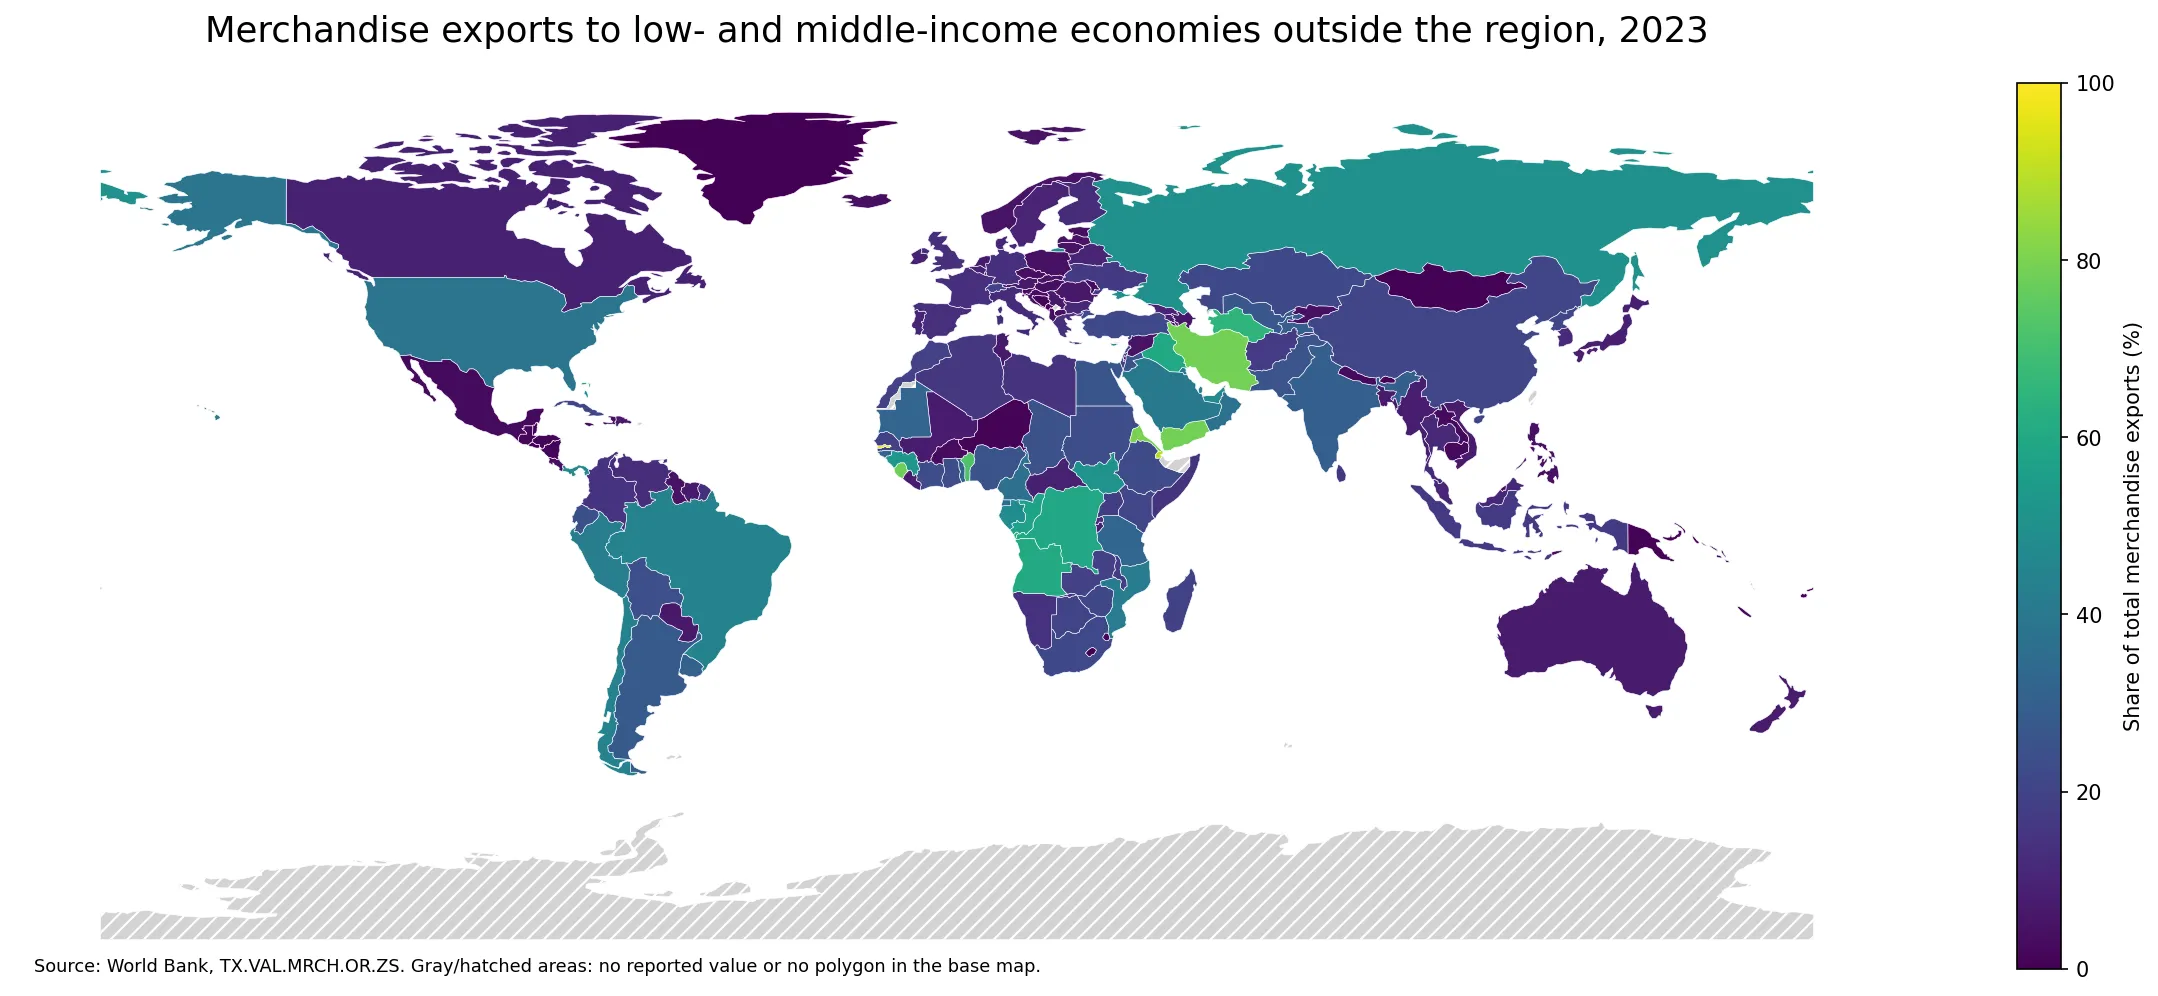
Table of Contents
The distribution is strongly skewed toward a smaller high-share group
The 25th percentile is 3.9% and the 75th percentile is 25.3%, so the middle half of reported economies lies between roughly 3.9% and 25.3%. The range is far wider. The highest reported value is The Gambia at 97.4%, while the lowest is Macao SAR, China at 0.1%. With a median of only 11.4%, the much higher mean of 18.5% reflects a long upper tail.
That shape matters for interpretation. Half of reported economies are at or below 11.4%, and one quarter are at or below 3.9%, yet the upper end contains several economies above 70%. A single world average therefore does not describe a typical export pattern very well. The map, quartiles and extremes are more informative when used together.
High shares stand out in parts of West Africa and around the Red Sea and Middle East
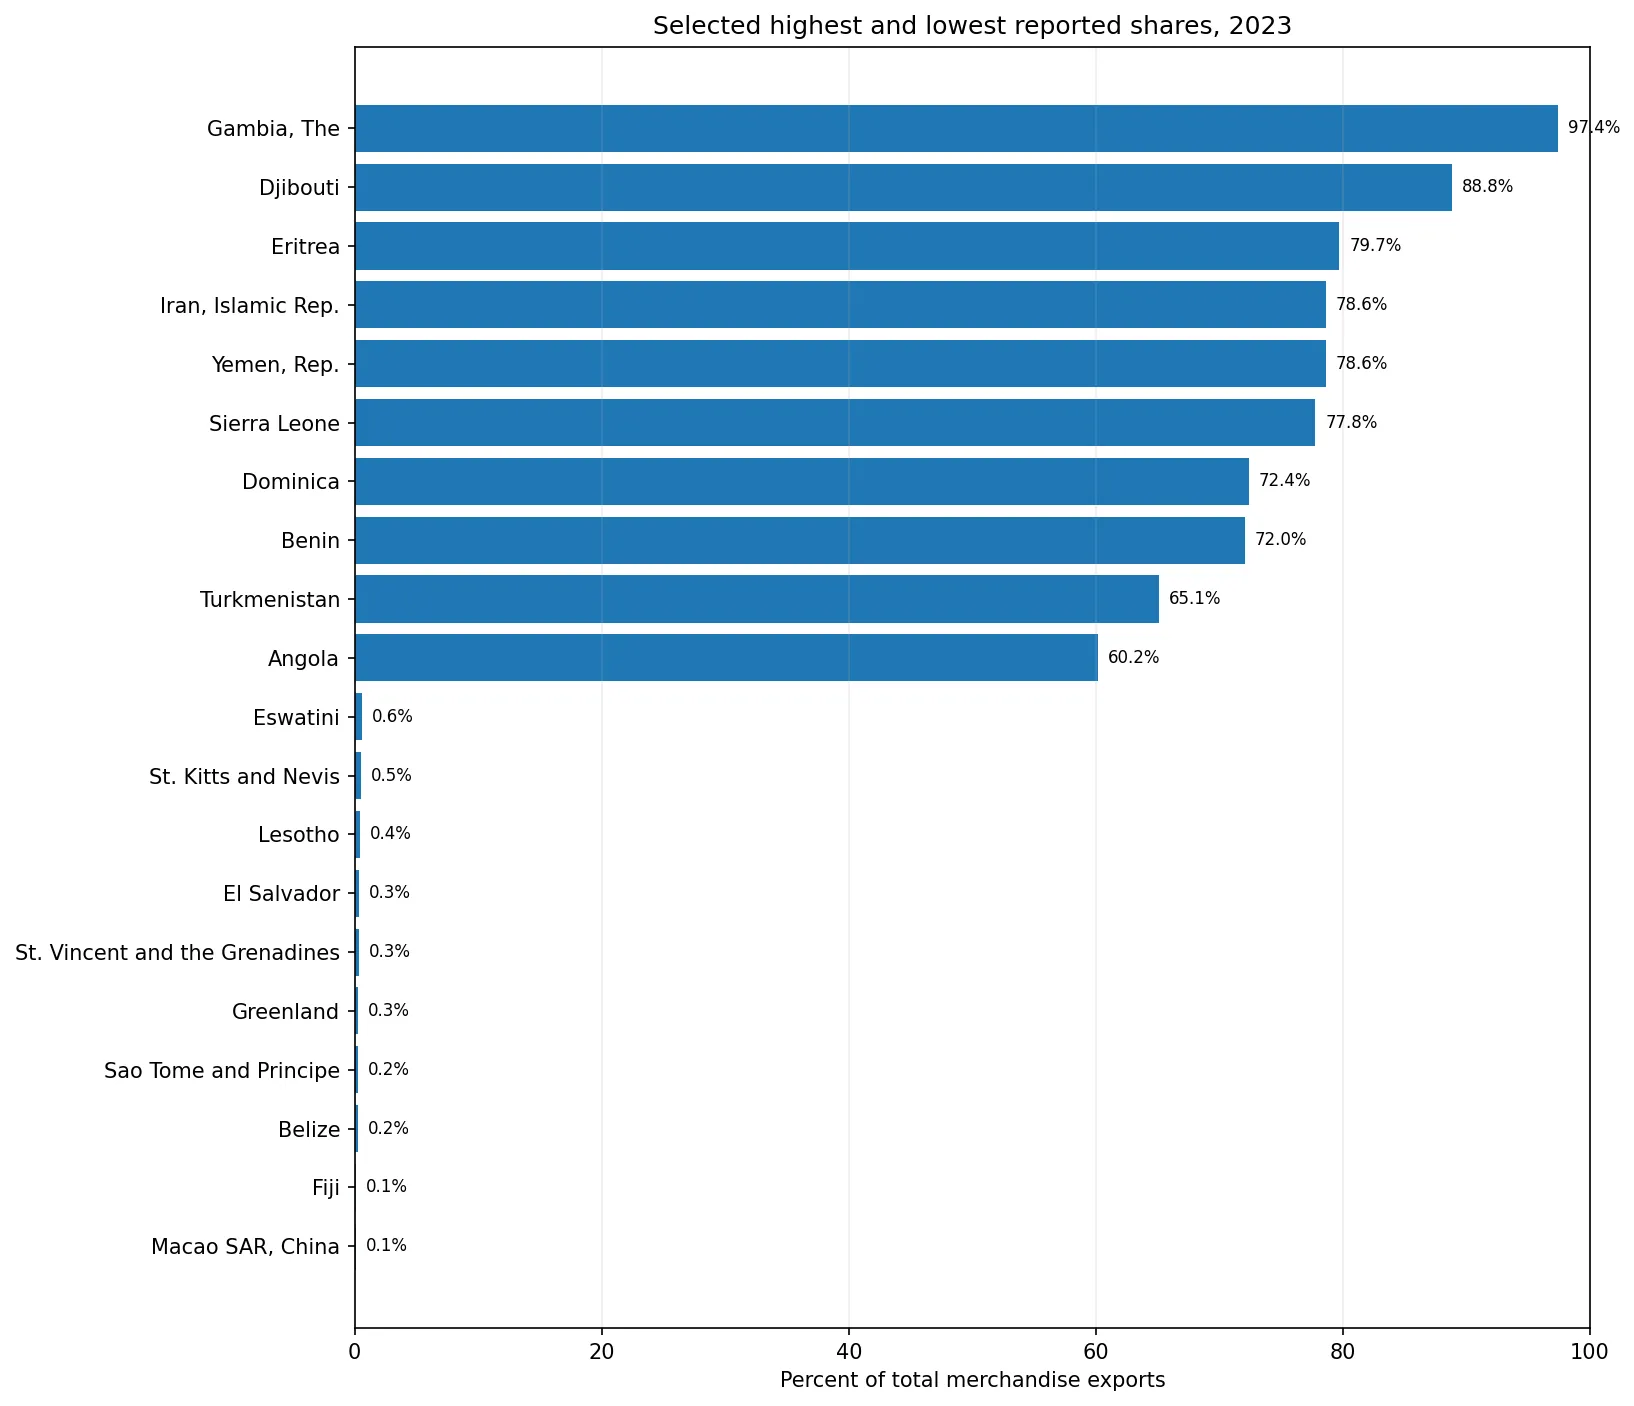
The Gambia leads the supplied observations at 97.4%, followed by Djibouti at 88.8%, Eritrea at 79.7%, Iran at 78.6%, Yemen at 78.6% and Sierra Leone at 77.8%. Dominica and Benin are just above 72%, while Turkmenistan and Angola remain above 60%. These values mean that a very large share of merchandise exports is directed to low- and middle-income markets outside the reporting economy’s World Bank region.
West Africa also shows why broad regional labels are insufficient. The Gambia is 97.4%, Sierra Leone 77.8%, Benin 72.0% and Guinea 52.8%, but Ghana is 22.8%, Nigeria 25.6%, Senegal 19.0% and Côte d’Ivoire 23.1%. Neighboring economies can have very different destination mixes because their export baskets, ports, trading relationships and links to markets outside the region differ.
Neighboring countries can sit far apart on the same measure
North America provides a clear contrast: the United States is 38.9%, Canada 9.3% and Mexico 2.7%. South America is also mixed. Brazil is 44.6%, Chile 43.6% and Peru 42.0%, compared with Colombia at 14.5% and Paraguay at 6.5%. Geography alone does not determine the ratio; the direction of actual merchandise trade matters more directly.
Europe mostly contains low or mid-range values, but there are notable exceptions. Russia reports 49.9% and Cyprus 47.6%, while Germany is 13.4%, France 13.4%, Italy 11.9% and Spain 13.1%. Poland is only 4.3% and Norway 5.0%. The measure therefore should not be treated as a simple divide between high-income and developing economies.
Asia contains both moderate and very low shares
China reports 20.5%, India 29.5% and Pakistan 25.9%. Japan is lower at 8.4%, as are Viet Nam at 7.1%, Thailand at 11.0%, Malaysia at 10.8% and the Philippines at 3.9%. Mongolia is only 0.7%. The spread indicates that economies within the same broad part of the world can have very different trade links to low- and middle-income markets in other regions.
Around the Middle East, Iran at 78.6%, Yemen at 78.6%, Iraq at 60.0%, the United Arab Emirates at 46.6% and Saudi Arabia at 40.5% are comparatively high. Jordan is 25.5% and Israel 19.7%. Even among economies with substantial commodity or energy trade, the destination mix is not uniform.
Top 10 reported shares
| Economy | Share of total merchandise exports |
|---|---|
| Gambia, The | 97.4% |
| Djibouti | 88.8% |
| Eritrea | 79.7% |
| Iran, Islamic Rep. | 78.6% |
| Yemen, Rep. | 78.6% |
| Sierra Leone | 77.8% |
| Dominica | 72.4% |
| Benin | 72.0% |
| Turkmenistan | 65.1% |
| Angola | 60.2% |
Bottom 10 reported shares
| Economy | Share of total merchandise exports |
|---|---|
| Macao SAR, China | 0.1% |
| Fiji | 0.1% |
| Belize | 0.2% |
| Sao Tome and Principe | 0.2% |
| Greenland | 0.3% |
| St. Vincent and the Grenadines | 0.3% |
| El Salvador | 0.3% |
| Lesotho | 0.4% |
| St. Kitts and Nevis | 0.5% |
| Eswatini | 0.6% |
What does a very low share actually mean?
At the bottom of the reported distribution are Macao SAR, China at 0.1%, Fiji at 0.1%, Belize at 0.2%, São Tomé and Príncipe at 0.2% and Greenland at 0.3%. A low value does not mean merchandise exports are necessarily small. Exports can instead be concentrated in high-income markets or in low- and middle-income partners located within the same World Bank region. Smaller economies may also have highly concentrated export baskets and partner structures, making the ratio more sensitive to changes in a few trade flows.
The “outside region” condition is essential. This is not the share of exports going to all low- and middle-income economies. Low- and middle-income partners in the reporting economy’s own region are excluded from the numerator. Economies with strong intraregional trade can therefore post a low value even when low- and middle-income markets are important to their total exports.
What this indicator can and cannot tell you
- It measures the share of total merchandise exports going to low- and middle-income economies outside the reporting economy’s region.
- It does not measure the absolute value of exports, the trade balance, export growth or exporter profitability.
- A high share indicates greater exposure to these destination markets, but it is not by itself a measure of market risk, diversification quality or growth potential.
- A low share can coexist with large exports if trade is concentrated in high-income markets or in partners within the same region.
- Missing 2023 observations were kept as missing rather than converted to zero.
Data and method
The analysis uses World Bank indicator TX.VAL.MRCH.OR.ZS for 2023. The source file contains 217 country or economy rows. Numeric values are reported for 201 rows and 16 are source-missing. Summary statistics and rankings use only the 201 reported observations. From those values, the mean is 18.5%, the median 11.4%, the 25th percentile 3.9% and the 75th percentile 25.3%.
The world map joins ISO3 codes to a standard boundary layer. Of the 201 economies with reported values, 167 have a matching polygon in that layer. Several small islands, territories and special administrative areas do not have a separate polygon at this map resolution; their values remain included in the full statistics and the ranking tables. Missing source values were never replaced with zero.
Frequently Asked Questions
Does a high value mean the economy exports a large amount of goods?
Not necessarily. The indicator is a percentage of total merchandise exports, so an economy with modest export value can still have a high share if these destinations account for most of its exports.
Are exports to low- and middle-income economies in the same region included?
No. The numerator covers low- and middle-income economies outside the reporting economy’s World Bank region, so intraregional partners are excluded.
Were economies without a 2023 observation treated as zero?
No. The 16 source-missing rows remained missing and were excluded from the mean, median, quartiles and rankings.
Related Articles
Green Map creates custom-edited map images using open geographic data sources such as geoBoundaries, Natural Earth, OpenStreetMap, and government open data.
These maps are edited visual materials, not raw data files, and are provided for education, documents, presentations, and graphic reference.