World Bank indicator AG.LND.CREL.HA shows the absolute area of land under cereal production in hectares. In 2023, the supplied country-and-area dataset contains 217 rows, of which 180 have numeric observations and 37 are source-missing. India reports the largest area at 103,715,108 hectares, followed by China at 99,987,255 hectares and the United States at 55,537,673 hectares.
This is an absolute-area indicator, not a percentage. A large country with extensive cereal farming can therefore rank high even if cereals occupy only a modest share of its total land. Conversely, a small country can devote a substantial fraction of its agricultural land to cereals and still have a small number of hectares. The indicator is best used to answer a simple question: how much land area is reported under cereal production?
The World Bank definition says land under cereal production generally refers to harvested area, although some countries report only sown or cultivated area. Cereals include wheat, rice, maize, barley, oats, rye, millet, sorghum, buckwheat and mixed grains. Production data refer to crops harvested for dry grain. Crops harvested for hay, green food, feed or silage, and crops used for grazing, are excluded from this cereal definition.
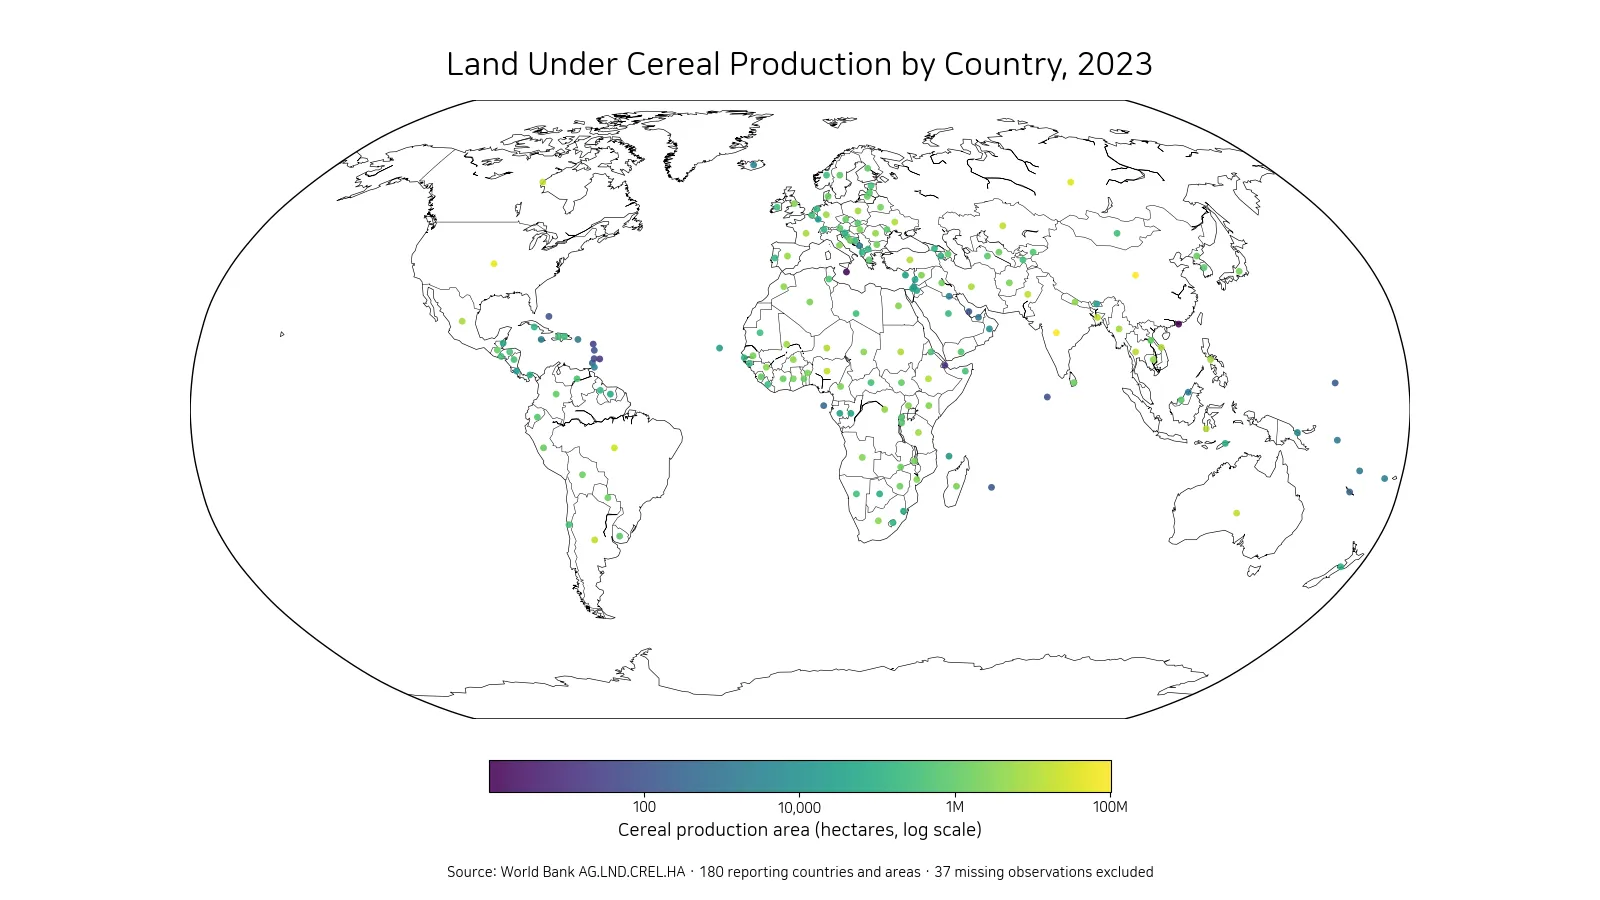
Table of Contents
India and China are both near 100 million hectares
India reports about 103.72 million hectares under cereal production, and China is close behind at 99.99 million hectares. The United States reports 55.54 million hectares, the Russian Federation 43.17 million hectares, and Brazil 29.21 million hectares. Together, these five observations account for about 44.9% of the sum across the 180 reporting rows in this dataset.
| Rank | Country or area | Cereal production area |
|---|---|---|
| 1 | India | 103,715,108 ha |
| 2 | China | 99,987,255 ha |
| 3 | United States | 55,537,673 ha |
| 4 | Russian Federation | 43,171,705 ha |
| 5 | Brazil | 29,209,839 ha |
| 6 | Nigeria | 18,112,703 ha |
| 7 | Argentina | 16,379,888 ha |
| 8 | Kazakhstan | 16,277,911 ha |
| 9 | Canada | 16,033,993 ha |
| 10 | Australia | 16,024,469 ha |
Nigeria, Argentina, Kazakhstan, Canada and Australia complete the top 10. The 10 largest observations account for about 56.1% of the sum of the 180 reported values. That share should not be described as a complete world total because 37 country-or-area rows have no 2023 observation in the source file. It is a concentration measure within the reported dataset.
The geographic pattern is broad rather than confined to a single region. Very large areas appear in South and East Asia, North America, South America, Eurasia and Australia. What these countries share in the dataset is scale: they devote millions or tens of millions of hectares to cereals. The map is therefore especially useful for seeing where large absolute cereal areas are located.
The median is only about 689,000 hectares
The distribution is strongly right-skewed. The median reported area is 689,278 hectares, while the simple mean is 4.10 million hectares. The first quartile is 102,323 hectares and the third quartile is 2,922,762 hectares. Half of the numeric observations therefore fall between roughly 102 thousand and 2.92 million hectares.
The large gap between the mean and median is driven by a small number of very large agricultural economies. India and China each approach 100 million hectares, while most reporting units are far below 10 million hectares. For a “typical” reporting country or area, the median and quartiles are more informative than the mean alone.
By broad size bands, 45 observations are below 100,000 hectares, 56 are from 100,000 to under 1 million, 61 are from 1 million to under 10 million, and 18 are 10 million hectares or higher. The distribution is therefore wide even before the very largest countries are considered.
At the low end, reported areas can be only a few hectares
Among positive numeric values, Djibouti reports 9 hectares, Barbados 15, Antigua and Barbuda 27, St. Vincent and the Grenadines 45, and The Bahamas 79. The Maldives reports 84 hectares, Dominica 115, and Qatar 121. These values are several orders of magnitude smaller than the leading countries.
| Rank | Country or area | Cereal production area |
|---|---|---|
| 1 | Djibouti | 9 ha |
| 2 | Barbados | 15 ha |
| 3 | Antigua and Barbuda | 27 ha |
| 4 | St. Vincent and the Grenadines | 45 ha |
| 5 | Bahamas, The | 79 ha |
| 6 | Maldives | 84 ha |
| 7 | Dominica | 115 ha |
| 8 | Qatar | 121 ha |
| 9 | Mauritius | 129 ha |
| 10 | Micronesia, Fed. Sts. | 169 ha |
The dataset also contains 2 numeric observations equal to zero. A reported zero is not the same as a missing value. The 37 source-missing rows are preserved as missing rather than converted to zero, which prevents countries without a 2023 observation from being incorrectly placed at the bottom of the ranking.
The map emphasizes scale, not agricultural intensity
The map highlights large absolute cereal areas in India and China, the United States and Canada, Brazil and Argentina, the Russian Federation and Kazakhstan, Australia, and several other major agricultural countries. Those patterns reflect the location of large cereal-producing land areas, but they do not measure what percentage of national territory is used for cereals.
Country size matters greatly. A small country can use a high proportion of its available farmland for cereals and still report a small absolute area. A large country can report millions of hectares even when cereals represent a smaller fraction of its total land. For land-use intensity, a percentage indicator or a calculation using total land area would be needed.
The visual uses a logarithmic scale only to make the enormous range visible on one map. The underlying values are not replaced or rescaled in the tables or calculations. A marker representing 100 million hectares still comes from the original 100-million-hectare observation; the log transformation is only a display choice.
Cereal production area is different from agricultural-land share
Agricultural land share, arable land share and land under cereal production are related but distinct concepts. Agricultural land share describes the portion of land used for agriculture. Arable land share focuses on land under temporary crops, temporary meadows and related arable uses. Cereal production area is a crop-specific absolute area measured in hectares.
This distinction explains why rankings can differ sharply across the three indicators. A country may have an extensive agricultural territory but devote much of it to pasture or non-cereal crops. Another may have a smaller agricultural base but a relatively large cereal area. Comparing indicators is useful only when the numerator, denominator and unit are kept clear.
The 37 missing observations must remain separate from zeros
The source file includes 217 country-or-area rows, but only 180 contain a numeric 2023 observation. The other 37 are explicitly marked as source-missing. Replacing those missing values with zero would assert that cereal area was measured and found to be zero, which is not what the source says.
All rankings, the mean, the median, quartiles and the map therefore use the 180 numeric observations. The missing rows remain in the package as missing so that future updates can distinguish “not reported for this year” from “reported as zero.” This is especially important at the lower end of an area distribution.
A large cereal area does not automatically mean high output or productivity
Area tells us how much land is under cereal production, but not how much cereal is harvested from each hectare. Total production also depends on crop choice, weather, irrigation, soils, inputs, management and yields. Two countries with the same cereal area can produce very different quantities if their yields differ.
Productivity analysis requires a yield indicator, while food-balance or trade analysis requires production quantities, imports and exports. This 2023 map should therefore be treated as an area comparison. It provides geographic context for cereal agriculture without making claims about output efficiency, food security or farm profitability.
One year does not establish a long-term trend
The comparison is a cross-sectional snapshot for 2023. It cannot show whether cereal area in a particular country has been expanding or contracting over time. A trend analysis would need the same indicator across multiple years and should examine whether abrupt changes reflect genuine land-use shifts, weather-related planting decisions, crop substitution or revisions in national reporting.
Using a common indicator code helps keep the statistical definition consistent across years, but historical interpretation still benefits from checking source notes. Some countries may report harvested area while others report sown or cultivated area, as the World Bank definition itself notes. Very small year-to-year differences should not be overinterpreted without that context.
Three points matter most in the 2023 comparison
First, India and China each report roughly 100 million hectares under cereal production, with the United States, the Russian Federation and Brazil forming the next large group. Second, the median is only about 689,000 hectares, demonstrating how strongly the largest countries stretch the distribution. Third, 37 source-missing rows are kept separate from genuine zero values.
For a broader view of land use, this absolute-area indicator works well alongside agricultural-land and arable-land measures. The key is to keep units separate: cereal area is hectares, land shares are percentages, production is typically measured in tonnes, and yield is production per unit of area. Once those distinctions are preserved, the map becomes a useful entry point for comparing the physical scale of cereal agriculture across countries.
Frequently Asked Questions
Is land under cereal production the same as agricultural land share?
No. This indicator is an absolute area in hectares. Agricultural land share is a percentage of a broader land base, so the two measures answer different questions.
Which country reports the largest cereal production area in 2023?
In the supplied World Bank AG.LND.CREL.HA data, India is highest at 103,715,108 hectares, followed by China at 99,987,255 hectares and the United States at 55,537,673 hectares.
Were missing 2023 observations treated as zero?
No. Of 217 country-or-area rows, 180 have numeric values and 37 are source-missing. Missing observations remain missing and are excluded from the rankings and summary statistics.
Related Articles
Green Map creates custom-edited map images using open geographic data sources such as geoBoundaries, Natural Earth, OpenStreetMap, and government open data.
These maps are edited visual materials, not raw data files, and are provided for education, documents, presentations, and graphic reference.