Access to at least basic sanitation is close to universal in many places, yet the 2024 country-and-area distribution still contains a very long lower tail. The supplied World Bank table contains 193 non-missing 2024 observations and 24 rows with no value. The median among reported observations is 93.93%, while the simple unweighted mean is only 80.77%. That gap between the median and mean is a useful first signal: most reported economies are clustered high on the scale, but a smaller group with very low coverage pulls the average down sharply.
The indicator has a specific service definition. “At least basic sanitation services” means using an improved sanitation facility that is not shared with other households. People using safely managed sanitation services are included because safely managed service is above the basic threshold. The measure is therefore broader than safely managed sanitation, but narrower than simply asking whether a household has any toilet or latrine.
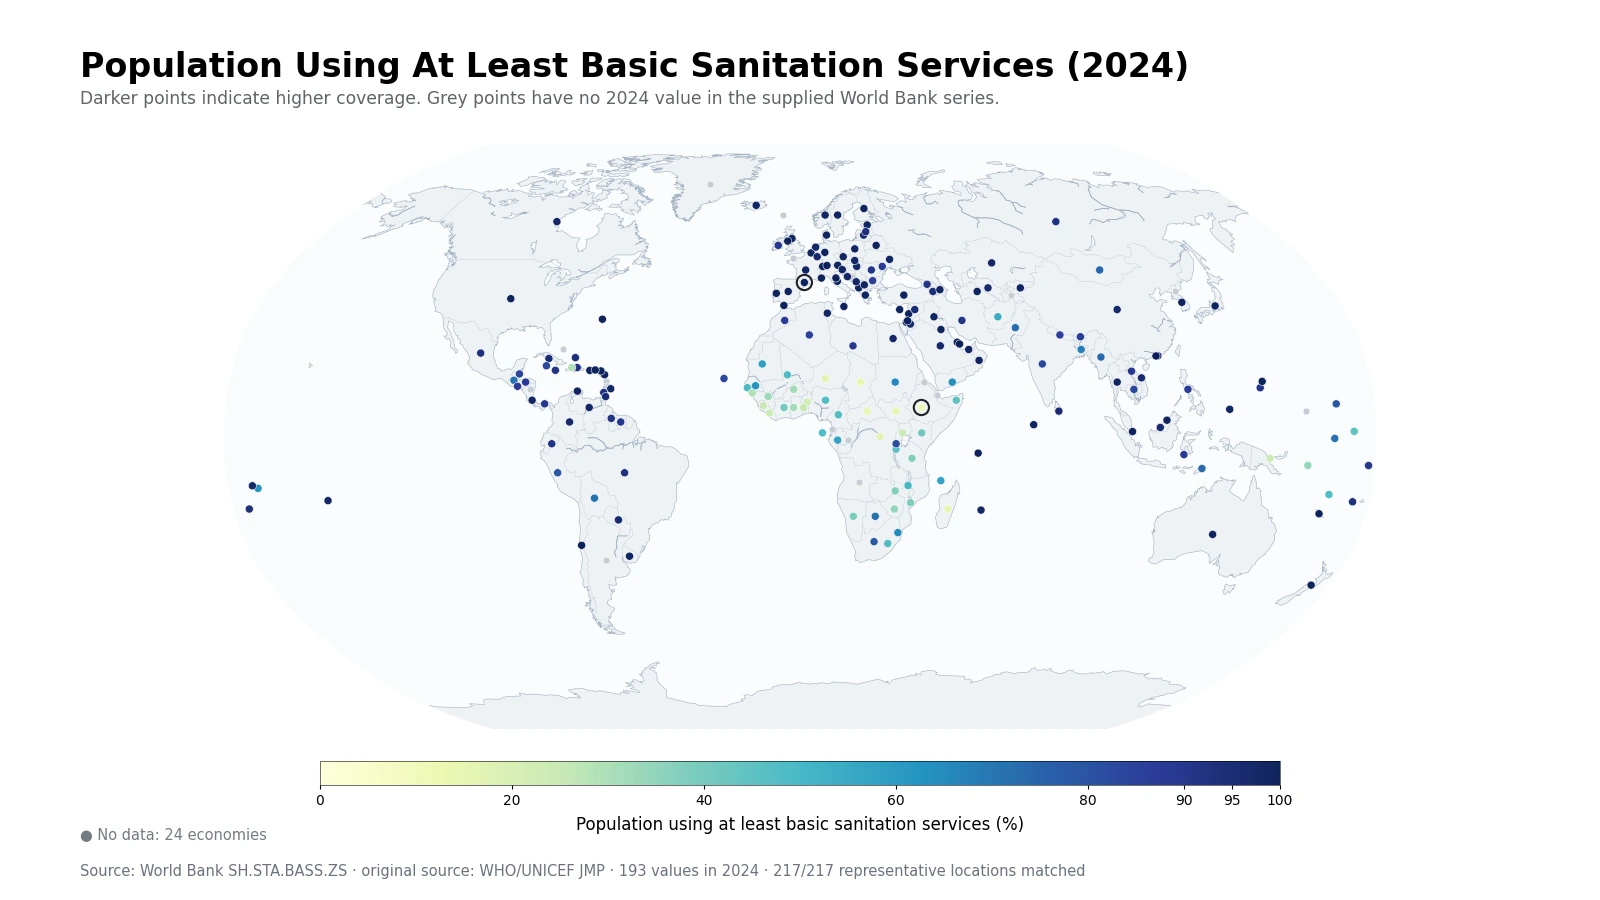
Table of Contents
What qualifies as at least basic sanitation
World Bank metadata follows the WHO/UNICEF Joint Monitoring Programme for Water Supply, Sanitation and Hygiene. An improved sanitation facility is designed to hygienically separate human excreta from human contact. Examples can include flush or pour-flush systems connected to sewers, septic tanks or pit latrines; ventilated improved pit latrines; composting toilets; and pit latrines with slabs. For the basic service level, the improved facility must not be shared with another household.
That last condition matters. An improved toilet shared by multiple households is categorized as a limited sanitation service rather than basic service. At the other end of the service ladder, safely managed sanitation meets the basic conditions and also requires excreta to be safely disposed of in situ or transported and treated off site. Because people with safely managed service are included in “at least basic,” this indicator measures the population at or above the basic threshold, not the share meeting the highest service standard.
A value of 100% therefore should not be expanded into a claim that wastewater treatment, sewer coverage, maintenance, cleanliness, accessibility, or user experience is perfect everywhere. It means the estimated population meets at least the internationally defined basic sanitation threshold. More detailed questions need the safely managed indicator, service-type data, or national and subnational infrastructure statistics.
The lower tail is concentrated and substantial
Ethiopia has the lowest 2024 value in the supplied table at 10.36%. Chad is at 13.14%, the Central African Republic at 14.04%, South Sudan at 14.43%, Madagascar at 15.37%, the Democratic Republic of the Congo at 16.30%, and Niger at 16.34%. Twelve reported economies are below 25%, and 37 are below 50%. The map shows a clear concentration of low coverage across parts of Sub-Saharan Africa, with additional low observations in a few island and fragile contexts.
| Rank | Country/area | Population using at least basic sanitation |
|---|---|---|
| 1 | Ethiopia | 10.4% |
| 2 | Chad | 13.1% |
| 3 | Central African Republic | 14.0% |
| 4 | South Sudan | 14.4% |
| 5 | Madagascar | 15.4% |
| 6 | Congo, Dem. Rep. | 16.3% |
| 7 | Niger | 16.3% |
| 8 | Benin | 22.2% |
| 9 | Liberia | 23.3% |
| 10 | Papua New Guinea | 23.6% |
| 11 | Uganda | 23.9% |
| 12 | Sierra Leone | 24.9% |
| 13 | Togo | 25.2% |
| 14 | Guinea-Bissau | 28.9% |
| 15 | Haiti | 29.1% |
The indicator does not identify a single cause for those gaps. Sanitation coverage can be shaped by urbanization, dispersed rural settlement, household income, infrastructure investment, land tenure, water availability, local construction practices, public institutions, conflict, disasters, and maintenance. The supplied cross-section contains the coverage percentage, not the explanatory variables required to isolate those factors. The safest use of the map is to identify where coverage gaps are largest and then investigate causes with additional official evidence.
High coverage is common, so the upper end needs context
At the other end of the distribution, 113 of the 193 reported observations are at or above 90%, and 93 are at or above 95%. Sixteen are recorded at exactly 100%. That 100% group includes Andorra, Australia, Bahrain, Brunei Darussalam, Kuwait, Monaco, Malta, New Zealand, and Singapore, among others. When so many places are tightly packed near the ceiling, tiny differences such as 99.7% versus 99.9% should not be treated as a meaningful league table.
| Coverage band | Economies | Share of 193 reported values |
|---|---|---|
| Below 25% | 12 | 6.2% |
| 25% to under 50% | 25 | 13.0% |
| 50% to under 75% | 18 | 9.3% |
| 75% to under 90% | 25 | 13.0% |
| 90% to under 95% | 20 | 10.4% |
| 95% to under 100% | 77 | 39.9% |
| 100% | 16 | 8.3% |
The distribution explains why the unweighted mean of 80.77% is much lower than the median of 93.93%. Seventy-seven observations fall between 95% and just under 100%, with another 16 at 100%, but the lower tail stretches all the way to about 10%. In a ceiling-heavy distribution like this, the median and the number of economies below 50% are often more informative than the mean alone.
Selected countries show wide differences within the same year
The same 2024 indicator records 99.6% for the United States, 97.3% for China, 83.4% for India, 99.9% for Japan, 99.2% for Germany, 98.6% for France, and 99.1% for the United Kingdom. Brazil is at 92.4%, Mexico 93.0%, and Indonesia 88.2%. The Republic of Korea is 99.7%.
The contrast remains large among other populous economies: South Africa is 77.4%, Nigeria 47.9%, Pakistan 71.9%, Bangladesh 67.6%, and Ethiopia 10.4%. Because all of these observations refer to 2024, the differences are not being created by mixing distant reference years. They are still national averages, however, and can conceal large urban-rural or income-related gaps within a country.
Coverage percentage is not the same as the number of people unserved
A percentage describes population composition, not the absolute number of people lacking basic sanitation. A large country at 90% can have more people without basic service than a small country at 60%. For investment planning, public-health programs, or estimates of infrastructure needs, the coverage percentage should be paired with total population and, ideally, the estimated number of people below the basic threshold.
National coverage can also hide who is being left behind. Urban and rural populations can differ sharply, and the same is true across income groups, informal settlements, regions, disability status, or housing types. A country-level figure answers a national coverage question; it cannot reveal the location or circumstances of every unserved household. Subnational and disaggregated WASH data are needed for that level of analysis.
Basic and safely managed sanitation are different service levels
The distinction between basic and safely managed sanitation is essential for interpreting high values. Basic service requires an improved facility that is not shared with other households. Safely managed service adds requirements about how excreta are disposed of or treated. As a result, an economy can report 99% at least-basic coverage while having a lower safely managed share. The at-least-basic indicator is an access threshold, not a complete score for the sanitation chain.
Sanitation should also be kept separate from drinking water and handwashing indicators. These are related parts of WASH, but they measure different services and often use different denominators or facility criteria. A household may meet the sanitation threshold without meeting a safely managed drinking-water standard, and school handwashing infrastructure is a different unit of observation again. Combining WASH indicators is useful only when each definition remains clear.
Source, missing data, and map interpretation
The country values come from World Bank indicator SH.STA.BASS.ZS. World Bank identifies the WHO/UNICEF Joint Monitoring Programme for Water Supply, Sanitation and Hygiene as the underlying source. The formal definition and methodology are documented in the World Development Indicators metadata. The comparison uses one common reference year, 2024.
The source table retains 217 country-and-area rows. Of those, 193 have a 2024 value and 24 are missing. No missing value is converted to zero, and missing rows are excluded from rankings and summary statistics. The map links all 217 rows to representative geographic points so that small islands and separately reported territories remain visible: reported values are colored and missing rows are grey. Grey therefore means no 2024 value in this extract, not zero sanitation coverage.
Frequently Asked Questions
What counts as at least basic sanitation services?
It means using an improved sanitation facility that is not shared with other households. People using safely managed sanitation services are also included because safely managed service is above the basic threshold.
Does 100% basic sanitation coverage mean all wastewater is safely managed?
No. A 100% value means the population meets at least the basic service threshold. Safely managed sanitation adds requirements for safe disposal or treatment of excreta and is a separate higher-level indicator.
Do grey map points mean 0% sanitation coverage?
No. Grey indicates that no 2024 value is present in the supplied series. The 24 missing rows are not converted to zero and are excluded from rankings and summary statistics.
Is the 80.77% mean a population-weighted global sanitation rate?
No. It is a simple unweighted mean across the 193 reported country-and-area observations. A population-weighted global estimate is a different statistic.
Related Articles
- Rural basic drinking-water access by country
- Primary schools with basic handwashing facilities in 2024
- World Bank multidimensional poverty rate: latest country observations
Green Map creates custom-edited map images using open geographic data sources such as geoBoundaries, Natural Earth, OpenStreetMap, and government open data.
These maps are edited visual materials, not raw data files, and are provided for education, documents, presentations, and graphic reference.