The financial risk attached to needing surgery differed sharply across the economies with a reported 2022 value. World Bank indicator SH.SGR.CRSK.ZS measures the share of people at risk of catastrophic expenditure when surgical care is required. In this indicator, catastrophic expenditure means direct out-of-pocket payments for surgery and anaesthesia exceeding 10% of total income.
The source table contains 217 country and economy rows, but only 113 have a reported 2022 value; 104 are source-missing. Across the reported observations, the median is 10.8% and the mean is 21.6%, with values ranging from 0.0% to 100.0%. That spread makes the map and distribution more informative than a single global average.
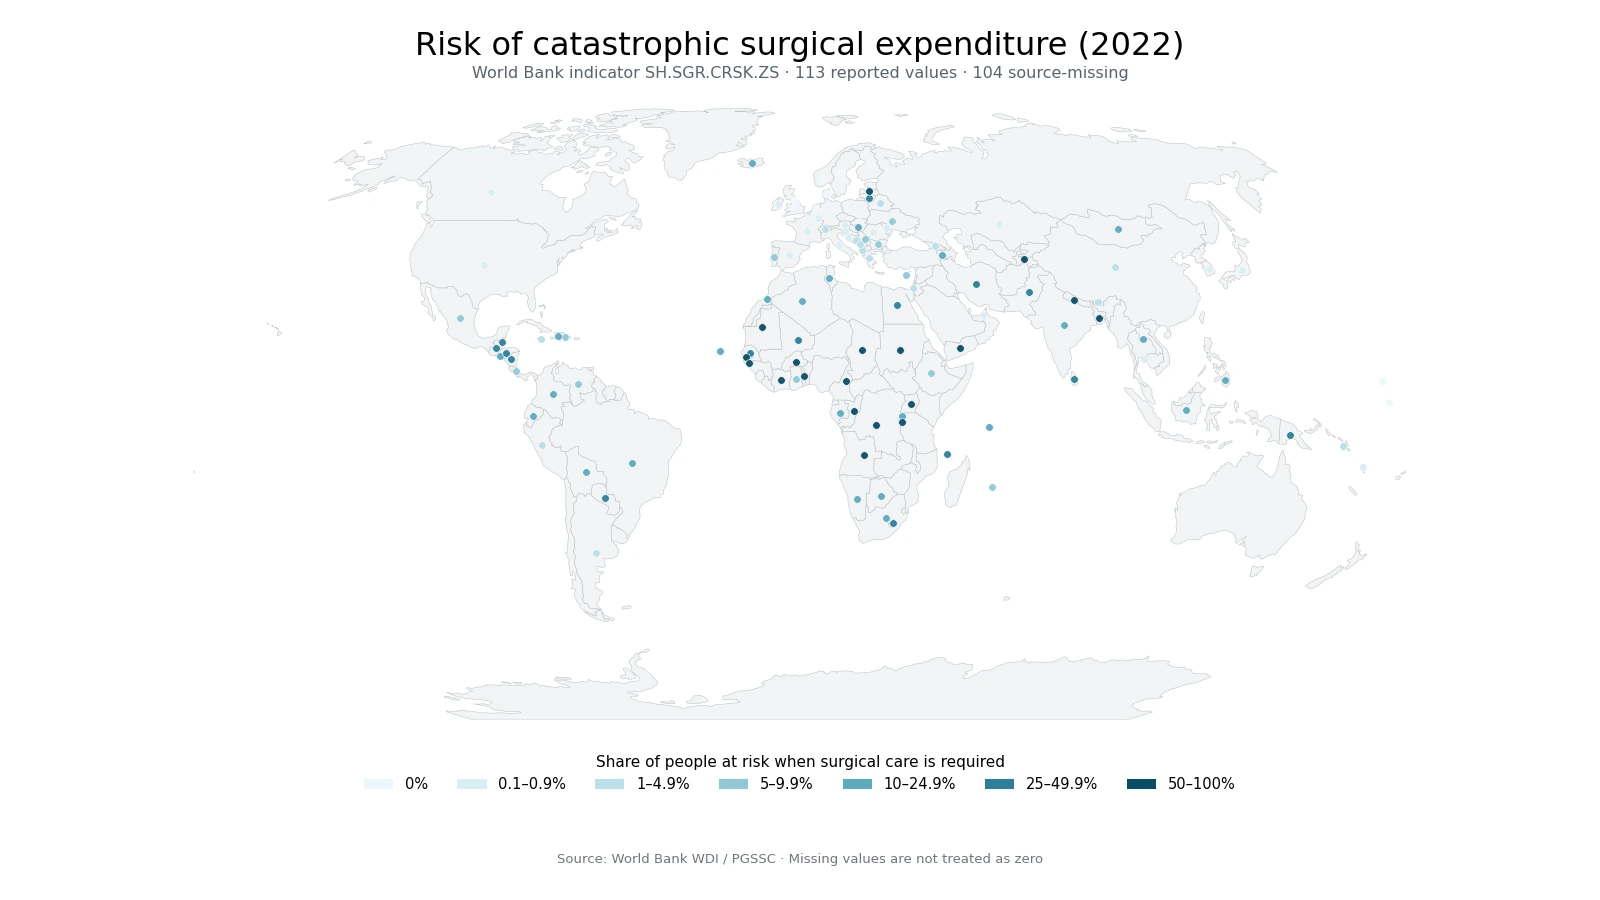
Table of Contents
Côte d’Ivoire reached 100%, while Burundi and Yemen were also above 90%
Among the 113 reported observations, Côte d’Ivoire had the highest value at 100.0%. Burundi followed at 97.8%, Yemen at 93.4%, Latvia at 89.9%, and Guinea-Bissau at 86.5%. The Democratic Republic of the Congo recorded 85.0%, Chad 82.4%, and Togo 72.4%. These are risk estimates for people who need surgical care, not the share of residents who actually underwent surgery and paid more than 10% of income during 2022.
| Rank | Country / economy | Population at risk |
|---|---|---|
| 1 | Cote d’Ivoire | 100.0% |
| 2 | Burundi | 97.8% |
| 3 | Yemen, Rep. | 93.4% |
| 4 | Latvia | 89.9% |
| 5 | Guinea-Bissau | 86.5% |
| 6 | Congo, Dem. Rep. | 85.0% |
| 7 | Chad | 82.4% |
| 8 | Togo | 72.4% |
| 9 | Mauritania | 69.1% |
| 10 | Uganda | 68.4% |
Several of the highest values form a geographic cluster across West and Central Africa, but the list also contains striking exceptions such as Latvia. That combination is important: the map can reveal both broad regional concentration and individual observations that do not fit a simple continental narrative. The indicator tells us where the modeled financial risk is high or low; it does not by itself explain the institutional or household-level reasons behind each value.
The median was 10.8%, but the mean rose to 21.6% because the distribution is strongly skewed
The first quartile of the reported values is 0.9%, the median is 10.8%, and the third quartile is 30.0%. The middle half of reported economies therefore lies between roughly 0.9% and 30.0%. The mean is 21.6%, almost twice the median, because a relatively small set of observations near the upper end pulls the average upward.
| Risk band | Observations | Share of 113 |
|---|---|---|
| 0% | 11 | 9.7% |
| 0.1–0.9% | 18 | 15.9% |
| 1–4.9% | 14 | 12.4% |
| 5–9.9% | 12 | 10.6% |
| 10–24.9% | 24 | 21.2% |
| 25–49.9% | 15 | 13.3% |
| 50–100% | 19 | 16.8% |
29 observations (25.7%) are below 1%, and 55 (48.7%) are below 10%. At the other end, 19 (16.8%) are at 50% or higher. That split shows why the country pattern should not be summarized as a typical worldwide rate. A visitor trying to understand financial protection gains more from seeing where the high-risk cluster is located and how neighboring countries differ.
West and Central Africa contain many high values, but neighboring observations still vary widely
In West Africa, Côte d’Ivoire recorded 100.0%, Togo 72.4%, Burkina Faso 56.2%, Mali 46.6%, and Senegal 28.4%, while Ghana was 9.1%. In Central Africa, the Democratic Republic of the Congo stood at 85.0%, the Republic of the Congo at 63.7%, Chad at 82.4%, and Cameroon at 54.3%. Those values create a visible high-risk concentration on the map.
The cluster should not be turned into a blanket statement about an entire continent. South Africa, for example, was 11.5% and Rwanda 17.3%, while several African economies have no 2022 value in this series. Explaining why the reported risks differ would require additional evidence about financial protection, household income, out-of-pocket payment arrangements, access to surgical care and other health-system characteristics. This dataset alone supports the geographic comparison, not a causal diagnosis.
South Asia and the Middle East also show large within-region gaps
Yemen recorded 93.4%, Tajikistan 68.2%, Nepal 58.2%, Bangladesh 51.0%, Pakistan 33.7%, Sri Lanka 29.2%, and India 20.4%. The range shows that geographically close economies can have very different estimated financial risks. Farther east, China was 3.7%, Japan 0.5%, and South Korea 0.1%.
The Middle East is similarly mixed. Yemen is at the extreme high end, while the United Arab Emirates reported 0.4%. Saudi Arabia and Oman are among the rows without a 2022 value, so their risk should not be inferred from neighboring observations. A blank or unplotted location on this map means “no value for this comparison year,” not “zero risk.”
Europe has many very low values, but Latvia and Lithuania stand out
Belgium, Denmark, Finland, Germany, the Netherlands, Norway, Sweden and the United Kingdom all reported 0.0%. France and Ireland were 0.1%, Austria 0.2%, and Italy and Spain 0.7%. Against that low-risk pattern, Latvia at 89.9% and Lithuania at 32.6% are conspicuous outliers.
An unusual value should not be removed merely because it looks different from its neighbors. The appropriate first step is to confirm that it is the official observation for the same indicator and year, which is the approach used here. The map therefore preserves Latvia’s reported 89.9% rather than smoothing it toward surrounding countries. Explaining the outlier would require additional country-specific evidence and is beyond what this single indicator can establish.
A reported 0% does not mean surgery is free or that households face no medical costs
Eleven economies report exactly 0.0%: Belgium, Denmark, Finland, Germany, Kiribati, the Marshall Islands, the Netherlands, Norway, the Slovak Republic, Sweden and the United Kingdom. A zero means the indicator’s estimated risk is zero under its defined catastrophic-spending threshold. It should not be expanded into a claim that every surgical service is free or that households experience no financial burden from health care.
Zero and missing are also fundamentally different data states. Zero is a reported value; missing means no usable 2022 observation is present in the source table. Treating the 104 missing rows as zeros would substantially distort the lower end of the distribution, the mean, the median and any ranking. All summary statistics in this analysis therefore use only the 113 reported observations.
This is a financial-risk indicator, not a count of surgery patients or a direct measure of access
The denominator is not “people who had surgery in 2022.” World Bank metadata describes the measure as the probability or risk of experiencing catastrophic expenditure when surgical care is required. The indicator therefore does not tell us the number of operations, waiting times, surgical mortality, the number of people who forgo care, or whether a hospital is geographically accessible. Those questions require different datasets.
The spending threshold is also specific. It concerns direct out-of-pocket payments for surgical and anaesthesia care exceeding 10% of total income. Indirect costs such as travel, accommodation, unpaid caregiving or lost earnings are not automatically captured by that definition, and neither are all other medical expenses. The safest interpretation is therefore “risk of catastrophic direct spending for surgical and anaesthesia care,” not “overall medical-cost burden.”
The 104 source-missing rows are a major limit on global coverage
Only 113 of 217 rows have a reported 2022 value, leaving 104 source-missing rows, or about 47.9% of the table. Coverage is therefore far from complete. The map answers a narrower question: how did the reported 2022 values differ geographically? It does not provide a complete ranking of every country in the world.
No earlier or later year was substituted for a missing 2022 value, and no neighboring value was used as an estimate. This preserves the single-year comparison but also means that some regions have visibly sparse coverage. The reporting universe includes countries and separately reported economies and territories, so the 217 source rows should not be interpreted as a sovereign-country count.
Source and calculation method
The analysis uses 2022 observations from World Bank indicator SH.SGR.CRSK.ZS. World Bank metadata defines the measure as the proportion of people at risk of catastrophic expenditure when surgical care is required, with catastrophic spending defined as direct out-of-pocket payments for surgical and anaesthesia care above 10% of total income. The source listed by the World Bank is the Program in Global Surgery and Social Change (PGSSC).
Maximum, minimum, mean, median, quartiles, band counts and rankings were calculated directly from the 113 non-missing 2022 values. Missing observations were neither estimated nor replaced with zero. The map assigns a representative geographic point to all 113 reported observations so that small islands and separately reported territories can remain visible; point size does not represent population or risk, while color encodes the risk band.
Frequently Asked Questions
What does the risk of catastrophic surgical expenditure measure?
It measures the share of people at risk that direct out-of-pocket payments for surgery and anaesthesia would exceed 10% of total income when surgical care is required. It is not simply the share of people who had surgery and paid that amount in 2022.
Which economy had the highest reported value in 2022?
Côte d’Ivoire had the highest reported value at 100.0%, followed by Burundi at 97.8%, Yemen at 93.4% and Latvia at 89.9%.
Does a reported 0% mean surgical care is free?
No. It means the indicator’s estimated catastrophic-spending risk is zero under the defined threshold. It does not mean every surgery is free or that households have no medical costs.
Were the 104 missing rows treated as zero?
No. Missing observations are excluded from rankings and summary statistics and are not plotted as reported values on the map.
Related Maps
Green Map creates custom-edited map images using open geographic data sources such as geoBoundaries, Natural Earth, OpenStreetMap, and government open data.
These maps are edited visual materials, not raw data files, and are provided for education, documents, presentations, and graphic reference.