How common is it for an employed person to run a business and continuously hire other workers? World Bank indicator SL.EMP.MPYR.ZS measures employers as a percentage of total employment under the ILO modelled-estimate framework. Among the 182 economies with a retained 2025 value, the median is 3.39% and the simple unweighted mean is 3.79%. Most observations sit in the low single digits, while a small group rises above 10%.
The word “employer” needs a precise reading here. It does not mean wage and salary employees, and it does not cover every self-employed person. It refers to people working on their own account or with partners who also engage one or more employees on a continuing basis. The map therefore describes one employment-status category, not a general score for entrepreneurship, business ownership, or labor-market quality.
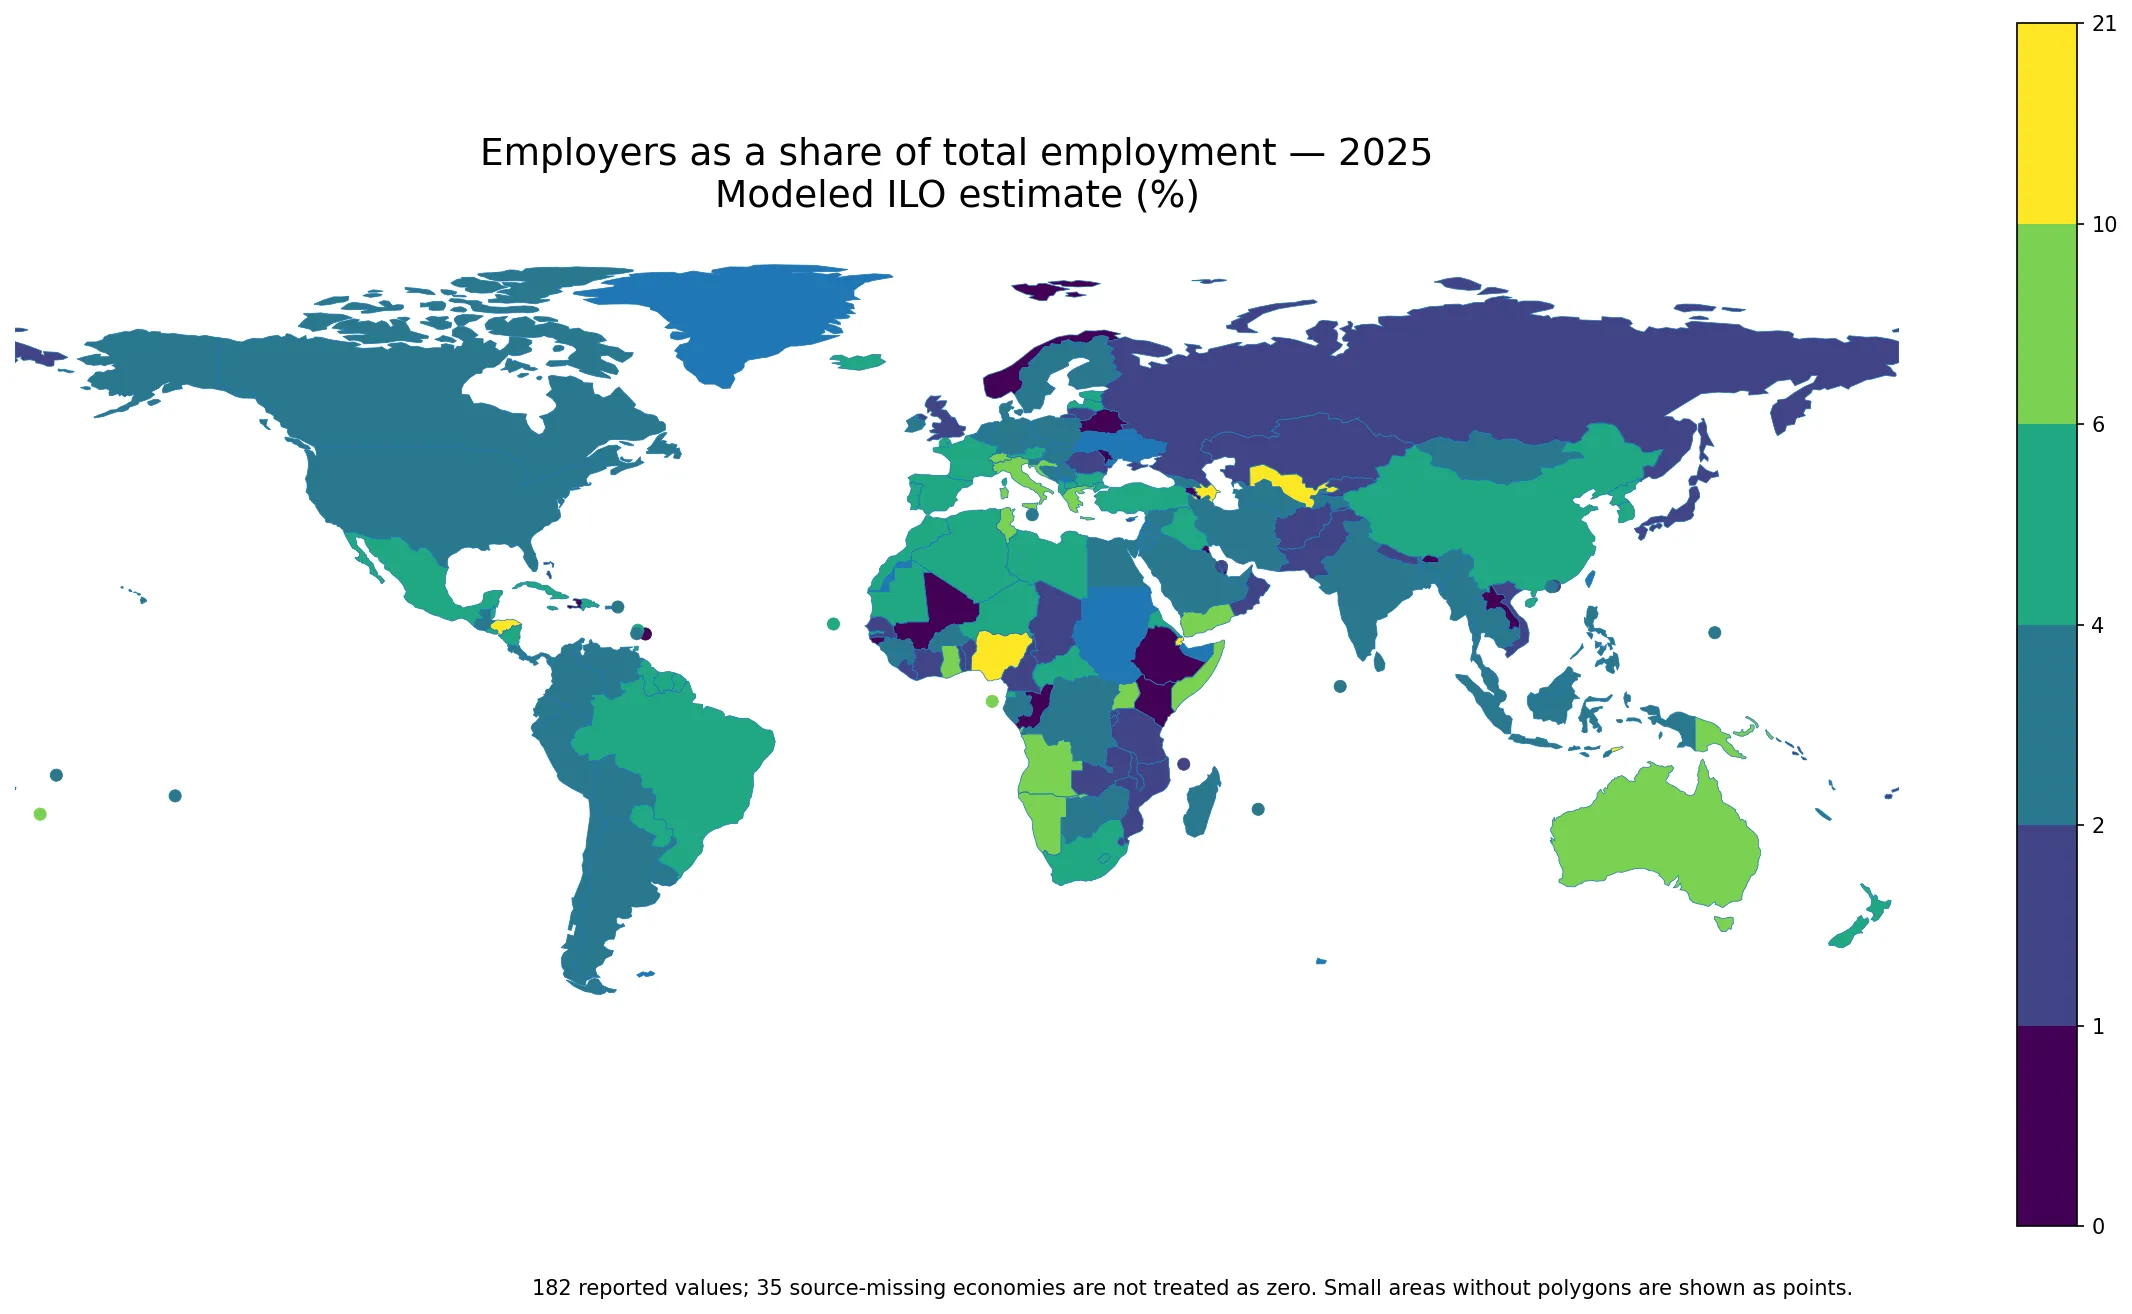
Table of Contents
What counts as an employer in this indicator
The World Bank metadata defines employers through the ILO status-in-employment framework. These are workers in self-employment jobs whose remuneration depends directly on the profits generated by their activity and who, in that capacity, have continuously engaged one or more people to work for them as employees. The published percentage is calculated as employers divided by total employment, multiplied by 100.
A 5% value can therefore be read as roughly five employers for every 100 employed people under this statistical framework. Someone who operates alone without hired employees belongs to a different category, commonly described as an own-account worker. That distinction matters because economies can have a large self-employed population but a much smaller employer share if most self-employed people work without employees.
The denominator is total employment, not the labor force and not the working-age population. Unemployed people are outside this denominator, as are people who are outside the labor force. This is why the series should not be mixed mechanically with unemployment or labor-force participation. Each measure answers a different question about the labor market.
The typical 2025 observation is near 3% to 4%
The distribution is concentrated well below 10%. The first quartile is 1.86%, the median is 3.39%, and the third quartile is 4.52%. Half of the 182 observations therefore lie between about 1.86% and 4.52%. The mean of 3.79% is slightly above the median because a small number of double-digit values pull the arithmetic average upward. This is an unweighted mean across economy observations, not a world employment-weighted employer rate.
| 2025 employer-share band | Economies |
|---|---|
| Below 1% | 15 |
| 1% to below 2% | 33 |
| 2% to below 4% | 71 |
| 4% to below 6% | 42 |
| 6% to below 10% | 15 |
| 10% or more | 6 |
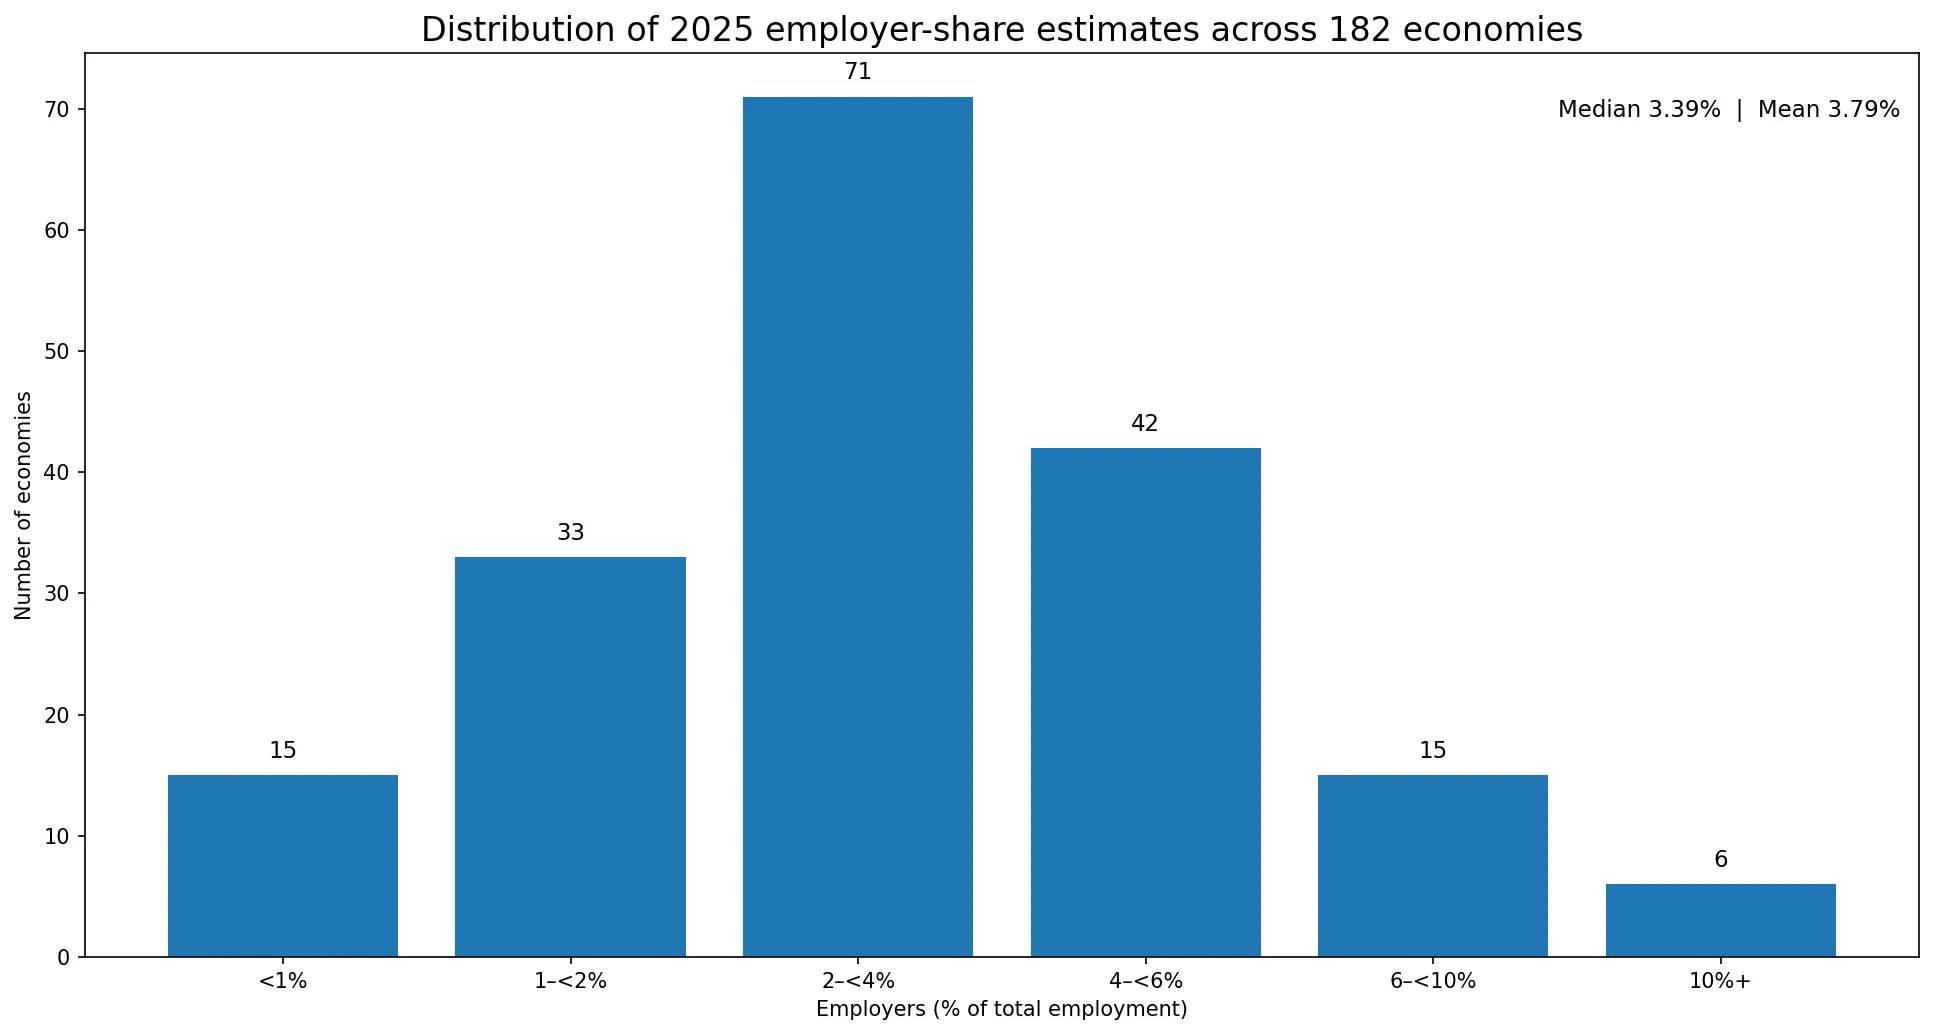
Seventy-one economies fall in the 2% to below 4% band, and another 42 are in the 4% to below 6% band. Together those two groups account for 113 of the 182 observations, about 62%. Fifteen are below 1%, while only six reach 10% or more. The pattern suggests that employers are a relatively small share of all employed people in most economies, even though the absolute number of employers can still be large in countries with very large workforces.
The map reveals sharp regional contrasts rather than one global divide
Several of the largest modelled values are geographically scattered. Djibouti is 20.83%, Nigeria 19.67%, Timor-Leste 16.23%, Azerbaijan 13.14%, Uzbekistan 12.12%, and Honduras 10.24%. These examples show where the upper end of the distribution appears, but they should not be turned into a precise league table. The source methodology explicitly cautions that model-imputed observations can carry substantial uncertainty, so broad bands and large contrasts are more defensible than tiny rank differences.
Africa illustrates the value of the map especially well. Djibouti and Nigeria are both above 19%, yet Ethiopia is 0.17%, Kenya 0.97%, Benin 1.31%, and Burkina Faso 2.04%. West Africa itself is not uniform: Nigeria is 19.67%, Ghana 7.50%, and Benin 1.31%. Geographic proximity can help identify contrasts worth investigating, but the dataset does not contain the sector mix, informality, firm-size distribution, tax system, labor regulation, or household-business structure needed to explain those differences.
A similarly wide spread appears across Europe and Eurasia. Azerbaijan is 13.14% and Uzbekistan 12.12%, while Armenia is 0.82%. Italy is 6.77%, Switzerland 7.26%, and France 4.79%, but Norway is 0.71%, Russia 1.39%, and the United Kingdom 1.62%. There is no simple “high-income versus low-income” split visible in the values. Economies at very different income levels appear in both the lower and higher parts of the distribution.
Selected large economies sit across several different bands
A selection of large and regionally varied economies helps show what the middle of the distribution looks like. The table is intentionally not a ranking. It places economies from different regions on the same 2025 reference year so the differences can be read without mixing dates.
| Economy | Employers (% of total employment), 2025 |
|---|---|
| Australia | 6.98% |
| Italy | 6.77% |
| South Africa | 5.61% |
| Mexico | 5.54% |
| France | 4.79% |
| China | 4.27% |
| Brazil | 4.21% |
| Germany | 3.80% |
| Canada | 3.35% |
| India | 3.32% |
| United States | 2.26% |
| United Kingdom | 1.62% |
| Japan | 1.56% |
| Norway | 0.71% |
Australia and Italy are in the 6% range, Mexico and South Africa in the 5% range, and France, China, and Brazil in the 4% range. Germany, Canada, and India sit around 3% to 4%, while the United States is at 2.26% and the United Kingdom and Japan are below 2%. Even within broadly similar income groups, the employer share can differ materially.
The percentage alone does not reveal the number of employers. A country with a vast workforce can have a low employer share and still contain many millions of people in employer status, while a small economy can post a high percentage with a far smaller absolute count. Converting these percentages into employer counts would require matching each economy to a compatible total-employment estimate.
This is not an entrepreneurship rate or a count of businesses
It is tempting to treat the employer share as a measure of entrepreneurship, but that would stretch the indicator beyond its definition. Entrepreneurship statistics often examine business entry, new firms, ownership, innovation, survival, or self-employment more broadly. This series asks a narrower question: among people who are employed, what share are classified as employers because they operate in self-employment and continuously hire employees?
The measure also does not map one person to one registered business. A person may own more than one enterprise, a company may have several owners, and legal business registration does not always line up neatly with a worker’s status-in-employment classification. A country with many registered firms can still have a modest employer share if wage and salary employment is dominant.
Likewise, the indicator is only one part of self-employment. Own-account workers operate without employees and are tracked separately. Contributing family workers and other status groups are also distinct in labor statistics. For a fuller picture of employment structure, employer share is best read alongside own-account work, wage and salaried employment, vulnerable employment, participation, unemployment, hours, and earnings.
Why modelled estimates are better for broad patterns than precise rankings
The World Bank identifies the ILO Modelled Estimates database as the underlying source. The modelled series combines nationally reported labor statistics with statistical modelling used to improve consistency and fill gaps where direct observations are missing. That makes it possible to publish a broad same-year cross-section such as this 2025 dataset, which contains 182 values rather than a patchwork of different reference years.
The trade-off is uncertainty. World Bank metadata notes that imputed observations are not direct national data and can carry high uncertainty; it specifically warns against using such estimates for country ranking. For that reason, this article uses wide map bands—below 1%, 1% to below 2%, 2% to below 4%, 4% to below 6%, 6% to below 10%, and 10% or more—and treats the distribution as a pattern rather than a contest.
A higher employer share is not automatically better or worse. It may coexist with many different combinations of firm size, informality, sector structure, wages, productivity, social protection, and labor demand. The indicator says something useful about employment status, but it cannot by itself identify why a country has its observed value or whether workers are better off.
Data source and mapping method
The statistical source is World Bank World Development Indicators series SL.EMP.MPYR.ZS, Employers, total (% of total employment) (modeled ILO estimate). The World Bank metadata identifies ILOSTAT’s ILO Modelled Estimates database as the underlying source. The unit is percent of total employment and the periodicity is annual.
The supplied 2025 table contains 217 economy rows. A numeric value is present for 182 rows and 35 are marked as source-missing. All summary statistics, bands, selected examples, and map colors use only the 182 non-missing 2025 observations. Missing rows are not assigned a zero and no older observation is substituted into the same-year comparison.
For the map, country codes are joined to a low-resolution world boundary layer. One hundred sixty-three statistical rows match polygons after correcting the known France and Norway code exceptions in the boundary file. Nineteen small or special statistical areas are shown with point markers because they have no separate polygon at this scale. A gray or unfilled area therefore means that the 2025 value is missing or that a polygon is unavailable at the chosen map resolution; it should never be read as a 0% employer share.
Frequently Asked Questions
What does an employer share of 5% mean?
It means roughly five out of every 100 employed people are classified as employers—self-employed workers who continuously engage one or more employees—under this statistical framework.
Is this the same as the self-employment rate?
No. Employers are only the part of self-employment that hires employees. Own-account workers who work without employees are a separate category.
Are all values in this comparison from 2025?
Yes. The calculations and map use the 182 economy rows with a non-missing 2025 value. The 35 source-missing rows are not converted to zero or replaced with older values.
Can these modelled estimates be used to rank countries precisely?
They are better suited to broad patterns than precise rankings. The World Bank notes that model-imputed observations can carry substantial uncertainty, so small country differences should be treated cautiously.
Related Articles
Global Employment-to-Population Ratio Map – Ages 15+ in 2025 measures the share of the adult population that is employed rather than the status of people already in employment.
Unemployment Rate Map – Country Patterns in 2025 looks at people without work within the labor force, using a different denominator and a different labor-market question.
Labour Force Participation Rate 2025 compares the share of the age-15+ population that is either employed or unemployed and active in the labor market.
Green Map creates custom-edited map images using open geographic data sources such as geoBoundaries, Natural Earth, OpenStreetMap, and government open data.
These maps are edited visual materials, not raw data files, and are provided for education, documents, presentations, and graphic reference.