Grant County sits in north-central Indiana with Marion as its largest mapped center, Gas City and Jonesboro close to the southeast, Upland near the eastern side, Fairmount to the south, and Sweetser and Swayzee to the west. This Grant County Indiana map page separates those relationships into four useful views: roads and places, a ranked city distribution, waterways with terrain relief, and countywide elevation. You can examine each preview in the article and download the same four maps as high-resolution JPG files in one ZIP near the end of the page.
Marion is the easiest place to use as an anchor. On the general county map, its developed area occupies the middle of Grant County slightly north of center, with routes extending west toward Sweetser and Converse, south toward Gas City and Jonesboro, and east toward the county line. Indiana Wesleyan University is marked just south of central Marion, while Grant County Emergency Medical appears farther southeast. Because roads, development, and public landmarks all cluster here, Marion gives the rest of the county a clear directional framework.
The natural framework is different. The Mississinewa River cuts through the central part of the county and is joined by a network that includes Pipe Creek, Hummel Creek, Lugar Creek, Walnut Creek, Deer Creek, Barren Creek, and named ditches. Wagner Lake and Sports Lake provide two additional water reference points. On the elevation surface, the main river corridor forms a lower green channel while warmer colors spread across much of the east and northeast. Reading the water and elevation views together reveals a county shaped by both drainage and a noticeable west-to-east change in relief.
Table of Contents
Marion organizes the road network without sitting alone in the county
Start at Marion and move around the county map clockwise. Van Buren appears near the northeastern edge, with a strong north-south road line nearby. Upland lies farther south along the eastern side. Gas City is immediately southeast of Marion, and Jonesboro sits just below it. Fairmount is farther south in the center, while Sweetser and Swayzee occupy the western half. This spread matters because Grant County is not a one-town county with every other place directly beside Marion; its settlements extend into several distinct directions.
Several route markers help with orientation. Route 18 enters from the west and reaches the Marion area, while 15 and 9 mark important north-south lines in the central and southern portions. Markers 35, 22, 26, 37, 5, and 69 also appear in different parts of the county. The map is best used to understand the broad road pattern rather than current turn-by-turn travel. Construction, closures, speed restrictions, and exact driving times can change, so those details belong in a current road or navigation service.
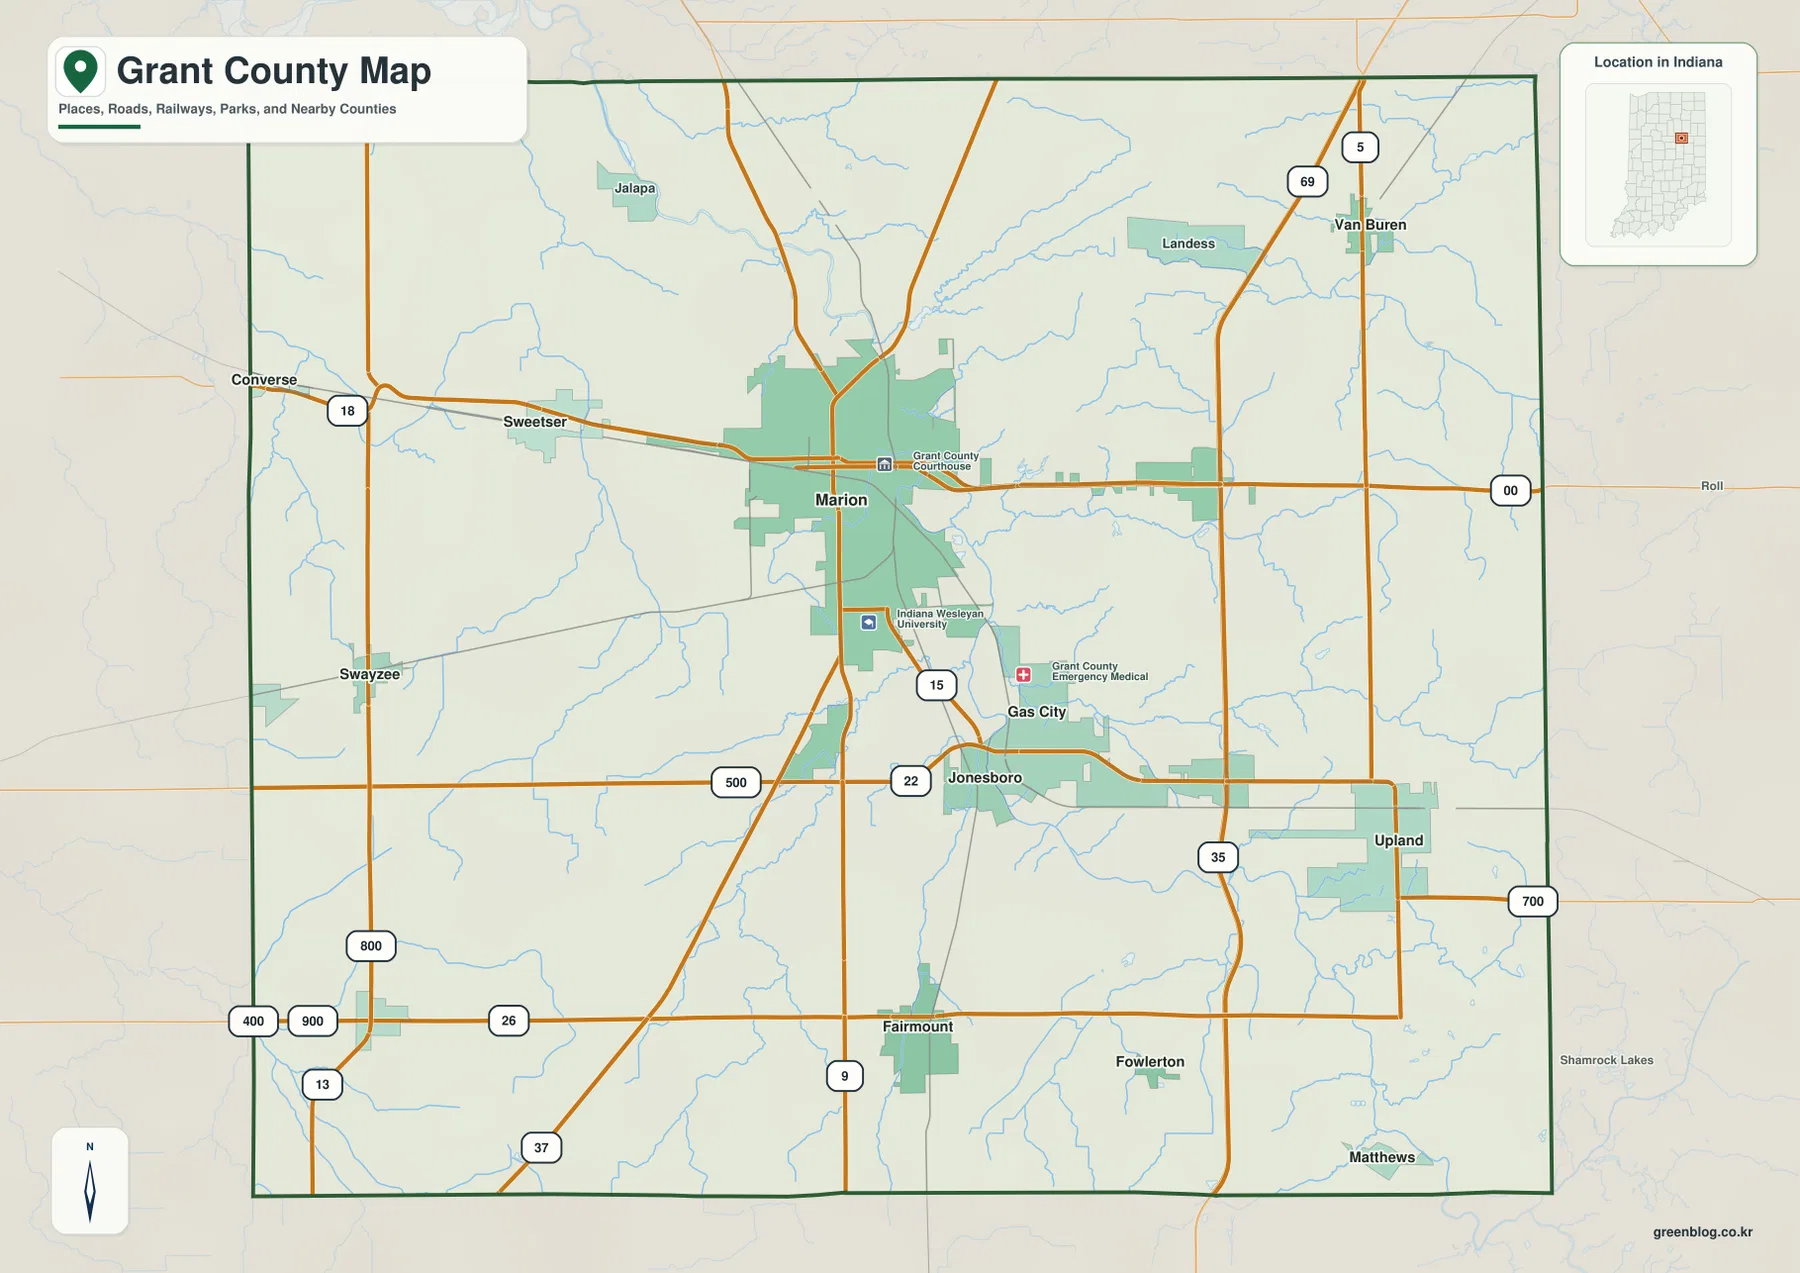
The western side looks more rural and less continuously developed than the Marion core. Sweetser and Swayzee are separated north to south, and Converse appears just outside the county to the west. On the opposite side, Upland and Van Buren are spaced apart near the eastern edge. Neighbor labels add regional context: Wabash County lies to the north, Huntington County to the northeast, Blackford and Wells Counties to the east, Howard and Miami Counties to the west, and Madison County to the southwest.
Thin blue drainage lines cross the road map in almost every direction. They are especially noticeable in the rural space north and east of Marion and around the Gas City–Jonesboro area. At this scale, the lines are useful for showing that roads and settlements occupy a landscape with frequent small streams and drains, but the general map becomes crowded if you try to identify every water feature. The terrain-and-water view later in the article removes much of the road detail so the drainage pattern becomes easier to follow.
Six mapped population centers spread in a broad arc around Marion
The city-distribution view simplifies the county to six ranked places: Marion, Gas City, Upland, Fairmount, Jonesboro, and Sweetser. Its CITY INDEX prints values of 27,531 for Marion, 6,076 for Gas City, 3,918 for Upland, 2,662 for Fairmount, 1,578 for Jonesboro, and 1,061 for Sweetser. Those numbers are treated here as the values printed on the supplied map, not as a claim that they are the latest population estimates. For current demographic figures, a current Census product should be used.
The spatial pattern is more useful than the ranking alone. Marion remains near the middle of the group, while Gas City and Jonesboro form a close pair to the southeast. Upland is farther east and closer to the county boundary. Fairmount drops south of the main central cluster, and Sweetser sits well to the west. The result is a wide distribution of settlement points rather than a single straight urban corridor.
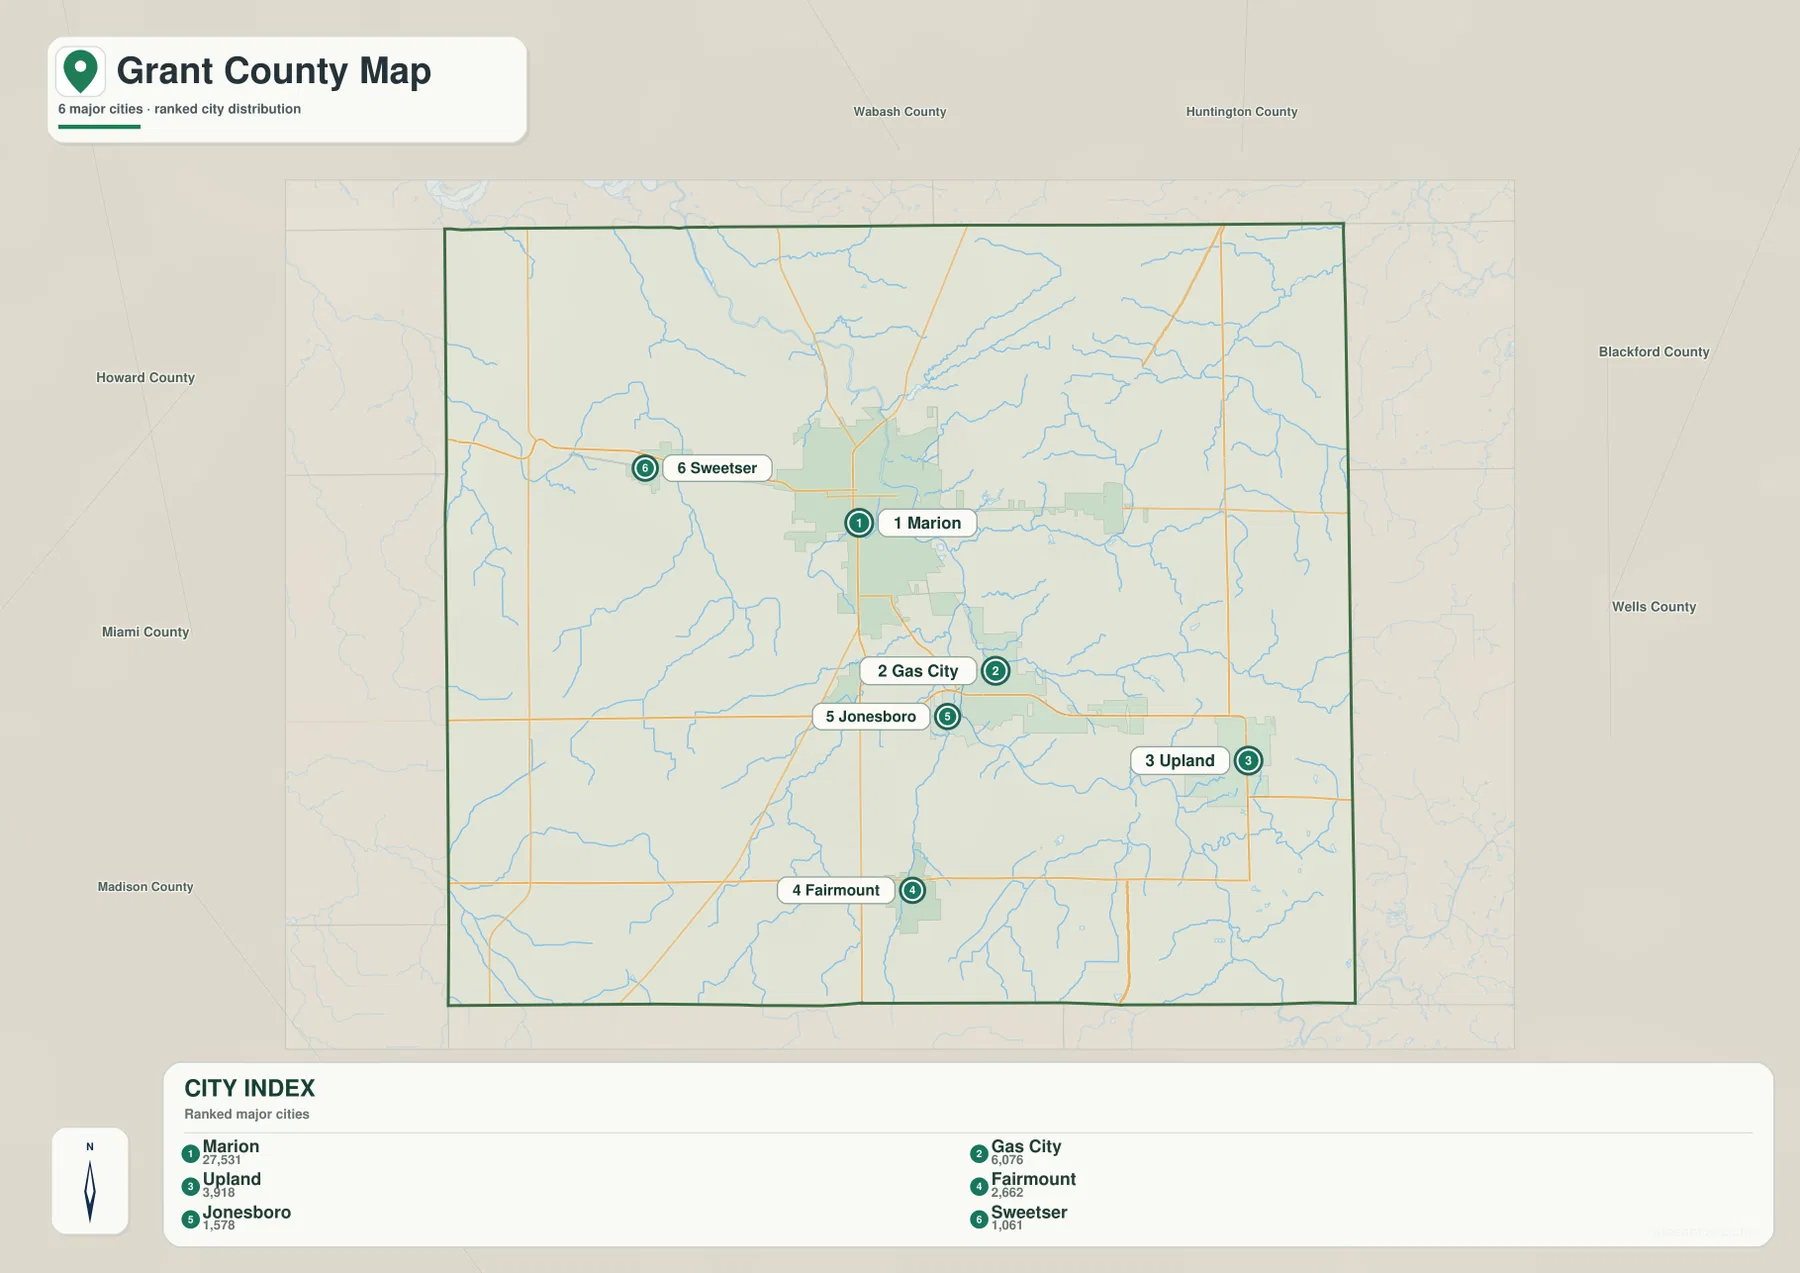
Gas City and Jonesboro are close enough on the map to read as one southeastern cluster, but they remain separate places. Jonesboro is slightly farther south. Upland breaks away to the east, while Fairmount occupies a more independent southern position. Once those directions are fixed in mind, returning to the general map becomes much easier because the road lines no longer look like an undifferentiated grid; they connect recognizable settlement groups.
The surrounding-county labels also clarify which mapped towns are closest to Grant County’s edges. Upland is visually near the eastern side facing Blackford and Wells Counties, while Sweetser is on the western side facing Howard and Miami Counties. Marion is more insulated from the boundary. That difference can matter when using the map for regional orientation, because a short distance across a county line may be more relevant to some communities than a trip to the opposite side of Grant County.
The Mississinewa River is the central water spine, but the drainage network is much wider
The terrain-and-water map gives the Mississinewa River the strongest visual weight. It bends through the central part of Grant County and receives smaller channels from both sides. When the locations of Marion and Gas City are carried over from the road map, the river’s importance to the central county becomes clearer. It is not simply a line crossing empty land; it occupies the same broad zone where several of the county’s largest mapped communities are concentrated.
Pipe Creek stands out in the western and northwestern portion, while Hummel Creek is labeled in the north. Black Creek and Monroe Ditch appear toward the northeast and east. Lugar Creek and Walnut Creek are visible east of the central river corridor, with Deer Creek and another Black Creek label farther south. Barren Creek lies in the southeast, and Grassy Fork reaches into the southwest. Together they show that Grant County’s drainage is distributed across the county rather than confined to one main valley.
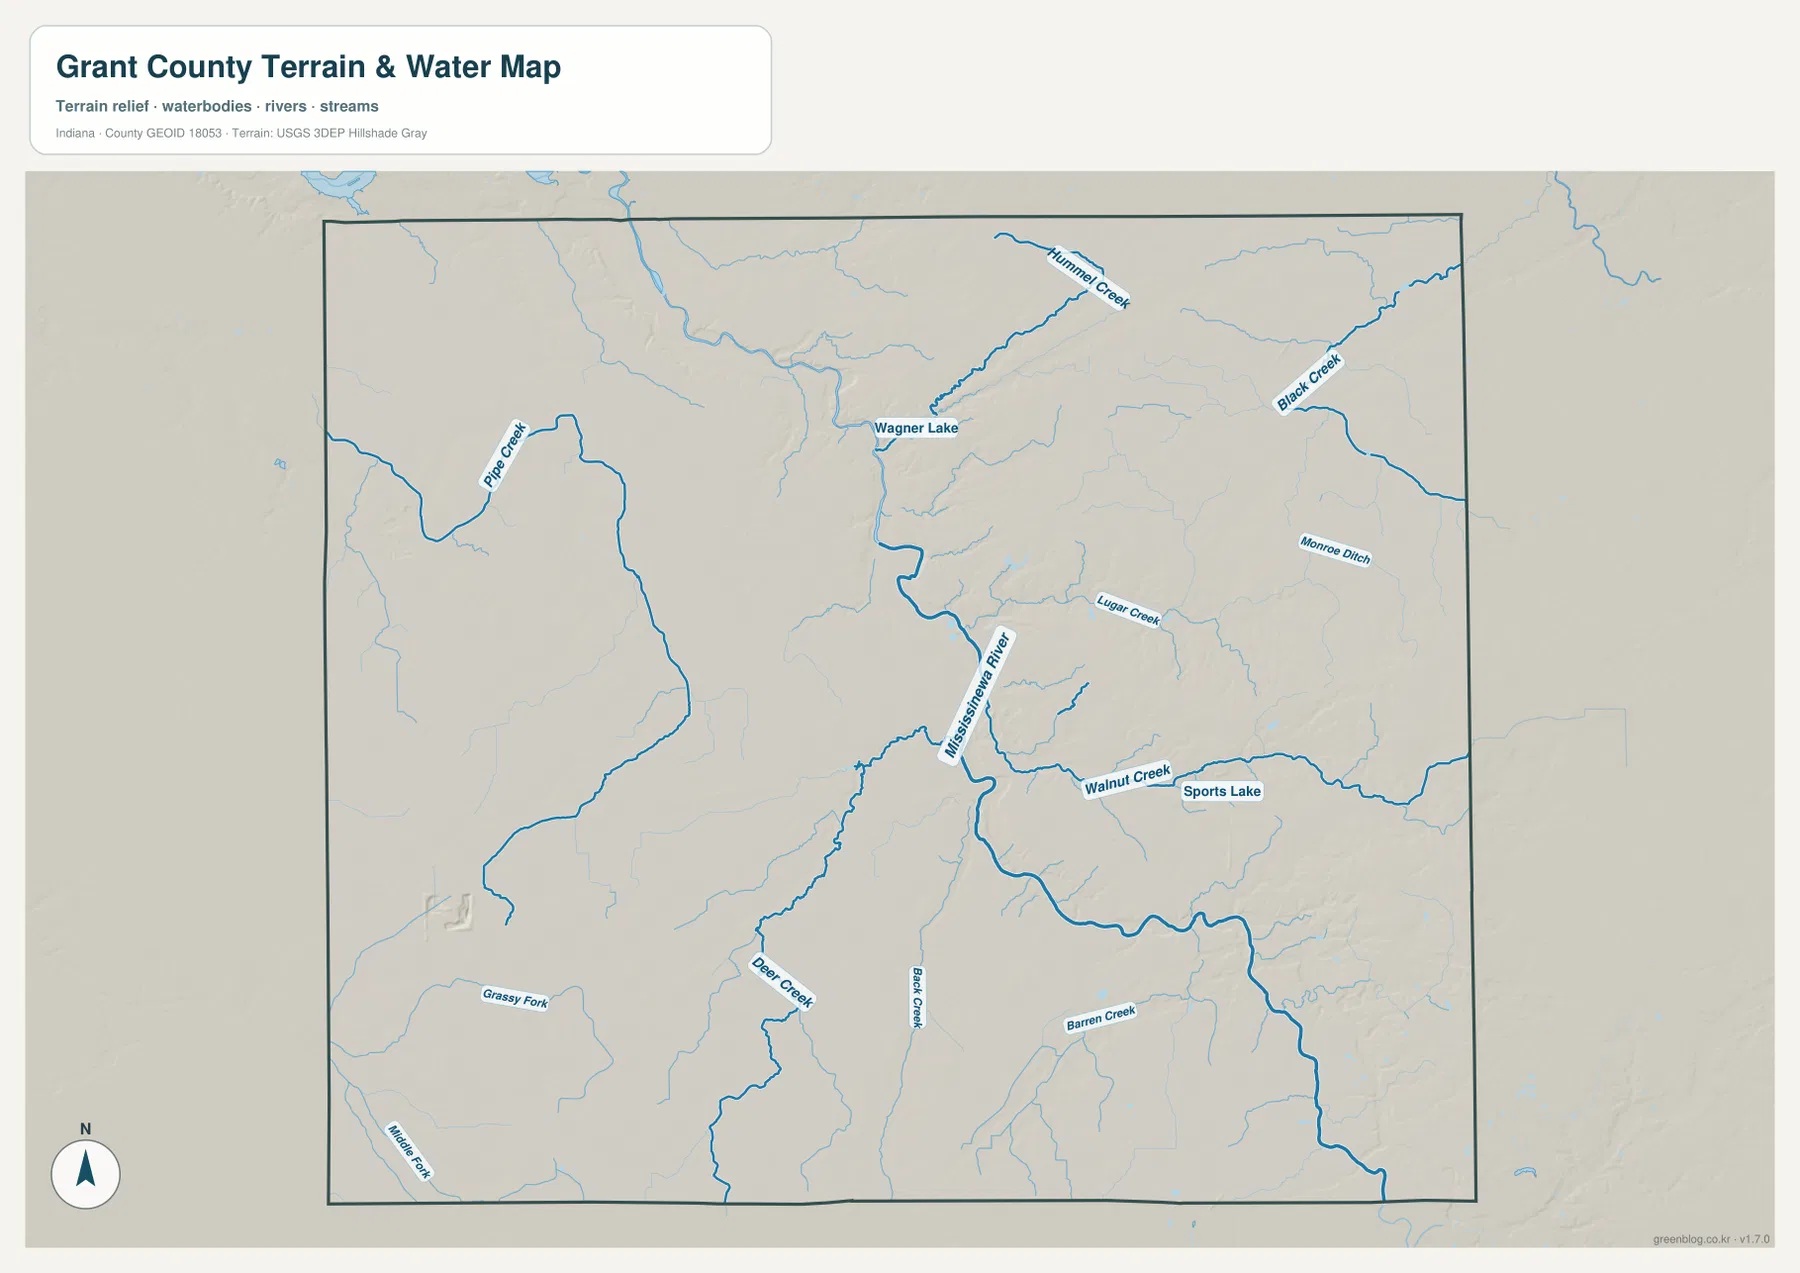
Two named lakes help break the drainage system into recognizable areas. Wagner Lake is marked north of the county’s center, close to a network of smaller channels. Sports Lake appears farther east near Walnut Creek. These features make useful reference points when the many thin blue lines begin to look similar. They also show that the eastern half is not simply upland terrain; small water bodies and narrow drainage corridors cut through it.
This is a water-reference map, not a flood-hazard or legal-water-boundary product. The blue lines indicate the mapped position of rivers, creeks, ditches, and water bodies at county scale. They do not establish flood insurance zones, navigation status, water quality, property boundaries, or regulatory setbacks. Those questions require current material from agencies such as USGS, FEMA, Indiana state agencies, or the local jurisdiction responsible for the specific decision.
A 195–289 meter range separates the central river trench from higher eastern terrain
The elevation map reports an actual countywide range of 195 to 289 meters and a mean elevation of 262 meters. Green tones indicate lower ground, while yellow, orange, and brown tones mark progressively higher areas. The most striking low feature is the branching green corridor through the center of Grant County. Its shape closely matches the major river and tributary valleys seen on the water map, especially the Mississinewa River corridor.
Warmer colors become more common across the east and northeast. Near the eastern boundary, larger blocks of orange and brown are interrupted by narrow green drainage cuts. The southeast also contains repeated higher patches. This creates a stronger relief pattern than the western side, where the colors generally change more gradually. Upland’s location near the eastern side can therefore be understood not only as a boundary position but also as part of a higher terrain zone.
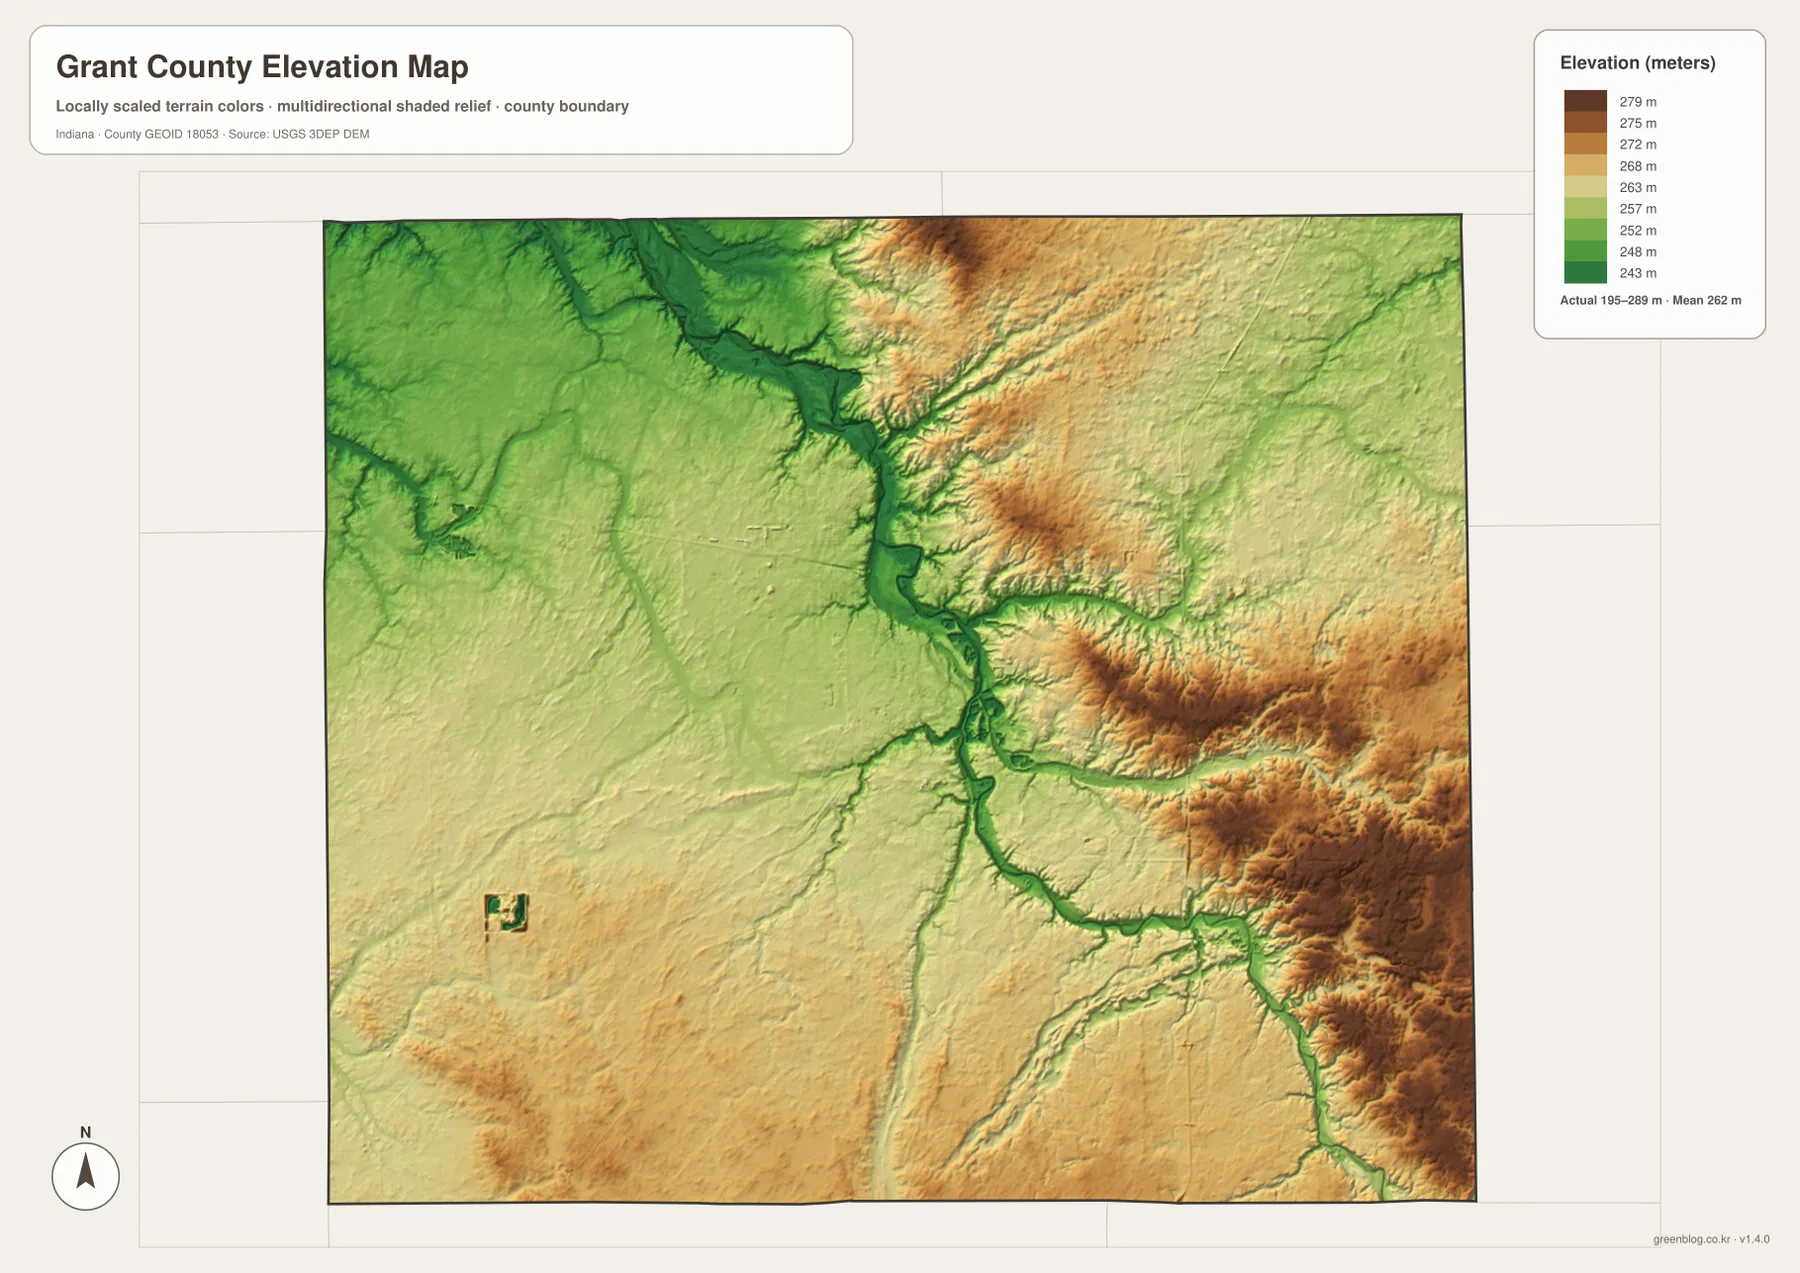
The west is not perfectly flat. Small valleys and subtle ridges remain visible around Pipe Creek and toward the southwest near Grassy Fork. Still, those features are less dominant than the warm-colored high ground on the east. If you imagine moving from Sweetser or Swayzee toward Upland, the elevation map suggests a broad transition from gentler western terrain across the central river lowland and into more broken higher ground in the east.
Colors on this generalized elevation surface should be used for relative comparison, not survey measurement. Even though the map prints an actual minimum and maximum, a single colored pixel should not be treated as an exact site elevation. Building design, drainage engineering, road grading, and other precise work require source elevation data such as USGS 3DEP products or professional survey measurements.
Following one place across all four views connects roads, water, and relief
Marion provides the clearest example. On the general map, it is the largest developed area and a road hub. The city-distribution map ranks it first and strips away enough detail to show how the other major places surround it. On the water map, the central Mississinewa River system passes through the same broad part of the county. The elevation map then explains the low green corridor beneath that water network. Four separate views become one geographic story when they are compared at the same location.
Gas City and Jonesboro tell a slightly different story. Their positions are close together south and southeast of Marion, and the general map shows roads descending from the Marion area into the pair. Nearby water features include the central river and the Lugar Creek–Walnut Creek network farther east. On the elevation surface, this area sits near the transition between the low central corridor and the rising eastern terrain, which helps explain why tributaries converge toward the lower ground.
Upland makes the east-west contrast easier to see. It is near the eastern county edge on the road and city views, close to the area containing Sports Lake and Walnut Creek on the water map. On the elevation map, warmer high-ground colors occur more frequently around this side of the county. Compared with Marion’s river lowland, the Upland side has a more broken appearance with small valleys incised into higher ground.
Fairmount and Sweetser are useful for checking that the county cannot be summarized by one simple pattern. Fairmount sits well to the south, where several small drainage lines cross moderately varied terrain. Sweetser lies west of Marion, closer to the gentler western surface and the Pipe Creek side of the drainage network. Following these places from one map to the next gives more context than reading a list of four map types in isolation.
Choose the first map by the question you are trying to answer
For basic orientation, begin with the general county map. It contains the most place names, the major route network, developed areas, the county boundary, and neighboring communities. It is the best first choice when the question is where Marion, Gas City, Upland, Fairmount, Sweetser, or Van Buren sits in relation to the rest of Grant County. It is less appropriate for current driving instructions or legal boundary determination.
If the goal is simply to compare the six principal mapped communities, the city-distribution view is cleaner. The water map is the better first choice for the Mississinewa River, Pipe Creek, tributaries, ditches, and named lakes. The elevation view is most direct when the question concerns the low central river corridor or the higher eastern and northeastern ground. Each map removes some information so another type of relationship becomes easier to see.
For classroom work, printed reference sheets, reports, or presentations, the high-resolution JPG files are more practical than the reduced web previews. Small creek labels, route numbers, and subtle elevation colors remain easier to inspect when the image is enlarged. The ZIP below contains the four supplied Grant County maps as separate JPG files, so you can use only the view that fits the task rather than forcing every detail into one image.
The downloadable images are still county-scale reference maps. They should not be used as proof of parcel ownership, zoning, flood regulation, exact engineering grades, or survey elevations. When a legal, regulatory, or engineering decision depends on the map, confirm it with current material from Grant County, the State of Indiana, USGS, FEMA, or the agency responsible for that subject.
Frequently Asked Questions
Where is Marion in relation to the other major places shown in Grant County?
Marion lies slightly north of the county’s center and is ranked first on the supplied city-distribution map. Gas City and Jonesboro are to the southeast, Upland is east, Fairmount is south, and Sweetser is west. Because several major road lines converge around Marion, it is the most convenient reference point for locating the other mapped communities.
Which maps best show the relationship between the Mississinewa River and the higher eastern ground?
Use the terrain-and-water map together with the elevation map. The water view identifies the Mississinewa River and tributaries such as Pipe Creek, Hummel Creek, Lugar Creek, and Walnut Creek. The elevation view shows the central river corridor as lower green terrain while higher yellow-to-brown areas spread across much of the east and northeast.
Can the 195–289 m elevation range be used as the exact elevation of a property?
No. The supplied elevation map states a countywide actual range of 195–289 meters and a mean of 262 meters, but the colored surface is generalized for regional comparison. It does not provide survey-grade elevation for an individual lot or structure. Use USGS 3DEP source data or a professional survey when exact elevation is required.
Map File Information
The ZIP contains high-resolution JPG copies of the Grant County general map, city distribution map, terrain-and-water map, and elevation map. Use the originals when you need a larger image for print, documents, or teaching material.
- Included Files: Use only the versions confirmed in the article and supplied images
- File Type: Use the confirmed download contents
- Intended Use: Printing, education, presentations, and map-based projects
Related Maps
Sources and references
The article is based primarily on place names, roads, waterways, and elevation information visible in the supplied Grant County maps. The following official and trusted sources are useful for administrative context and for checking the underlying types of geographic data.
- Indiana State Government – Grant County
- Grant County Indiana Historical Society
- U.S. Census Bureau – TIGER/Line Shapefiles
- USGS – National Hydrography
- USGS – 3D Elevation Program
Green Map creates custom-edited map images using open geographic data sources such as geoBoundaries, Natural Earth, OpenStreetMap, and government open data.
These maps are edited visual materials, not raw data files, and are provided for education, documents, presentations, and graphic reference.