Elkhart County sits along the northern edge of Indiana, immediately south of Michigan, with two strong geographic reference points: the city of Elkhart in the northwest and Goshen near the center of the county. This Elkhart County Map page brings together a general county map, a ranked city map, a terrain-and-water map, and an elevation map so you can compare settlements, roads, rivers, and relief without switching between unrelated sources. High-resolution JPG copies of all four maps are available in the download package near the end of the page.
The county is easier to understand when Elkhart and Goshen are treated as separate anchors rather than as one continuous urban area. Elkhart spreads across the northwest, close to the St. Joseph River, while Goshen sits farther south and east where several roads converge. Elkhart County’s official history says the county was established in 1830. Dunlap served as the original county seat, but the seat later moved to Goshen after county boundaries were reorganized. The base map marks the Elkhart County Courthouse in Goshen, which makes that administrative role visible on the map itself.
Water and elevation add another layer. The St. Joseph River crosses the northern part of the county, the Elkhart River approaches from the southeast and runs through the Goshen area, and smaller streams branch through the central and southern landscape. The elevation image lists an actual data range of 218 to 317 meters and a mean of 253 meters. Lower green areas often follow the major river corridors, while higher ground is more prominent toward the east and in parts of the southwest.
Table of Contents
Two city centers organize the county map
On the general map, Elkhart is the largest built-up area and occupies a broad section of the northwest. Goshen appears near the middle of the county, slightly to the south, with the courthouse and Goshen College marked nearby. Dunlap lies between the two main cities on the western side of the central corridor. Bristol sits north of center, Middlebury is close to the eastern edge, Wakarusa is in the southwest, and Nappanee reaches the southern boundary.
The road network provides a quick way to keep those places oriented. Routes marked 80 and 90 run east-west across the northern part of the county. Route 20 crosses the west, while 15 runs north-south through Goshen. The map also shows 19 on the western side, 13 on the east, 120 and 4 in the eastern half, and 6 and 33 near the southern edge. These numbered routes are useful visual guides even when the purpose is simply to understand where towns sit relative to one another.
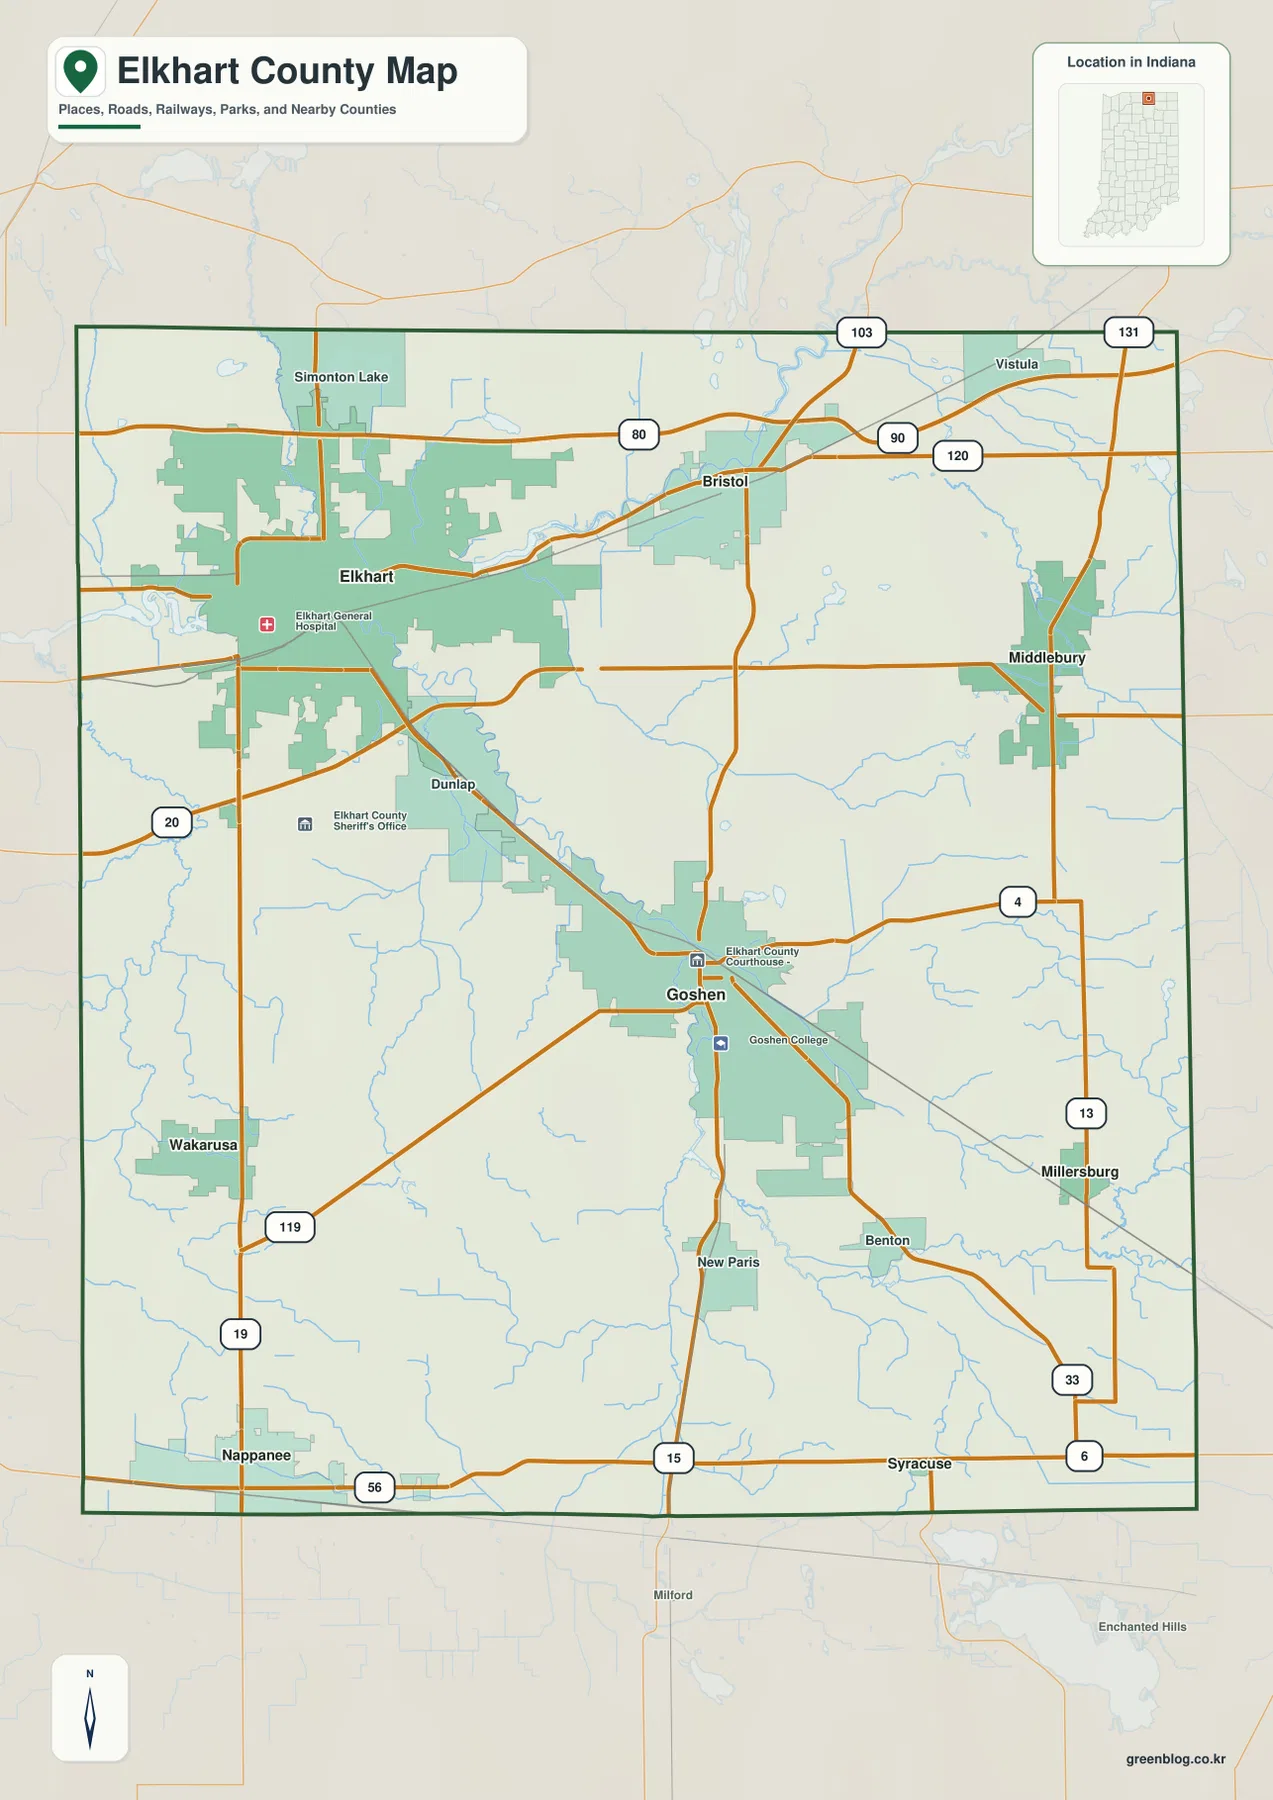
A small Indiana locator in the upper-right corner places the county near the top of the state. That matters because the northern county line is also the Indiana-Michigan state boundary. From this position, Elkhart is the northwestern urban reference point, Bristol and Middlebury help define the east and northeast, and the southern communities sit much closer to the interior of Indiana.
This base map is the best starting point when you need several kinds of information at once. It combines the county outline, incorporated areas, road numbers, rail lines, water features, and selected landmarks. The more specialized maps below intentionally remove some of that detail so the city pattern, waterways, or elevation can stand out more clearly.
Six mapped communities show a distributed settlement pattern
The city map highlights six communities and ranks them in the graphic: Elkhart, Goshen, Nappanee, Middlebury, Wakarusa, and Bristol. The first two are clearly the dominant population centers in the map, but the remaining places are spread around the county instead of clustering beside one another. Nappanee is near the southern boundary, Wakarusa is farther north in the southwest, Middlebury is on the eastern side, and Bristol is north of center.
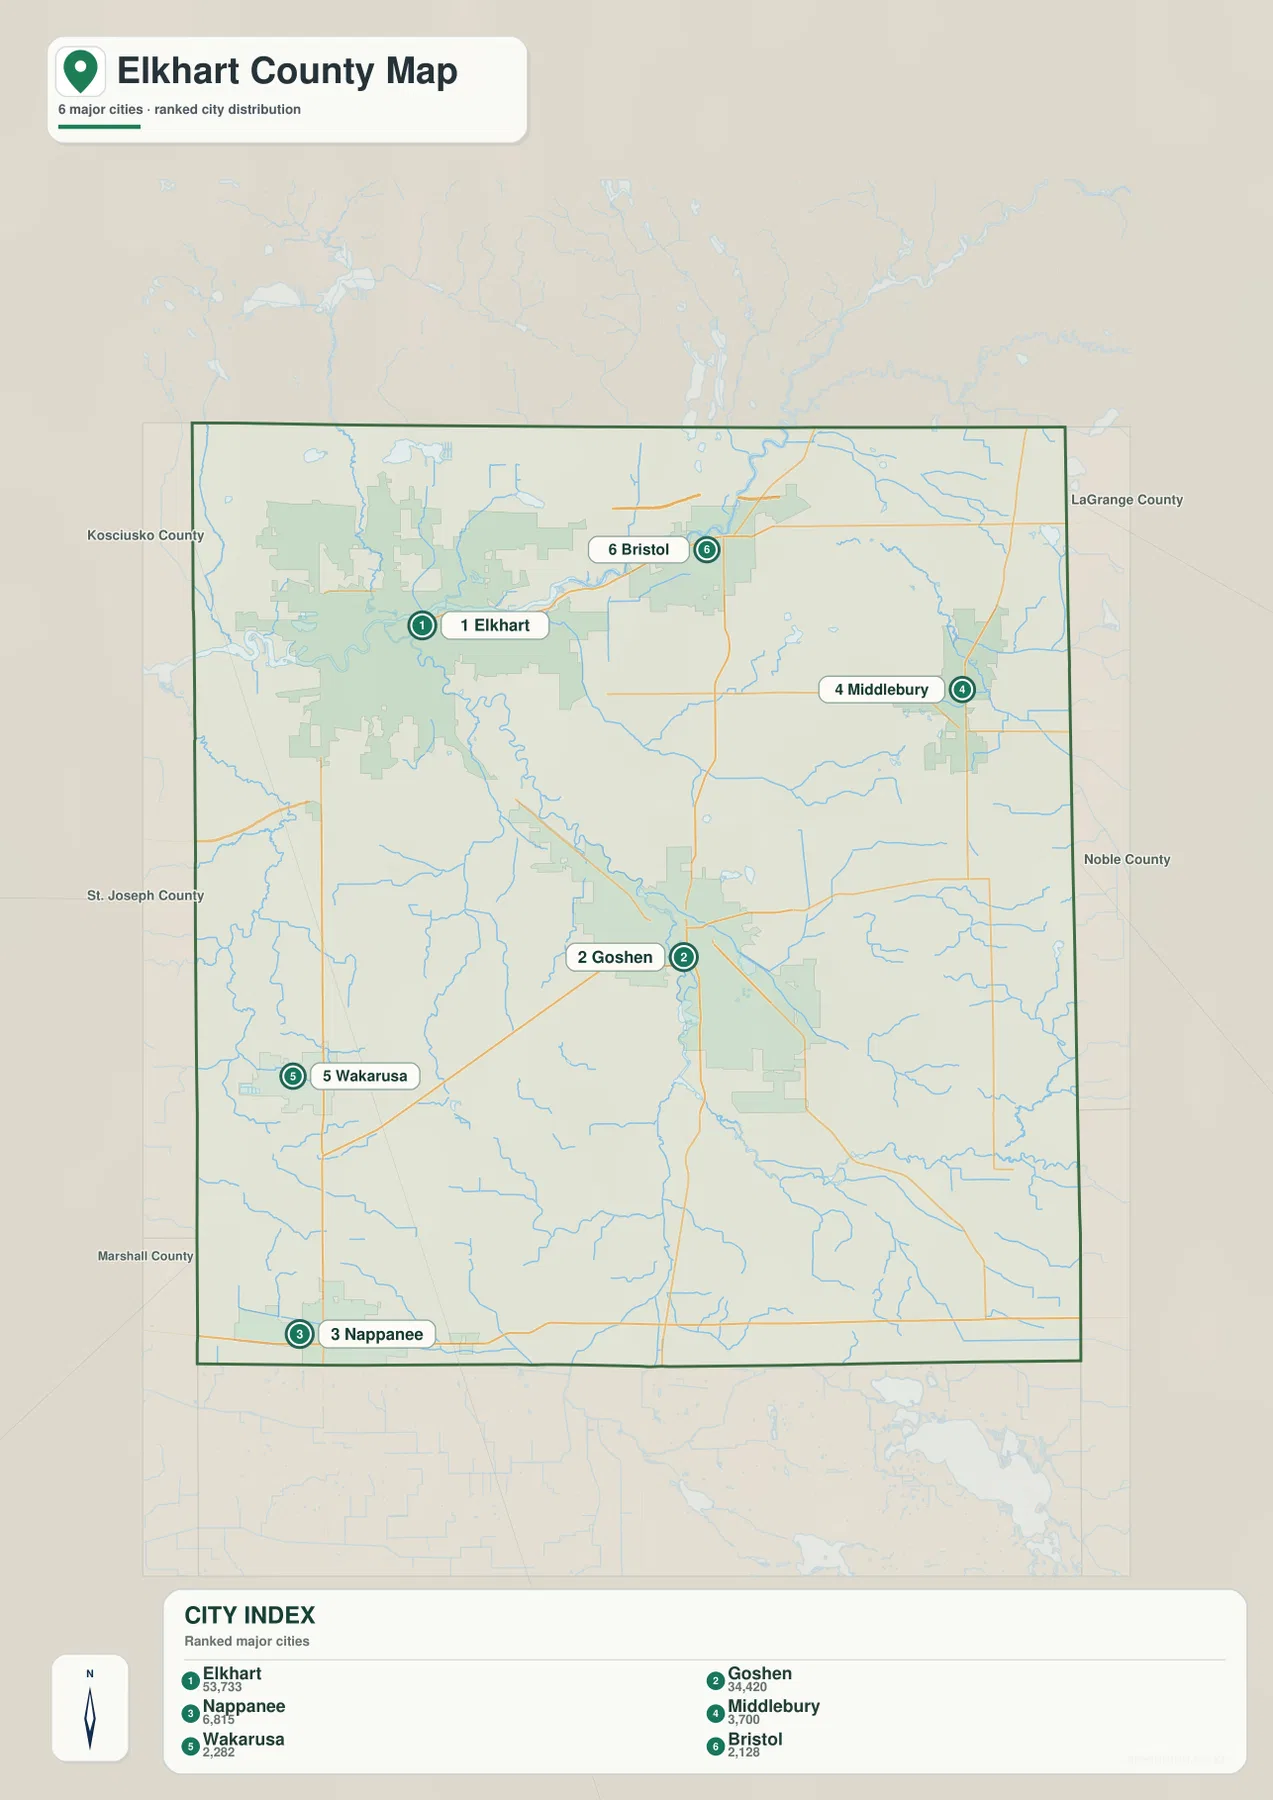
The pattern is useful for more than population ranking. It shows why Goshen works well as a central orientation point: the city is roughly between the large Elkhart area to the northwest, Middlebury to the east, and the southern communities. Elkhart, by contrast, is much closer to the northern and western edges. A reader planning a county-wide route can quickly see that visiting Nappanee, Middlebury, and Bristol involves moving through very different parts of the county.
Labels outside the county also provide regional context. Neighboring Indiana counties are shown around the edges, including St. Joseph, Marshall, Kosciusko, LaGrange, and Noble counties. These labels make the county map more useful when comparing a town near the boundary with places just outside Elkhart County. The map is not a turn-by-turn navigation product, however, so actual driving distance and travel time should be checked with current road information.
The city graphic is best read as a distribution map. It emphasizes where the six labeled communities sit and how large their mapped population ranks are relative to one another. It does not replace municipal boundary data, parcel maps, or a street-level map. For a classroom, report, or quick regional overview, that simplification is an advantage because the main settlement pattern remains easy to see.
The St. Joseph and Elkhart rivers define much of the low ground
The terrain-and-water map shifts attention away from roads and toward rivers, creeks, lakes, and subtle landform shading. The St. Joseph River crosses the northern part of the county in a broad, winding course. The Elkhart River runs through the central and southeastern portion of the county and is a particularly useful reference for the Goshen area. Together, those two rivers explain much of the connected low terrain visible later on the elevation map.
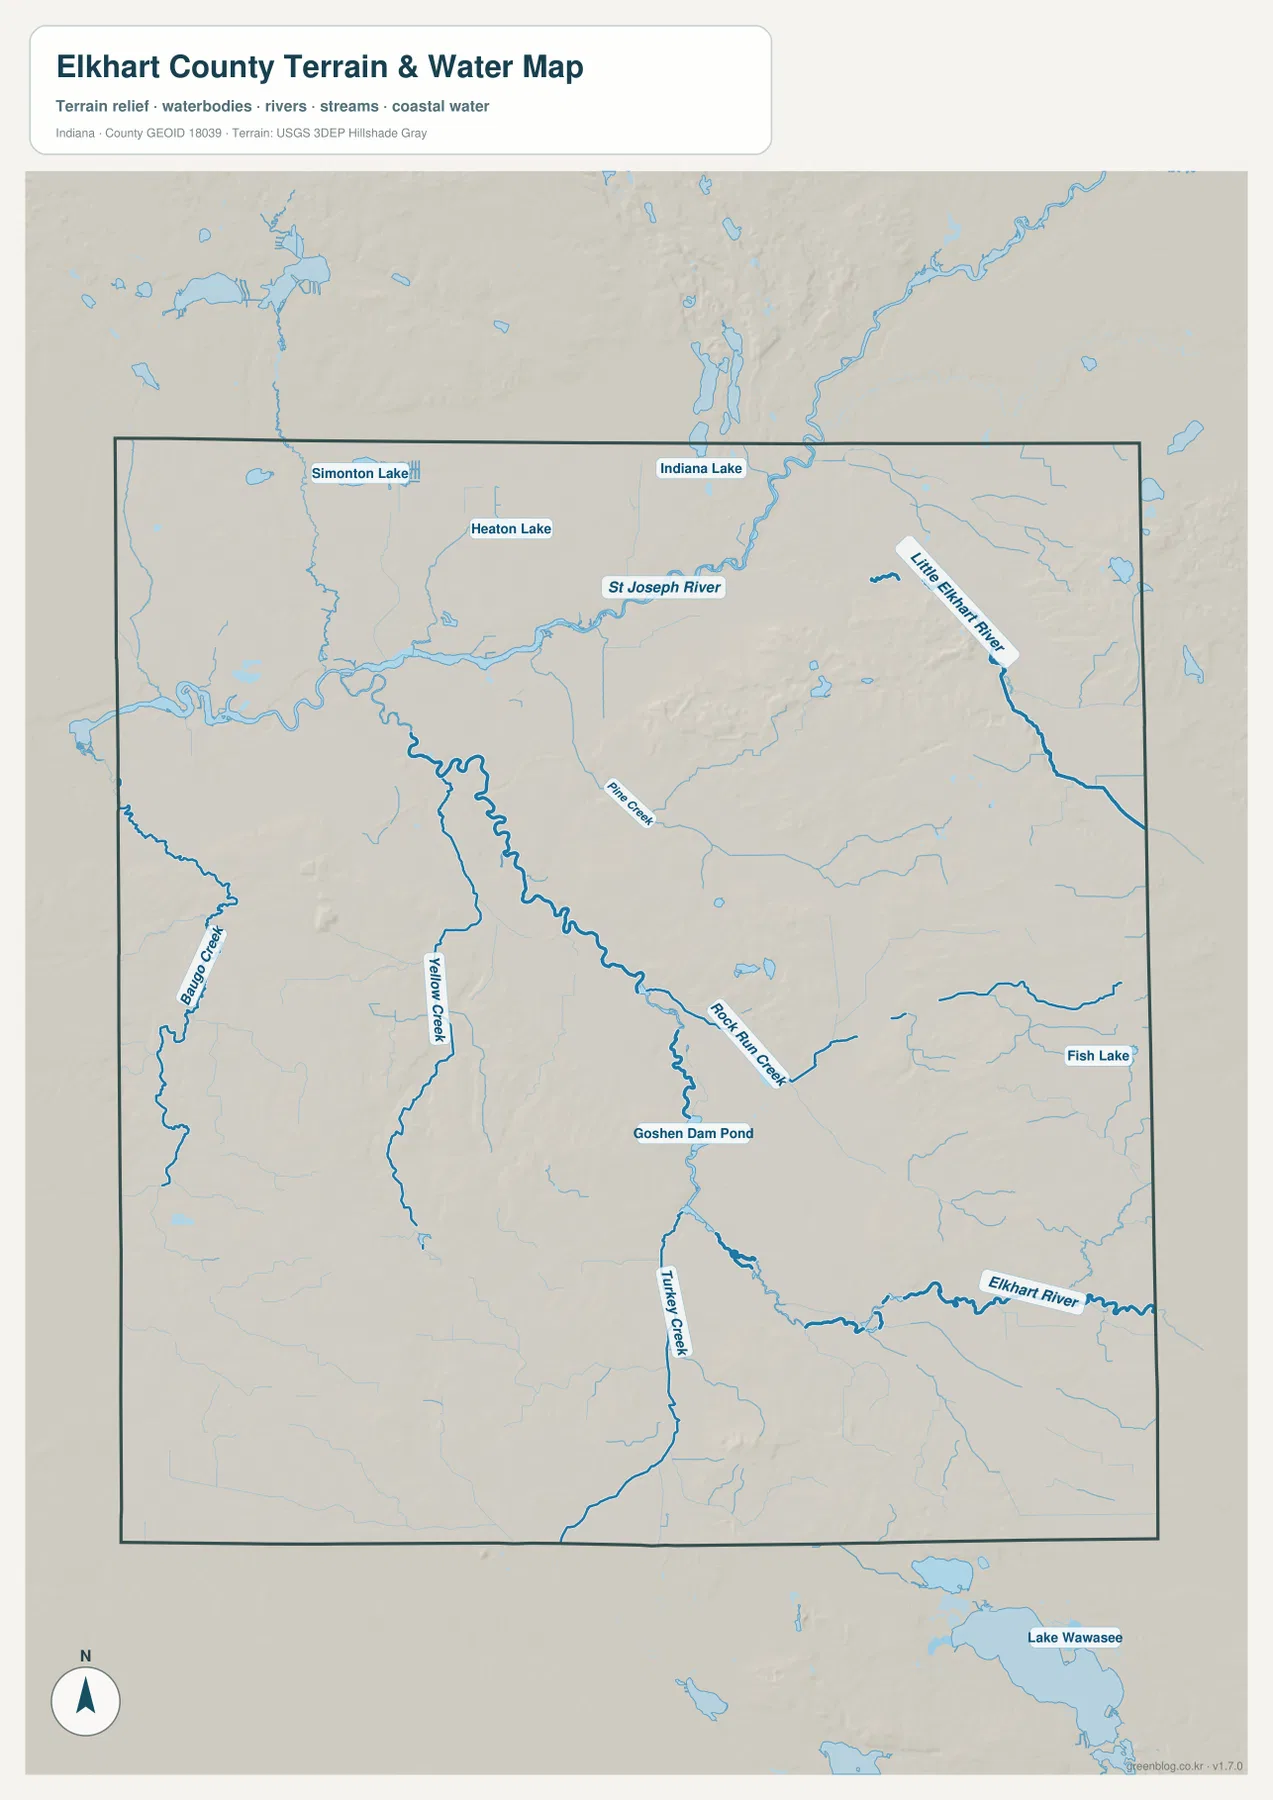
Several smaller water features are named as well. Little Elkhart River appears in the northeast. Baugo Creek runs along the western side, while Yellow Creek, Turkey Creek, Pine Creek, and Rock Run Creek help fill out the central and southern drainage network. Simonton Lake, Heaton Lake, Indiana Lake, Fish Lake, and Goshen Dam Pond provide additional fixed points. Because the map names these features directly, it can be used to match a town or road corridor with the nearest major waterway.
The map should not be interpreted as a flood-hazard map. A blue river line identifies water, but it does not show the probability of flooding, a regulatory floodplain, a wetland jurisdiction, or a legal riparian boundary. Those questions require separate official datasets. Here, the water layer is most useful for geographic orientation and for understanding why certain low corridors appear on the elevation image.
County park information adds local context to the eastern waterways. Elkhart County Parks describes Bonneyville Mill County Park near Bristol as 222 acres of gently rolling hills, woodlands, marshes, and open meadows, with the Little Elkhart River running through the park. The park system also describes River Preserve as a linear park along the Elkhart River. These examples connect the mapped river network to real landscapes without turning the county map into a recreation guide.
Elevation ranges from 218 to 317 meters on the supplied surface
The elevation map uses locally scaled colors rather than a single statewide palette. Its legend states an actual range of 218–317 meters and a mean elevation of 253 meters. Green represents lower ground, moving through lighter tones to tan and brown for higher areas. This makes broad landform differences visible even where total relief is moderate compared with mountainous parts of the United States.
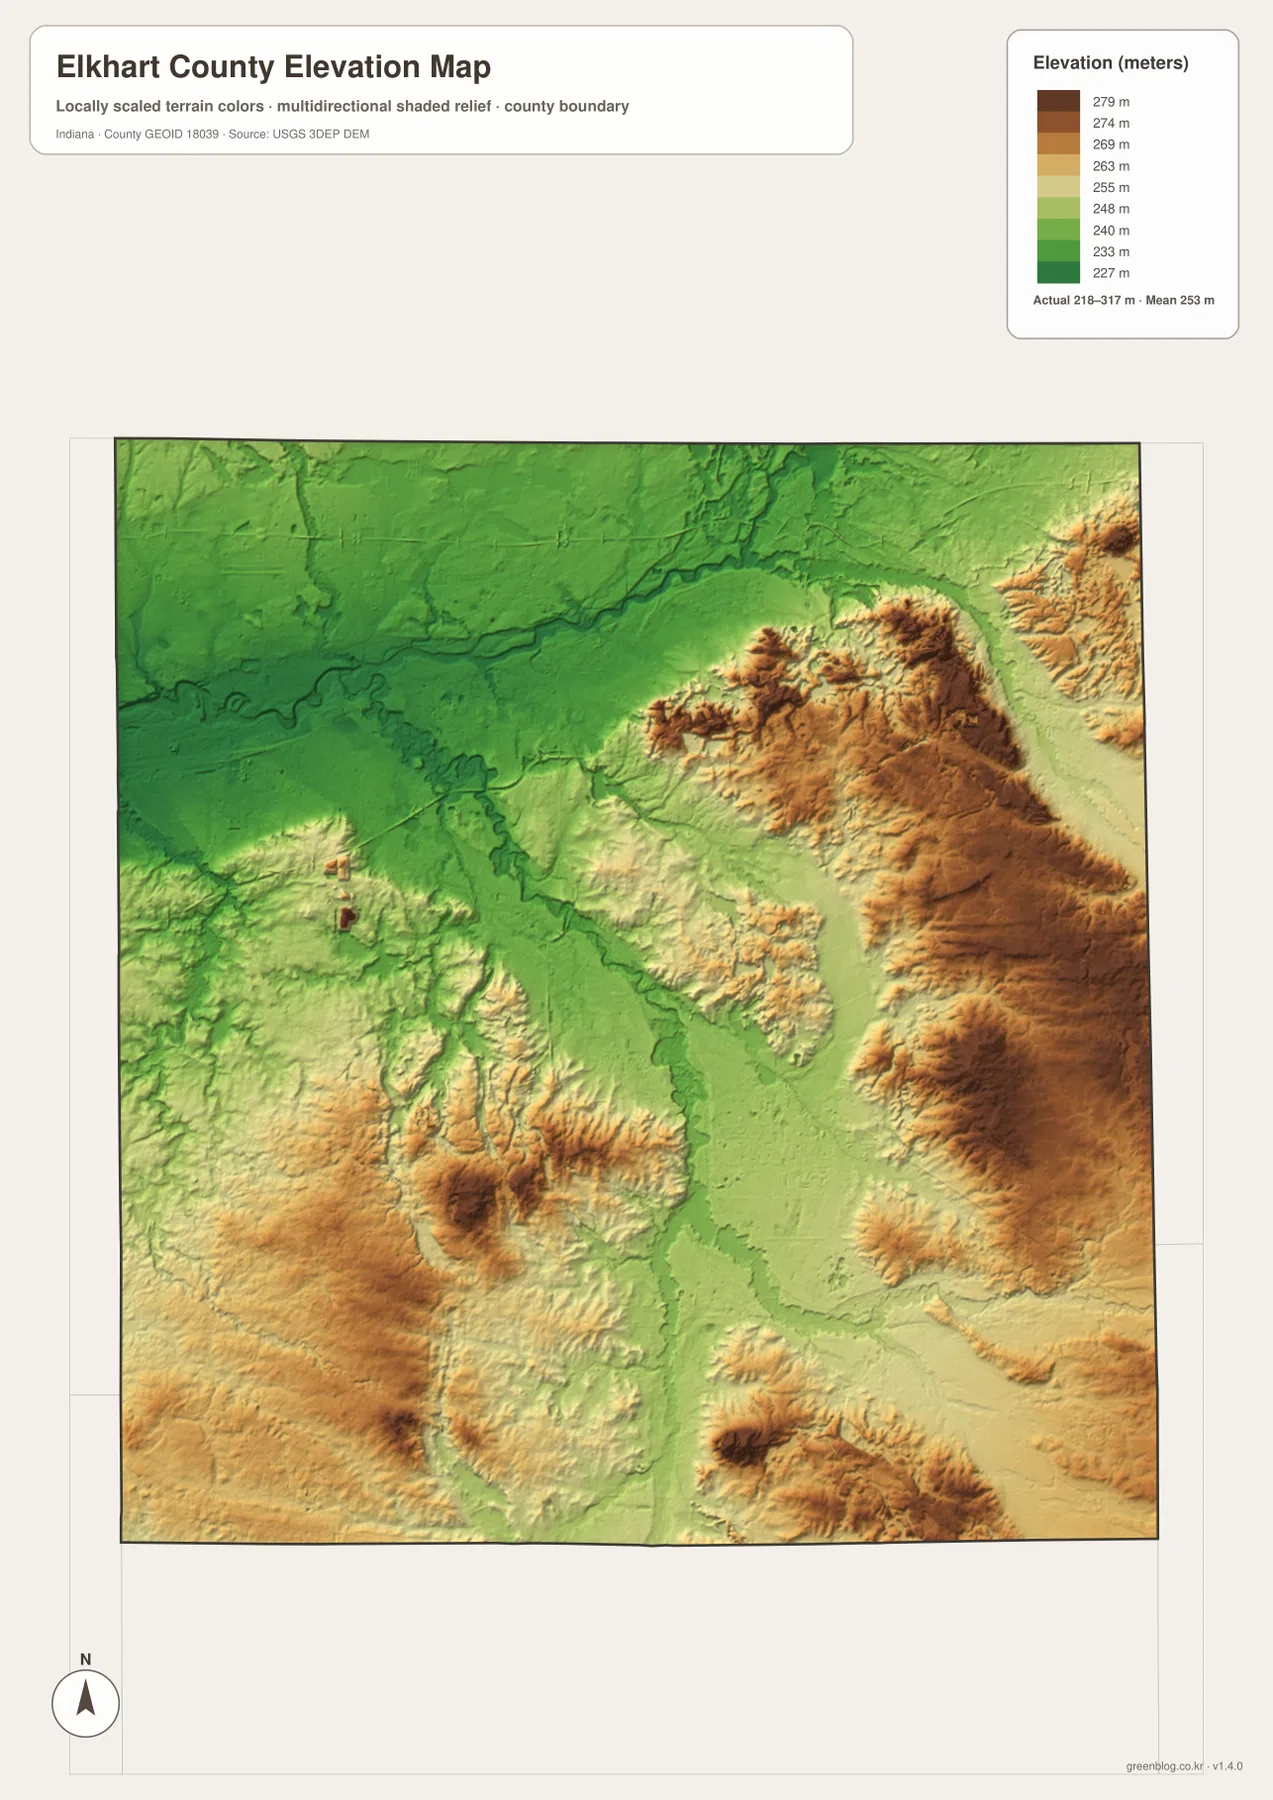
A low green corridor follows much of the St. Joseph River across the north. Another lower corridor extends through the middle of the county in the Goshen and Elkhart River area. Higher colors become much stronger in the eastern part of the county, where ridged and rolling terrain stands above the river lowlands. The southwest also contains elevated patches, while smaller depressions and stream valleys cut through the broader surface.
The shaded relief is especially helpful when paired with the water map. A stream that looks like a narrow blue line on the hydrology map often occupies a broader green trough on the elevation image. In the east, for example, the Little Elkhart River and nearby drainage channels pass through terrain that rises around them. In the central county, lower ground follows the larger river system more continuously.
This is a county-scale reference map, not a survey document. The 218–317 meter values describe the displayed elevation dataset over the county, but they should not be used to determine a construction benchmark, floor elevation, road grade, or exact parcel height. Engineering, surveying, drainage design, and legal work require more precise source data and site-specific verification.
The brown areas should also be understood as higher relative to the rest of Elkhart County, not as high mountains. Official park descriptions in the Bristol area use terms such as gently rolling hills, which matches the broad relief shown here. The locally scaled palette is designed to reveal small county-level differences that might disappear if the same colors were stretched across all of Indiana.
Road corridors help connect the river valleys and towns
The road layer reveals a different pattern from the rivers. The 80/90 corridor runs almost straight across the north and passes close to Elkhart and Bristol. Route 20 provides another east-west reference through the western part of the county. Goshen sits where several roads converge, with 15 continuing north-south. Farther east, 13 provides a strong vertical reference near Middlebury and Millersburg, while 6 and 33 mark the southern part of the map.
Those routes are useful when moving between the specialized maps. Start with the base map to locate Elkhart or Goshen along the road network, then switch to the water map to see which river or creek occupies the same area. Finally, compare the elevation map to see whether the corridor lies in lower or higher ground. That three-step comparison is often more informative than trying to read every layer from a single crowded map.
Rail lines are also visible on the base map, particularly through the more developed northern and central areas. Elkhart County’s official website notes that rail expansion became important in the county in the nineteenth century, with lines serving Goshen, Nappanee, and Elkhart. The present map is not a rail operations map, but the rail traces help explain why several of the county’s communities line up along long-established transportation corridors.
Choosing the most useful map for a specific question
For a general location question, begin with the county map. It is the only image in this set that combines the county boundary, named communities, major road numbers, selected institutions, railways, parks, and water features in one view. If you are trying to explain where Elkhart is relative to Goshen or where Middlebury sits near the eastern edge, this is the fastest reference.
Use the city map when the settlement pattern matters more than individual roads. The six ranked places stand out immediately, which makes the image useful for classroom slides, county profiles, and simple regional comparisons. Use the terrain-and-water map when the question is about the St. Joseph River, Elkhart River, Little Elkhart River, tributaries, or small lakes. The elevation map is the better choice when the contrast between low river corridors and higher eastern or southwestern ground is the main point.
The maps can also be paired. A report about Goshen could use the city map to establish its central position, the water map to show the Elkhart River, and the elevation map to place the city in a broader low corridor. A short explanation of Bristol could combine the base map with the water map and the Bonneyville Mill reference. The goal is not to show every map every time, but to choose the image that makes the geographic point clearest.
For printed work, use the JPG files in the ZIP rather than enlarging the WebP previews from the webpage. The WebP versions are sized for quick online viewing, while the JPG originals are 2572 by 3638 pixels according to the supplied asset manifest. Before printing at a large size, check the page preview so the title, legend, north arrow, and county boundary remain inside the printable area.
High-resolution files and appropriate use
The downloadable archive contains four separate JPG files: the general county map, the ranked city map, the terrain-and-water map, and the elevation map. Keeping them as separate images makes it easy to use only the map relevant to a lesson, presentation, report, or personal reference. The archive is also convenient if you want to view the maps offline without repeatedly loading the webpage.
For precise GIS or regulatory work, return to the source agencies. U.S. Census Bureau TIGER/Line products are an appropriate place to verify county and transportation geography; USGS National Hydrography provides authoritative hydrographic data; and the USGS 3D Elevation Program is the main federal reference for elevation data. The maps on this page are designed for clear geographic explanation and download, not for legal boundary determinations, flood certification, navigation, or engineering design.
Frequently Asked Questions
Where is the county seat of Elkhart County?
Goshen is the county seat. Elkhart County’s official history says the county was established in 1830 with an original seat at Dunlap, then the seat moved to Goshen after the county boundaries were reorganized. On the general map, the Elkhart County Courthouse is marked in Goshen near the center of the county.
Which map is best for finding the St. Joseph and Elkhart rivers?
Use the terrain-and-water map. It labels the St. Joseph River and Elkhart River and also shows Little Elkhart River, Baugo Creek, Yellow Creek, Turkey Creek, Rock Run Creek, and several lakes. If you also want to see how those waterways relate to lower ground, compare that map with the elevation image.
Does the 218–317 meter range provide survey-grade elevations?
No. The elevation image states that the displayed county surface ranges from 218 to 317 meters with a mean of 253 meters, which is useful for regional comparison. It is not a replacement for a survey, engineering benchmark, parcel elevation certificate, or site measurement. Use a suitable official dataset and field verification when exact elevation is required.
Map File Information
The ZIP package contains the original high-resolution JPG versions of the Elkhart County base map, city map, terrain-and-water map, and elevation map. These files are larger than the WebP previews and are better suited to printing, presentations, and offline reference.
- Included Files: Use only the versions confirmed in the article and supplied images
- File Type: Use the confirmed download contents
- Intended Use: Printing, education, presentations, and map-based projects
Related Maps
Sources and References
The maps can be checked against the following official and public sources. The county and parks pages add local history and landscape context, while Census and USGS resources provide authoritative boundary, hydrography, and elevation references.
- Elkhart County – Our History — official county history, including the 1830 establishment and move of the county seat to Goshen
- Elkhart County Parks – Parks and Destinations — official information on Bonneyville Mill, River Preserve, and other county landscapes
- U.S. Census Bureau TIGER/Line Shapefiles — official geographic boundary and transportation data
- USGS National Hydrography — national river, stream, lake, and hydrography data
- USGS 3D Elevation Program — national elevation data and 3DEP resources
Green Map creates custom-edited map images using open geographic data sources such as geoBoundaries, Natural Earth, OpenStreetMap, and government open data.
These maps are edited visual materials, not raw data files, and are provided for education, documents, presentations, and graphic reference.