Among the 62 countries and areas with an observation actually dated 2025, the share of firms reporting a visit or inspection by tax officials, or a requirement to meet with them, has a median of 31.73% and a simple country mean of 35.80%. The spread is much wider than those summary numbers suggest: Qatar is close to zero at 0.03%, while Afghanistan reaches 80.99%. The indicator is about the prevalence of a particular kind of firm–tax-authority contact, not about tax rates or the number of audits.
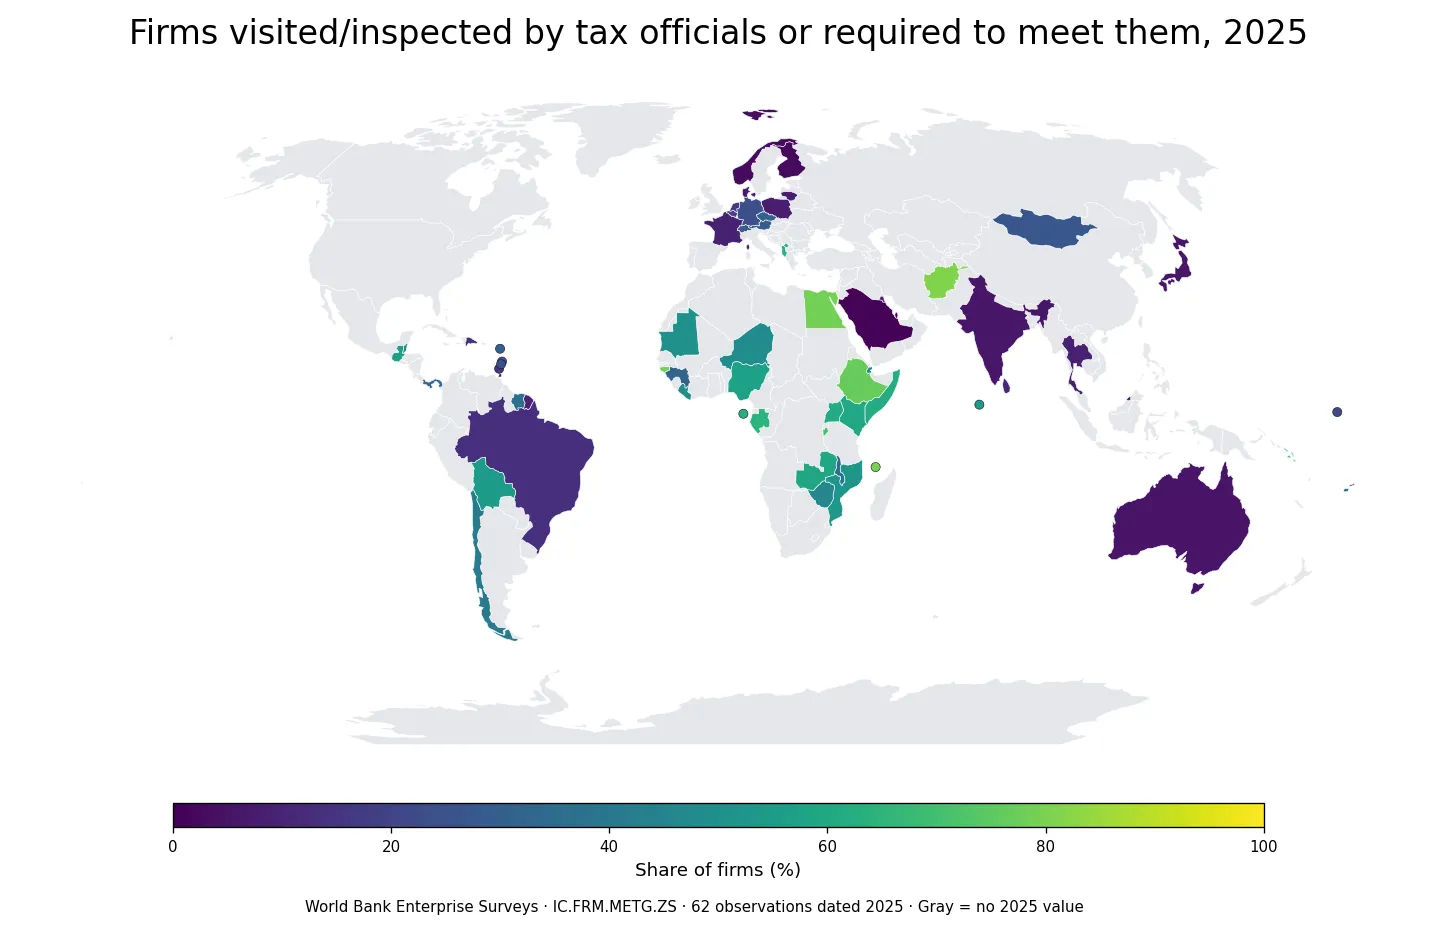
Table of Contents
A 31.7% median is a country summary, not a global firm rate
The 31.73% median is the middle country-level percentage after the 62 observations are ordered from low to high. It does not mean that 31.73% of all firms worldwide had contact with tax officials. The 35.80% mean is also an unweighted average of country percentages, so a small economy and a large economy each contribute one country observation.
The middle half of the 2025 observations lies between 11.42% and 56.96%. Thirteen economies are below 10%, 11 are from 10% to below 25%, 17 are from 25% to below 50%, 16 are from 50% to below 75%, and five are at or above 75%. That distribution is a better description of the cross-country spread than any single average.
What IC.FRM.METG.ZS actually measures
World Bank indicator IC.FRM.METG.ZS comes from Enterprise Surveys. It records the percentage of firms that were visited or inspected by tax officials or were required to meet with them over the previous year. A country value of 40% therefore means that roughly four in ten surveyed firms, after the survey methodology is applied, reported that form of contact.
The indicator does not say how many visits occurred, how long an inspection lasted, whether the interaction was routine or exceptional, or whether any additional payment was involved. It also does not identify the tax involved. Those questions require other survey variables or administrative data.
The highest 2025 observations cluster above 75%
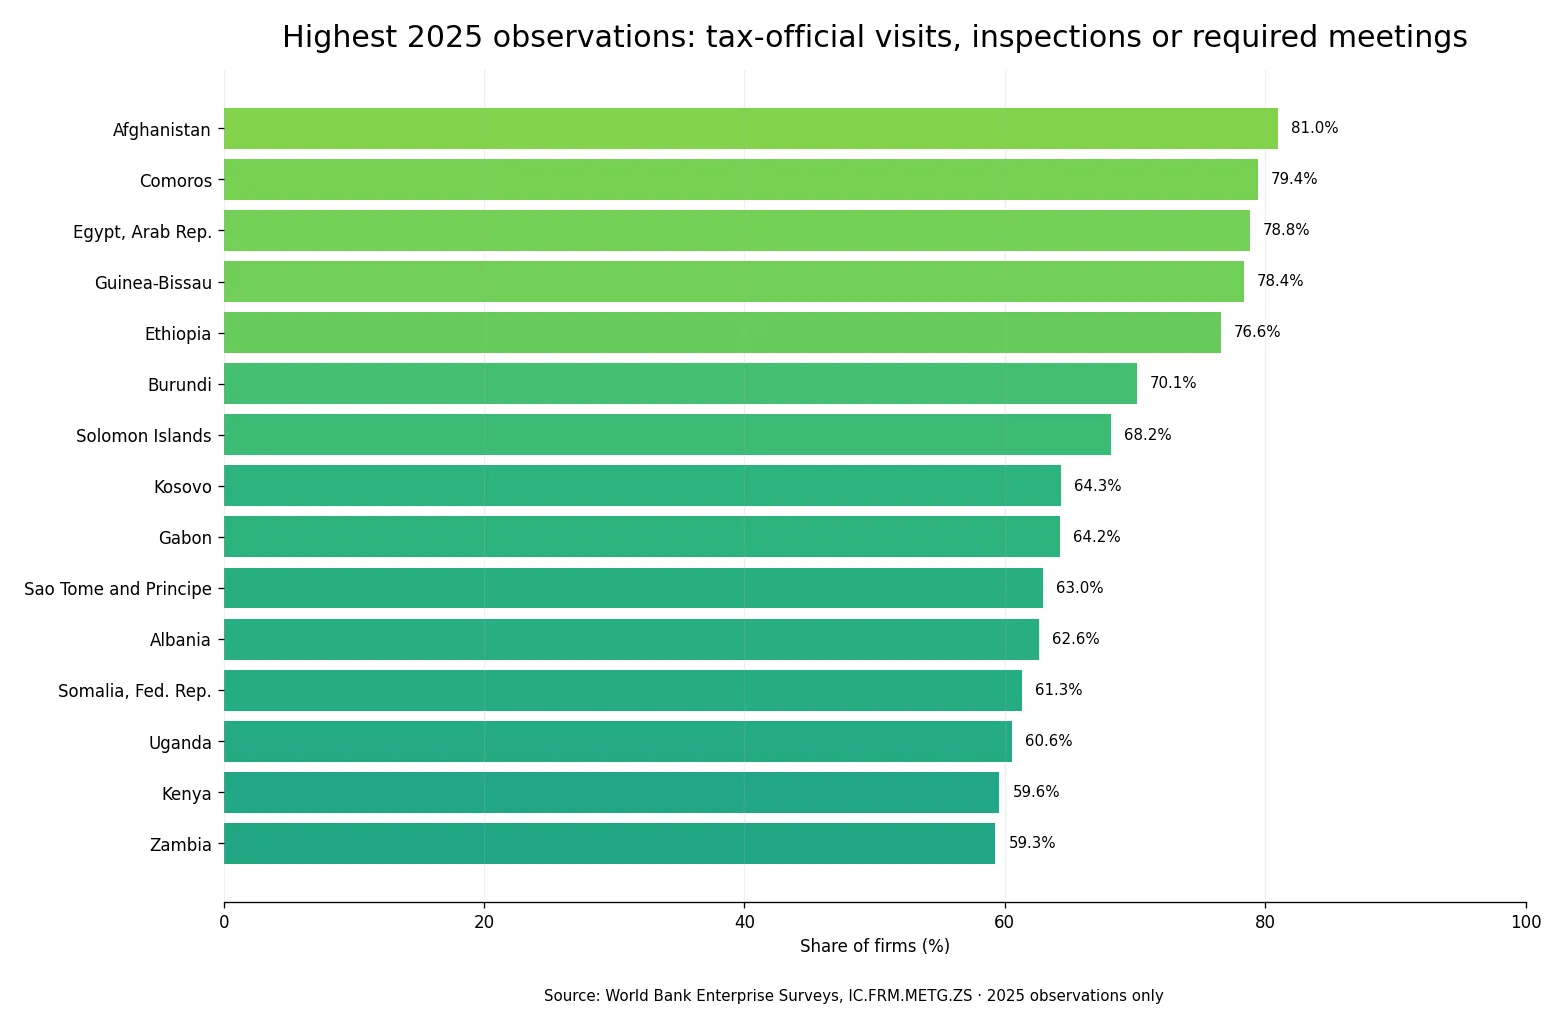
Afghanistan has the highest 2025 observation at 80.99%, followed by Comoros at 79.41%, Egypt at 78.83%, Guinea-Bissau at 78.38%, and Ethiopia at 76.56%. Burundi records 70.14%, the Solomon Islands 68.18%, Kosovo 64.34%, Gabon 64.20%, and Sao Tome and Principe 62.95%.
Several high observations are in Africa, with additional high values in parts of Asia and the Pacific. That is a geographic pattern in the survey results, not a causal explanation. Differences in filing systems, enforcement practices, digital tax administration, the formalization of firms, sector mix, firm size, and survey design may all be relevant, but this single percentage cannot separate their effects.
Low contact shares are not a score of tax-system quality
At the lower end, Qatar is 0.03%, Saudi Arabia 0.80%, Finland 2.63%, Norway 2.81%, and Australia 5.34%. Japan is 6.15%, India 6.20%, Brunei Darussalam 6.67%, and Denmark 6.72%. These figures indicate that the specific form of tax-official contact was reported by a smaller share of surveyed firms in those 2025 observations.
A low percentage does not prove that tax administration is more efficient, less strict, more digital, or less burdensome. Likewise, a high percentage does not prove the opposite. Contact frequency and administrative quality are different concepts, and the survey value should not be turned into a favorable or unfavorable country score without additional evidence.
The 179 latest available country values span 2009–2025
Using the most recent non-missing value for every country or area produces 179 observations, but they are not synchronized in time. Sixty-two are dated 2025, 48 are from 2024, and 45 are from 2023. The remaining 24 are from 2022 or earlier, with the oldest retained observations dating to 2009.
| Latest observation year | Countries/areas |
|---|---|
| 2025 | 62 |
| 2024 | 48 |
| 2023 | 45 |
| 2022 or earlier | 24 |
That is why the main map and rankings use only the 62 observations from 2025. A mixed-year latest-value table is still useful for checking data availability and the last known survey result for an economy, but it should not be presented as a single current world ranking.
Major economies illustrate why the year must stay next to the value
Some large economies are part of the 2025 cross-section, while others have their latest retained observation in an earlier year. Germany is 23.54% in 2025, France 9.32%, India 6.20%, Japan 6.15%, Brazil 13.36%, and Nigeria 57.29%. The United States and China have 2024 observations, Mexico has a 2023 observation, South Africa a 2020 observation, and the Russian Federation a 2019 observation.
| Country/area | Latest observation year | Share of firms |
|---|---|---|
| United States | 2024 | 6.91% |
| China | 2024 | 28.01% |
| Germany | 2025 | 23.54% |
| France | 2025 | 9.32% |
| India | 2025 | 6.20% |
| Japan | 2025 | 6.15% |
| Brazil | 2025 | 13.36% |
| Nigeria | 2025 | 57.29% |
| Korea, Rep. | 2024 | 0.92% |
| South Africa | 2020 | 25.20% |
| Russian Federation | 2019 | 24.59% |
The table is therefore a timing guide as much as a value comparison. Neighboring survey years can provide useful context, but a gap of five or six years can encompass major changes in tax administration and the business environment. A trend analysis should follow multiple Enterprise Survey rounds within the same economy instead of treating these latest values as a common-year panel.
What the map can and cannot tell us
The indicator is useful for identifying where firm contact with tax officials is commonly reported and where it is not. It also makes the timing problem visible: some countries have fresh 2025 information, while others do not. Those are defensible descriptive conclusions directly supported by the series.
It is not a measure of statutory tax rates, effective tax burdens, tax revenue, audit counts, tax evasion, corruption, or the fairness of tax administration. Another Enterprise Surveys indicator asks whether gifts or informal payments were expected or requested during meetings with tax officials; that is a different question with a different numerator. Contact itself should not be treated as evidence that such payments occurred.
Source and mapping method
Country values come from the World Bank IC.FRM.METG.ZS indicator, sourced from World Bank Enterprise Surveys. The World Bank defines the series as the percentage of firms that were visited or inspected by tax officials or were required to meet with them over the last year.
For the 2025 map, ISO-3 codes are joined to Natural Earth 1:110m country boundaries. Fifty-four of the 62 statistical observations match visible country polygons at this scale, and eight small economies are represented by point markers. Missing 2025 observations remain missing rather than being converted to zero. Means, medians, quartiles, and band counts are calculated directly from the 62 country-level percentages.
Frequently Asked Questions
Does this indicator count the number of tax audits?
No. It is the percentage of firms that reported being visited or inspected by tax officials or being required to meet with them over the previous year. It does not count the number of visits or audits.
Why use 62 observations from 2025 instead of all 179 latest values?
The 179 latest retained values span 2009–2025. Restricting the main comparison to observations actually dated 2025 reduces the timing mismatch across countries.
Does a higher percentage mean a worse tax system?
No. The indicator measures the prevalence of firm contact with tax officials. It does not directly measure tax-system quality, tax rates, corruption, or compliance costs.
Does gray on the map mean 0%?
No. Gray means there is no 2025 observation in the synchronized comparison. Missing values are not replaced with zero.
Related Articles
Gifts or informal payments expected in tax-official meetings covers the separate follow-up question about what firms reported during those interactions.
Access to land as firms’ biggest obstacle provides another country comparison from the World Bank Enterprise Surveys business-environment data.
Firms adopting energy-management measures in 2025 is another same-year Enterprise Surveys comparison across countries.
Green Map creates custom-edited map images using open geographic data sources such as geoBoundaries, Natural Earth, OpenStreetMap, and government open data.
These maps are edited visual materials, not raw data files, and are provided for education, documents, presentations, and graphic reference.