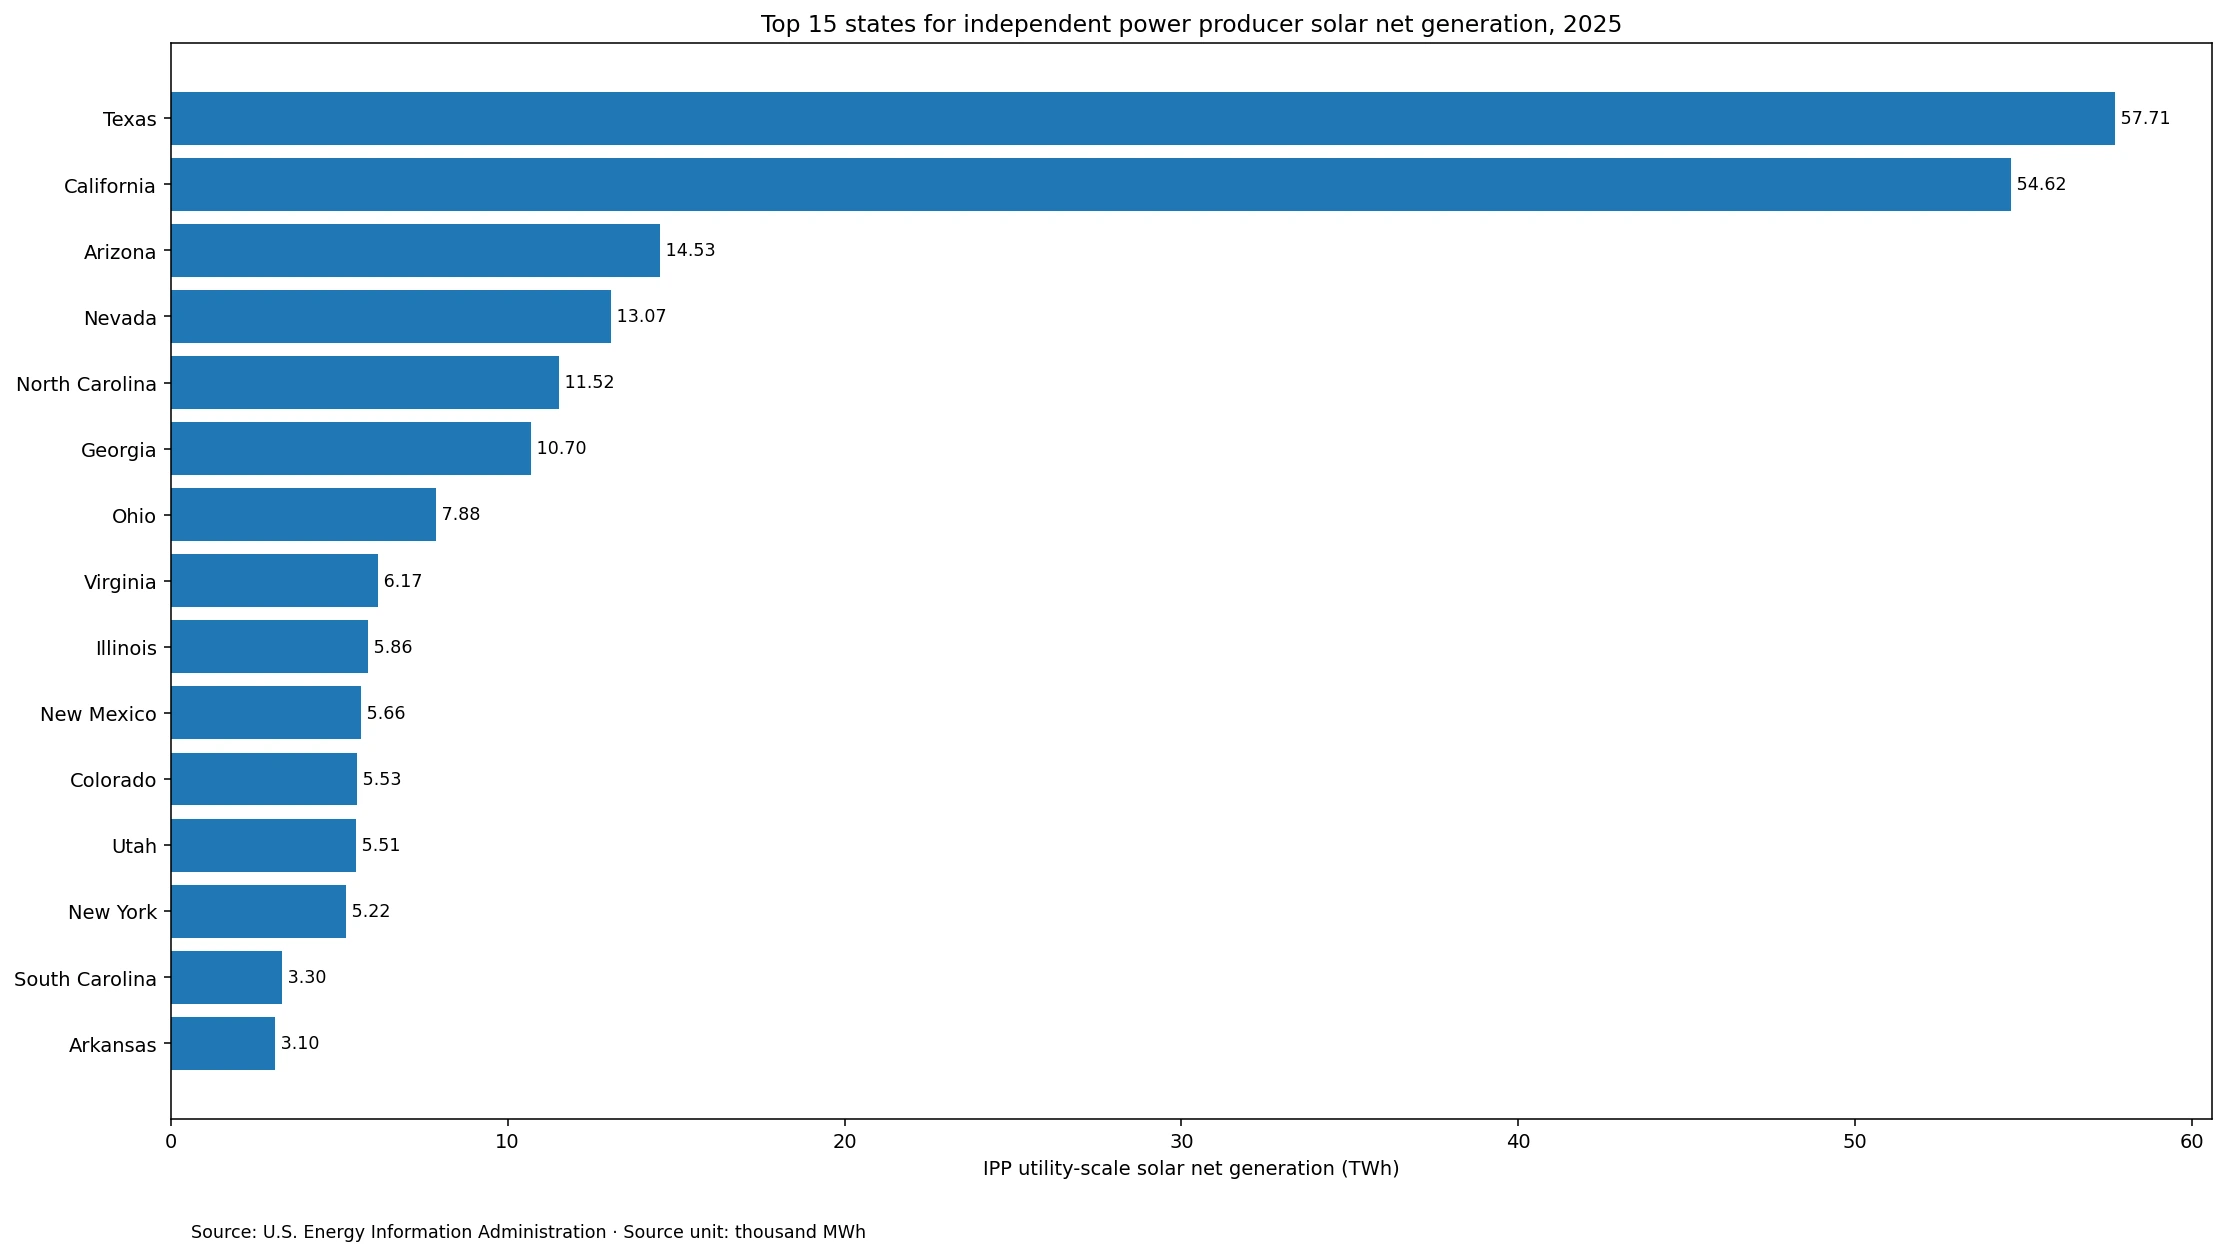
Utility-scale solar net generation from independent power producers was heavily concentrated in a small group of U.S. states in 2025. In the U.S. Energy Information Administration (EIA) annual operational-data series filtered to estimated total solar and Independent Power Producers, Texas is highest at 57.710 TWh. California is close behind at 54.625 TWh, followed by Arizona at 14.532 TWh. Adding the 50 states and the District of Columbia gives 250.555 TWh.
The scope is narrower than total solar generation by state. The sector is Independent Power Producers, and the generation comes from utility-scale facilities in EIA’s electric-power operational data. EIA generally defines utility-scale generating facilities as plants with at least 1 megawatt of generating capacity. Estimated generation from small-scale solar systems below that threshold is reported separately and is not the core of this IPP series.
The fuel facet is labeled estimated total solar. EIA electricity products can separate solar photovoltaic and solar thermal in more detailed tables, while the total-solar concept is broader. Net generation also has a specific meaning: it is electricity produced after subtracting the electricity used by the generating station for its own operations. The values in this article therefore should not be described as installed capacity, total state solar output from every ownership class, or small-scale rooftop solar generation.
Table of Contents
Texas and California alone account for 44.8% of the state sum
Texas contributes 23.0% of the 51-jurisdiction sum and California contributes 21.8%. Together they account for 44.8%. Adding Arizona raises the top-three total to 126.866 TWh, or 50.6% of the sum. Three jurisdictions therefore account for slightly more than half of the state-and-District total in this narrowly defined IPP solar series.
Nevada ranks fourth at 13.072 TWh and North Carolina fifth at 11.519 TWh. The top five together represent 60.4% of the sum. The top ten reach 74.9%, and the top fifteen account for 84.0%. This is a concentrated distribution: the largest state observations contribute far more than would be expected in an even 51-way split.
The 4.913 TWh mean is more than three times the 1.532 TWh median
The arithmetic mean is 4.913 TWh, while the median is 1.532 TWh. The mean is about 3.2 times the median because Texas, California, and the rest of the upper tail pull the average upward. The first quartile is 0.481 TWh and the third quartile is 4.257 TWh. For a skewed distribution like this, the median and concentration shares provide a better picture of a typical jurisdiction than the mean alone.
| 2025 net-generation band | Jurisdictions |
|---|---|
| 0 TWh | 1 |
| Over 0 to 0.5 TWh | 13 |
| Over 0.5 to 1 TWh | 5 |
| Over 1 to 5 TWh | 19 |
| Over 5 to 10 TWh | 7 |
| Over 10 to 20 TWh | 4 |
| Over 20 TWh | 2 |
There is one exact zero in the 51-row series: North Dakota. It is a reported numeric zero, not a missing observation. That should not be expanded into the claim that North Dakota has no solar facilities or no solar generation of any kind. Other ownership classes, small-scale systems, different EIA sectors, or later revisions can contain separate values. The zero applies only to this exact 2025 Independent Power Producers + estimated total solar slice.
Complete 2025 ranking for all 51 jurisdictions
The table below sorts the same 2025 Independent Power Producers + estimated total solar utility-scale net-generation observations from highest to lowest. Shares use the direct 51-row sum of 250.555 TWh as the denominator. The source unit is thousand MWh; display values divide by 1,000 to show TWh without changing the underlying ranking.
| Rank | State or jurisdiction | IPP solar net generation (TWh) | Share of 51-row sum |
|---|---|---|---|
| 1 | Texas (TX) | 57.710 | 23.0% |
| 2 | California (CA) | 54.625 | 21.8% |
| 3 | Arizona (AZ) | 14.532 | 5.8% |
| 4 | Nevada (NV) | 13.072 | 5.2% |
| 5 | North Carolina (NC) | 11.519 | 4.6% |
| 6 | Georgia (GA) | 10.700 | 4.3% |
| 7 | Ohio (OH) | 7.885 | 3.1% |
| 8 | Virginia (VA) | 6.166 | 2.5% |
| 9 | Illinois (IL) | 5.861 | 2.3% |
| 10 | New Mexico (NM) | 5.659 | 2.3% |
| 11 | Colorado (CO) | 5.530 | 2.2% |
| 12 | Utah (UT) | 5.509 | 2.2% |
| 13 | New York (NY) | 5.216 | 2.1% |
| 14 | South Carolina (SC) | 3.298 | 1.3% |
| 15 | Arkansas (AR) | 3.099 | 1.2% |
| 16 | Indiana (IN) | 3.050 | 1.2% |
| 17 | Mississippi (MS) | 2.717 | 1.1% |
| 18 | Oregon (OR) | 2.676 | 1.1% |
| 19 | Florida (FL) | 2.497 | 1.0% |
| 20 | Michigan (MI) | 2.426 | 1.0% |
| 21 | Massachusetts (MA) | 2.422 | 1.0% |
| 22 | Minnesota (MN) | 2.418 | 1.0% |
| 23 | Louisiana (LA) | 2.373 | 0.9% |
| 24 | Pennsylvania (PA) | 1.862 | 0.7% |
| 25 | New Jersey (NJ) | 1.677 | 0.7% |
| 26 | Maine (ME) | 1.532 | 0.6% |
| 27 | Kentucky (KY) | 1.528 | 0.6% |
| 28 | Idaho (ID) | 1.343 | 0.5% |
| 29 | Maryland (MD) | 1.303 | 0.5% |
| 30 | Tennessee (TN) | 1.297 | 0.5% |
| 31 | Alabama (AL) | 1.246 | 0.5% |
| 32 | Missouri (MO) | 1.017 | 0.4% |
| 33 | Hawaii (HI) | 0.884 | 0.4% |
| 34 | Rhode Island (RI) | 0.759 | 0.3% |
| 35 | Connecticut (CT) | 0.730 | 0.3% |
| 36 | Oklahoma (OK) | 0.627 | 0.3% |
| 37 | Washington (WA) | 0.621 | 0.2% |
| 38 | Wyoming (WY) | 0.496 | 0.2% |
| 39 | Wisconsin (WI) | 0.465 | 0.2% |
| 40 | South Dakota (SD) | 0.437 | 0.2% |
| 41 | Kansas (KS) | 0.371 | 0.1% |
| 42 | Montana (MT) | 0.343 | 0.1% |
| 43 | Iowa (IA) | 0.239 | 0.1% |
| 44 | Nebraska (NE) | 0.212 | 0.1% |
| 45 | West Virginia (WV) | 0.201 | 0.1% |
| 46 | Vermont (VT) | 0.180 | 0.1% |
| 47 | Delaware (DE) | 0.163 | 0.1% |
| 48 | District of Columbia (DC) | 0.048 | 0.0% |
| 49 | Alaska (AK) | 0.009 | 0.0% |
| 50 | New Hampshire (NH) | 0.004 | 0.0% |
| 51 | North Dakota (ND) | 0.000 | 0.0% |
The 250.555 TWh state sum matches EIA’s national IPP solar total
The direct sum of the state and District observations is 250.555 TWh. EIA Electric Power Monthly Table 1.2.B reports 250,555 thousand MWh, or 250.555 TWh, of 2025 solar net generation from Independent Power Producers. The difference from the state sum is only 0.357 thousand MWh, well within the rounding used in the national table. That close match is a useful cross-check on the metric scope and unit.
EIA separately reported about 296 TWh of total U.S. utility-scale solar generation in 2025. Comparing that rounded national amount with 250.555 TWh from independent power producers suggests that IPPs represented roughly 84.6% of utility-scale solar generation. Because the 296 TWh figure is rounded in EIA’s public explanation, that percentage is best treated as broad context rather than as a new official EIA metric. Every ranking and share in this article is calculated only from the 51 state-level IPP observations.
Southwestern states stand out, but the ranking does not identify a single cause
Texas, California, Arizona, Nevada, New Mexico, Utah, and Colorado all appear high in the ranking, so the West and Southwest are prominent. North Carolina, Georgia, Virginia, Ohio, Illinois, New York, and South Carolina also appear among the larger observations. The map pattern is therefore not limited to one compact region even though several high-solar-resource states are near the top.
Annual net generation can be shaped by installed capacity, hours of operation, weather, the timing of newly commissioned projects, transmission constraints, curtailment, plant availability, and the ownership classification used by EIA. Those explanatory variables are not included in the one-year state file. The ranking therefore describes where generation was large; it does not demonstrate that one state’s solar resource, policy, market design, or project economics caused the difference.
Net generation is not installed solar capacity
Generation and capacity answer different questions. Generation, measured in MWh or TWh, records electricity produced over a period. Capacity, measured in MW or GW, describes how much output equipment can supply under specified conditions. A state can add a large amount of capacity late in the year and still record less annual generation than a state whose plants operated for the entire year. Weather and curtailment can also change generation without changing nameplate capacity by the same proportion.
Ownership matters as well. This dataset isolates independent power producers, so it cannot by itself calculate the share of all solar generation in a state, solar generation per resident, or the role of distributed rooftop systems. A full state solar profile would need electric-utility generation, IPP generation, commercial and industrial generation where relevant, and EIA’s estimated small-scale photovoltaic generation.
EIA currently labels 2025 values as preliminary
As of September 2026, EIA’s current Electric Power Monthly tables label 2025 and 2026 values as preliminary. Monthly electricity data can be revised as later submissions and annual processing are incorporated. The comparison here therefore uses the currently published 2025 observations and identifies the year explicitly. Individual state values or totals may change slightly when EIA finalizes later releases.
- What this dataset can answer: the absolute size, ranking, distribution, and concentration of 2025 utility-scale solar net generation reported for independent power producers by state.
- What it cannot answer alone: total state solar generation, installed solar capacity, per-capita deployment, levelized cost, profitability, or policy effectiveness.
- Useful follow-up data: generation by other ownership sectors, utility-scale solar capacity, small-scale PV generation, commissioning dates, curtailment, and a consistent multi-year series.
Source and calculation method
The state observations come from the U.S. Energy Information Administration API v2 Electric Power Operational Data. The selected slice is annual 2025 data with field=generation, fueltypeid=TSN (estimated total solar), and sectorid=94 (Independent Power Producers). The source unit is thousand megawatthours. The national cross-check uses Electric Power Monthly Table 1.2.B, and broader 2025 utility-scale solar context comes from EIA’s 2025 wind and solar generation summary.
All 51 state and District codes are unique, every row is dated 2025, and there are no missing numeric values. There is 1 exact zero. The sum (250.555 TWh), mean (4.913 TWh), median (1.532 TWh), quartiles, rankings, and cumulative shares are calculated directly from those 51 observations. The representative chart displays the top 15 states, but all 51 observations remain in the tables and statistical calculations.
Main takeaway
Texas leads 2025 independent-power-producer utility-scale solar net generation at 57.710 TWh, followed closely by California at 54.625 TWh and Arizona at 14.532 TWh. Texas and California together account for 44.8% of the 51-jurisdiction sum, while the top ten account for 74.9%. The mean of 4.913 TWh is more than three times the 1.532 TWh median, reinforcing how strongly the upper tail shapes the distribution. The ranking is useful as a precisely bounded production comparison, not as a scorecard of total solar deployment or state policy performance.
Frequently Asked Questions
Which state had the most independent-power-producer solar net generation in 2025?
Texas ranked first at 57.710 TWh, followed by California at 54.625 TWh and Arizona at 14.532 TWh.
Does this measure total solar generation in each state?
No. It covers utility-scale estimated total solar net generation assigned by EIA to Independent Power Producers. Other ownership sectors and small-scale solar are separate.
Is net generation the same as installed solar capacity?
No. Net generation is electricity produced over time and is measured in MWh or TWh. Capacity is the output capability of equipment and is measured in MW or GW.
Are the 2025 EIA values final?
EIA's current Electric Power Monthly tables label 2025 values as preliminary, so later releases can revise some state or national values.
Related Articles
- Where Is U.S. Industrial and Commercial Electricity Generation Concentrated? (2024)
- Which U.S. States Used the Most Fuel for Useful Thermal Output? (2025)
- Where Petroleum-Related U.S. Power-Sector NOx Emissions Were Concentrated in 2024
Green Map creates custom-edited map images using open geographic data sources such as geoBoundaries, Natural Earth, OpenStreetMap, and government open data.
These maps are edited visual materials, not raw data files, and are provided for education, documents, presentations, and graphic reference.