Coal-related energy CO₂ emissions varied sharply across the United States in 2022. Adding the values for all 50 states and Washington, D.C., gives 945.3 million metric tons of CO₂. Texas was the largest state-level total at 89.35 million metric tons, followed by Indiana at 68.49 and Missouri at 54.32. The pattern was also concentrated: the ten highest jurisdictions accounted for 56.2% of the 51-jurisdiction sum.
The metric needs a precise reading. It is not coal production, coal reserves, or the percentage of electricity generated from coal. The U.S. Energy Information Administration (EIA) estimates energy-related CO₂ emissions where fossil fuels are consumed. This comparison fixes the fuel at coal, the sector at the total of all sectors, and the year at 2022. It therefore answers where coal use was associated with the largest absolute amounts of energy-related CO₂, not where the most coal was mined.
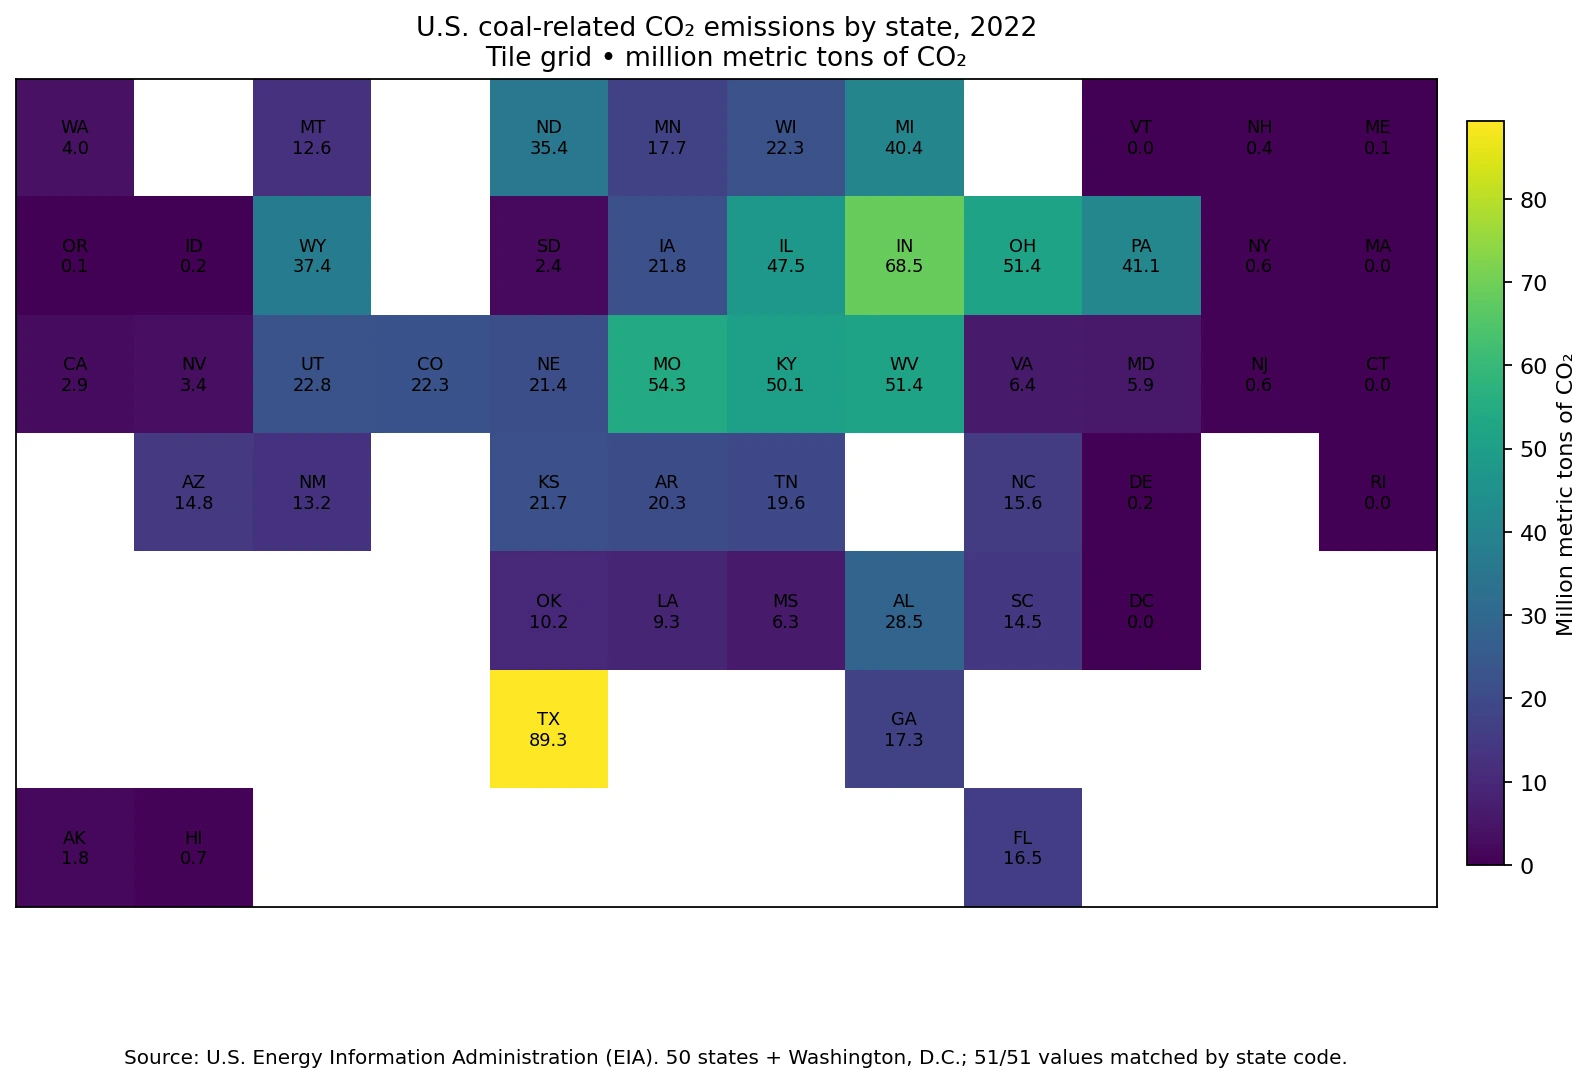
Table of Contents
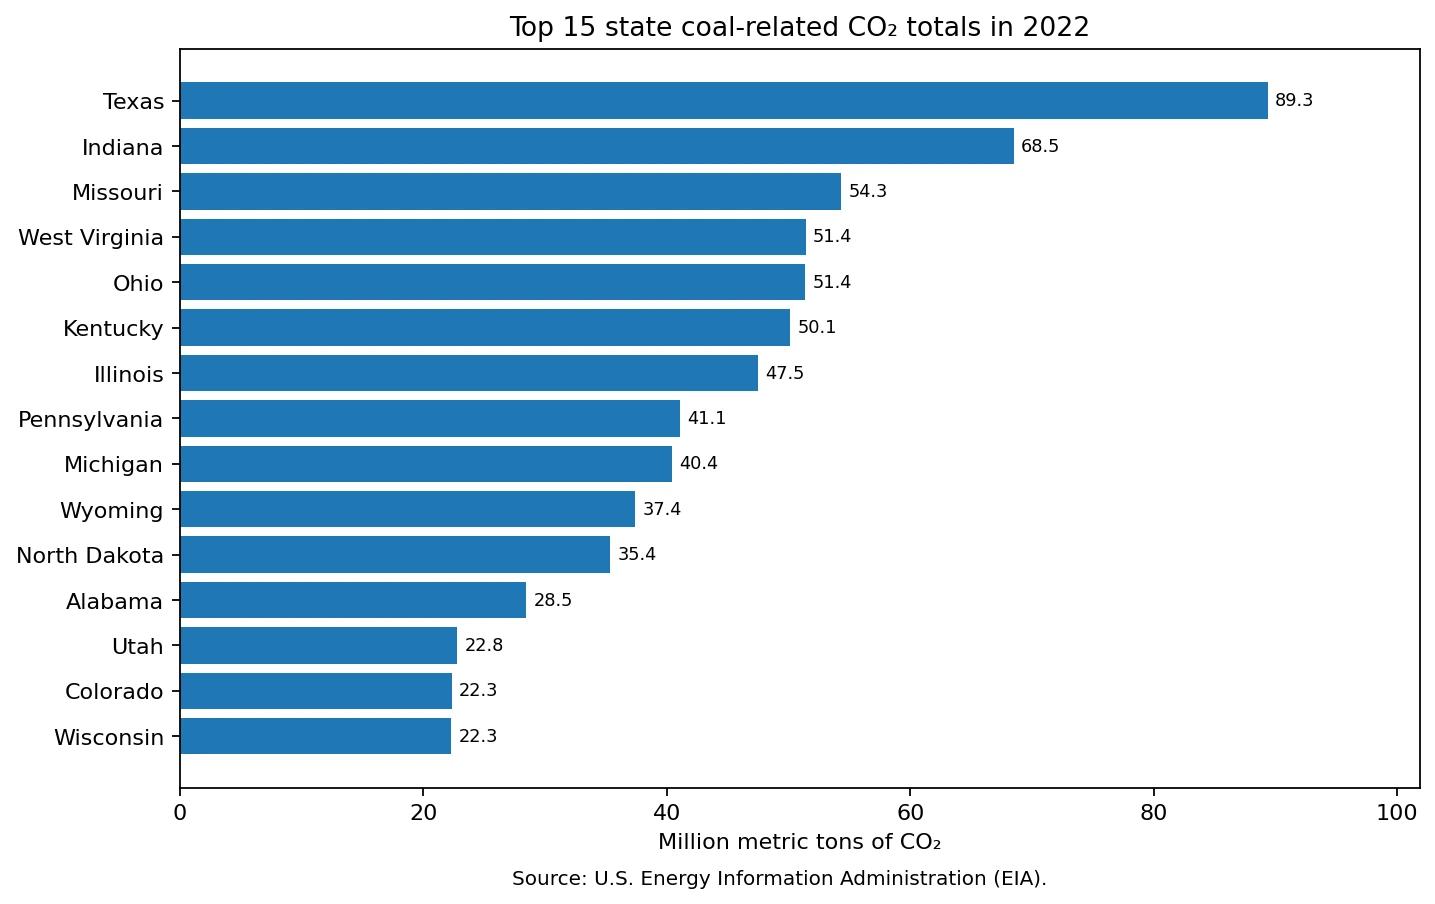
Texas led at 89.35 million metric tons, and six jurisdictions exceeded 50 million
Sorting the 51 values from highest to lowest produces a clear upper tier. Texas at 89.35 million metric tons was about 20.86 million metric tons above Indiana at 68.49. Missouri was third at 54.32, followed by West Virginia at 51.40, Ohio at 51.37, and Kentucky at 50.13. Those were the only six jurisdictions at or above 50 million metric tons in the 2022 file.
Illinois, Pennsylvania, Michigan, Wyoming, and North Dakota formed the next group, ranging from 47.50 to 35.38 million metric tons. By contrast, the median observation was South Carolina at about 14.46 million metric tons. The highest value was more than six times the median, which is why a national total or a simple average alone does not describe the state-level spread very well.
| Rank | State / jurisdiction | 2022 emissions (million metric tons CO₂) |
|---|---|---|
| 1 | Texas | 89.35 |
| 2 | Indiana | 68.49 |
| 3 | Missouri | 54.32 |
| 4 | West Virginia | 51.40 |
| 5 | Ohio | 51.37 |
| 6 | Kentucky | 50.13 |
| 7 | Illinois | 47.50 |
| 8 | Pennsylvania | 41.11 |
| 9 | Michigan | 40.42 |
| 10 | Wyoming | 37.39 |
| 11 | North Dakota | 35.38 |
| 12 | Alabama | 28.45 |
| 13 | Utah | 22.79 |
| 14 | Colorado | 22.35 |
| 15 | Wisconsin | 22.27 |
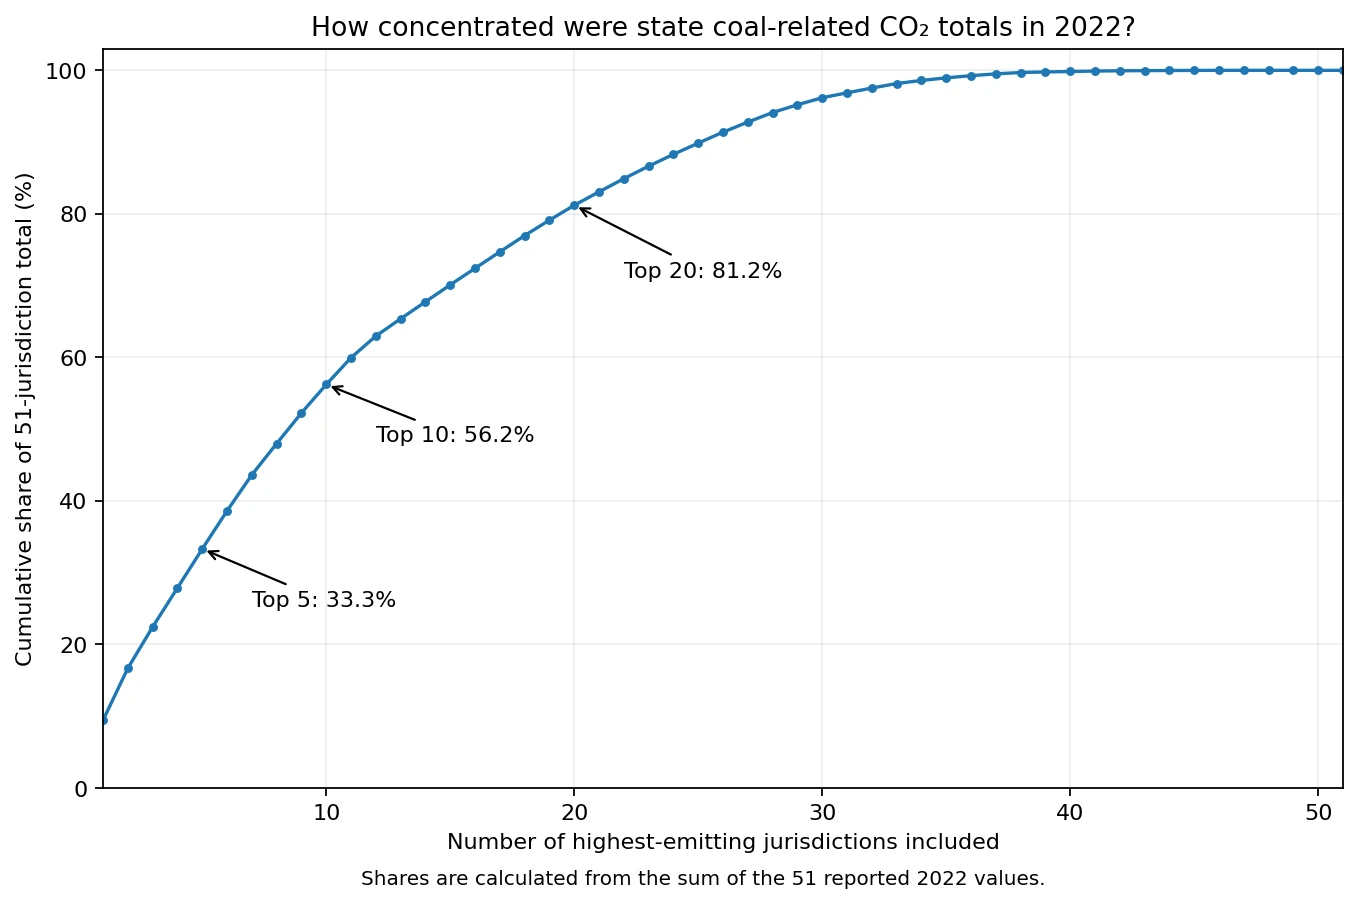
The top ten jurisdictions produced 56.2% of the 51-jurisdiction total
The concentration becomes clearer when the values are accumulated from the top of the ranking. The top five contributed 33.3% of the total, the top ten 56.2%, and the top twenty 81.2%. In other words, more than half of the summed state-and-D.C. coal-related CO₂ emissions came from the ten highest jurisdictions, while the top twenty represented roughly four-fifths.
These shares describe concentration, not causation. The dataset does not by itself contain state-level electricity generation, industrial structure, plant efficiency, coal quality, fuel-switching decisions, or retirement schedules. Those factors may be relevant in a deeper explanation, but they cannot be inferred from a single emissions column. The defensible conclusion here is that absolute coal-related CO₂ totals were unevenly distributed across states in 2022.
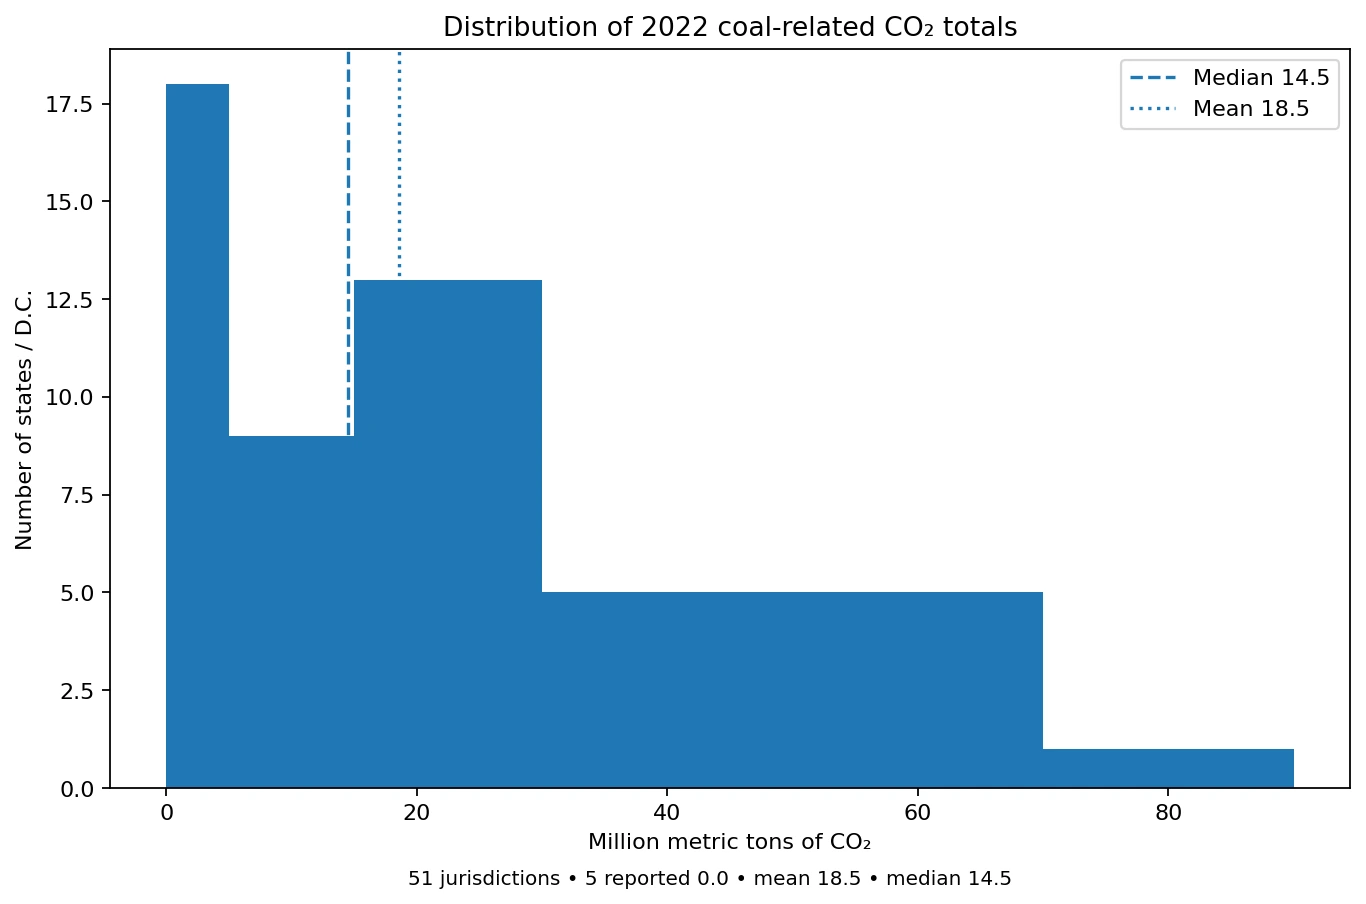
The mean was 18.53 million metric tons, while the median was 14.46
The unweighted mean across the 51 jurisdictions was 18.53 million metric tons, compared with a median of 14.46. The higher mean reflects the long upper tail created by states such as Texas and Indiana. The first quartile was about 1.26 million metric tons and the third quartile about 22.57, so the middle half of the observations occupied a much narrower range than the full 0-to-89.35 spread.
A banded count shows the shape of the distribution. Five jurisdictions reported exactly 0.0. Thirteen were above zero but below 5 million metric tons, nine were from 5 to under 15, and thirteen were from 15 to under 30. Five were from 30 to under 50, while six reached 50 or more. This mix of many low observations and a small high-emissions tier is why both the median and the ranked distribution are useful alongside the mean.
| 2022 emissions band (million metric tons CO₂) | Jurisdictions |
|---|---|
| 0 | 5 |
| >0 to <5 | 13 |
| 5 to <15 | 9 |
| 15 to <30 | 13 |
| 30 to <50 | 5 |
| 50+ | 6 |
Five reported zero values are not missing data
Connecticut, the District of Columbia, Massachusetts, Rhode Island, and Vermont each have a reported value of 0.0 for 2022. Those rows are numeric observations, so they should not be relabeled as “no data,” imputed from another year, or removed from the distribution. The 51-row comparison has complete numeric coverage: every state plus D.C. has a value.
There is also a distinct group of small positive values. Oregon was about 0.10 million metric tons, Maine 0.12, Delaware 0.18, Idaho 0.18, New Hampshire 0.37, New York 0.59, and New Jersey 0.59. Treating all of those as zero would erase information in the source. For maps and charts, a true zero and a missing observation are different categories and need to remain separate.
| Low-end order | State / jurisdiction | 2022 emissions (million metric tons CO₂) |
|---|---|---|
| 1 | Connecticut | 0.00 |
| 2 | District of Columbia | 0.00 |
| 3 | Massachusetts | 0.00 |
| 4 | Rhode Island | 0.00 |
| 5 | Vermont | 0.00 |
| 6 | Oregon | 0.10 |
| 7 | Maine | 0.12 |
| 8 | Delaware | 0.18 |
| 9 | Idaho | 0.18 |
| 10 | New Hampshire | 0.37 |
| 11 | New York | 0.59 |
| 12 | New Jersey | 0.59 |
| 13 | Hawaii | 0.74 |
| 14 | Alaska | 1.78 |
| 15 | South Dakota | 2.37 |
This is an all-sector coal metric, not a power-plant-only total
The phrase “coal emissions” can easily be read as shorthand for coal-fired electricity, but the sector dimension here is the total of all sectors. EIA’s state energy-related CO₂ framework covers emissions associated with fossil-fuel consumption in residential, commercial, industrial, transportation, and electric power activities. Coal use is strongly linked with electricity in many states, but the metric itself should not be relabeled as power-sector coal emissions unless the sector filter is changed to electric power.
It is also an absolute emissions measure rather than a per-capita rate or a carbon-intensity measure. Large and small states are compared in the same unit of million metric tons. A state can have a high absolute total without having the highest emissions per resident, per dollar of economic output, or per unit of electricity generated. Those are different questions that require appropriate denominators.
Coal production and coal-related emissions measure different locations and activities
A common interpretation error is to treat the emissions ranking as if it were a coal-mining ranking. Wyoming illustrates the distinction. It is widely associated with U.S. coal production, yet its 2022 coal-related CO₂ total in this dataset was 37.39 million metric tons, ranking tenth. That does not imply that production and emissions move in opposite directions; it simply shows that mining location and fuel-consumption location are different concepts.
The same caution applies to Texas at the top of the emissions ranking. The 89.35 million metric ton value does not establish that Texas mined the most coal or had the highest coal share of electricity generation. A production comparison needs mine output data. A power-mix comparison needs coal generation or coal’s percentage of total generation. The present metric directly supports only the 2022 state comparison of coal-related energy CO₂ totals.
Why the comparison holds every jurisdiction to 2022
A cross-state ranking is easier to interpret when every observation refers to the same year. Mixing a 2022 value for one state with a 2024 value for another could make time change look like geographic difference. This analysis therefore holds the year at 2022 for all 51 jurisdictions. A trend question would need a separate multi-year panel with the same definition applied consistently to every state.
EIA now publishes state energy-related CO₂ information through the State Energy Data System (SEDS), and later annual estimates are available. That does not make the 2022 comparison invalid; it means the numbers here should be read as a fixed historical snapshot rather than the latest state emissions ranking. Measuring change after 2022 requires bringing later years into the same series and calculating year-to-year or longer-run differences explicitly.
Data source and calculation method
The statistical source is the U.S. Energy Information Administration Open Data system. The 2022 query fixes the fuel at coal and the sector at the all-sector total, producing one annual value for each of the 50 states and Washington, D.C. EIA’s State Carbon Dioxide Emissions Data documentation describes energy-related CO₂ as emissions associated with fossil-fuel consumption at the location where those fuels are consumed. The unit used here is million metric tons of carbon dioxide.
All totals, ranks, quartiles, band counts, and concentration shares were calculated directly from the 51 numeric observations. Their sum is 945.282 million metric tons, which rounds to the EIA U.S. 2022 coal total of about 945.3 million metric tons. No observations are missing, and the five reported 0.0 values remain zeros. The tile-grid visual joins the state abbreviations to all 51 rows, providing 100% value coverage while making clear that the tiles are not literal state-boundary geometry.
What the 2022 state comparison shows most clearly
The strongest result is the combination of a wide state gap and a concentrated upper tier. Texas and Indiana were far above the median, and the top ten jurisdictions together represented more than half of the state-and-D.C. total. At the same time, five jurisdictions reported zero and many others were below 5 million metric tons. Those facts are directly supported by the 2022 data. Explanations about policy, plant retirements, fuel prices, industrial composition, or generation choices require additional evidence and should be analyzed separately.
Frequently Asked Questions
Which state had the highest coal-related CO₂ emissions in 2022?
Texas had the highest all-sector coal-related total in the EIA 2022 data at about 89.35 million metric tons of CO₂. Indiana ranked second at about 68.49 million metric tons.
Do the 0.0 values mean data are missing?
No. Connecticut, the District of Columbia, Massachusetts, Rhode Island, and Vermont have reported numeric values of 0.0. All 51 jurisdictions have numeric observations in this comparison.
Are these emissions only from coal-fired power plants?
No. The fuel is coal, but the sector is the total of all sectors. It should not be interpreted as an electric-power-only emissions series.
Can this ranking be used as a ranking of coal production?
No. The metric measures energy-related CO₂ associated with coal consumption. Coal production and mining require a separate production dataset.
Related Articles
- Coal dependence in electricity generation by country, 2021
- Fossil-fuel share of electricity generation by country, 2021
- Natural-gas share of electricity generation by country, 2021
Green Map creates custom-edited map images using open geographic data sources such as geoBoundaries, Natural Earth, OpenStreetMap, and government open data.
These maps are edited visual materials, not raw data files, and are provided for education, documents, presentations, and graphic reference.