In the 2023 UNESCO Institute for Statistics dataset, 60 of 85 reported countries and areas have an adjusted gender parity index (GPIA) of exactly 1.00000 for the share of short-cycle tertiary students enrolled in vocational programmes. Using the broader 0.97–1.03 range that UIS commonly treats as approximate parity, 66 observations fall inside the band and 19 fall outside it.
The indicator is not a ranking of vocational student counts. It first compares the share of female short-cycle tertiary students enrolled in vocational programmes with the equivalent share for male students, then expresses the relationship on an adjusted parity scale. A value of 1 means the female and male indicator values are equal. Values below 1 indicate a lower female share, while values above 1 indicate a higher female share.
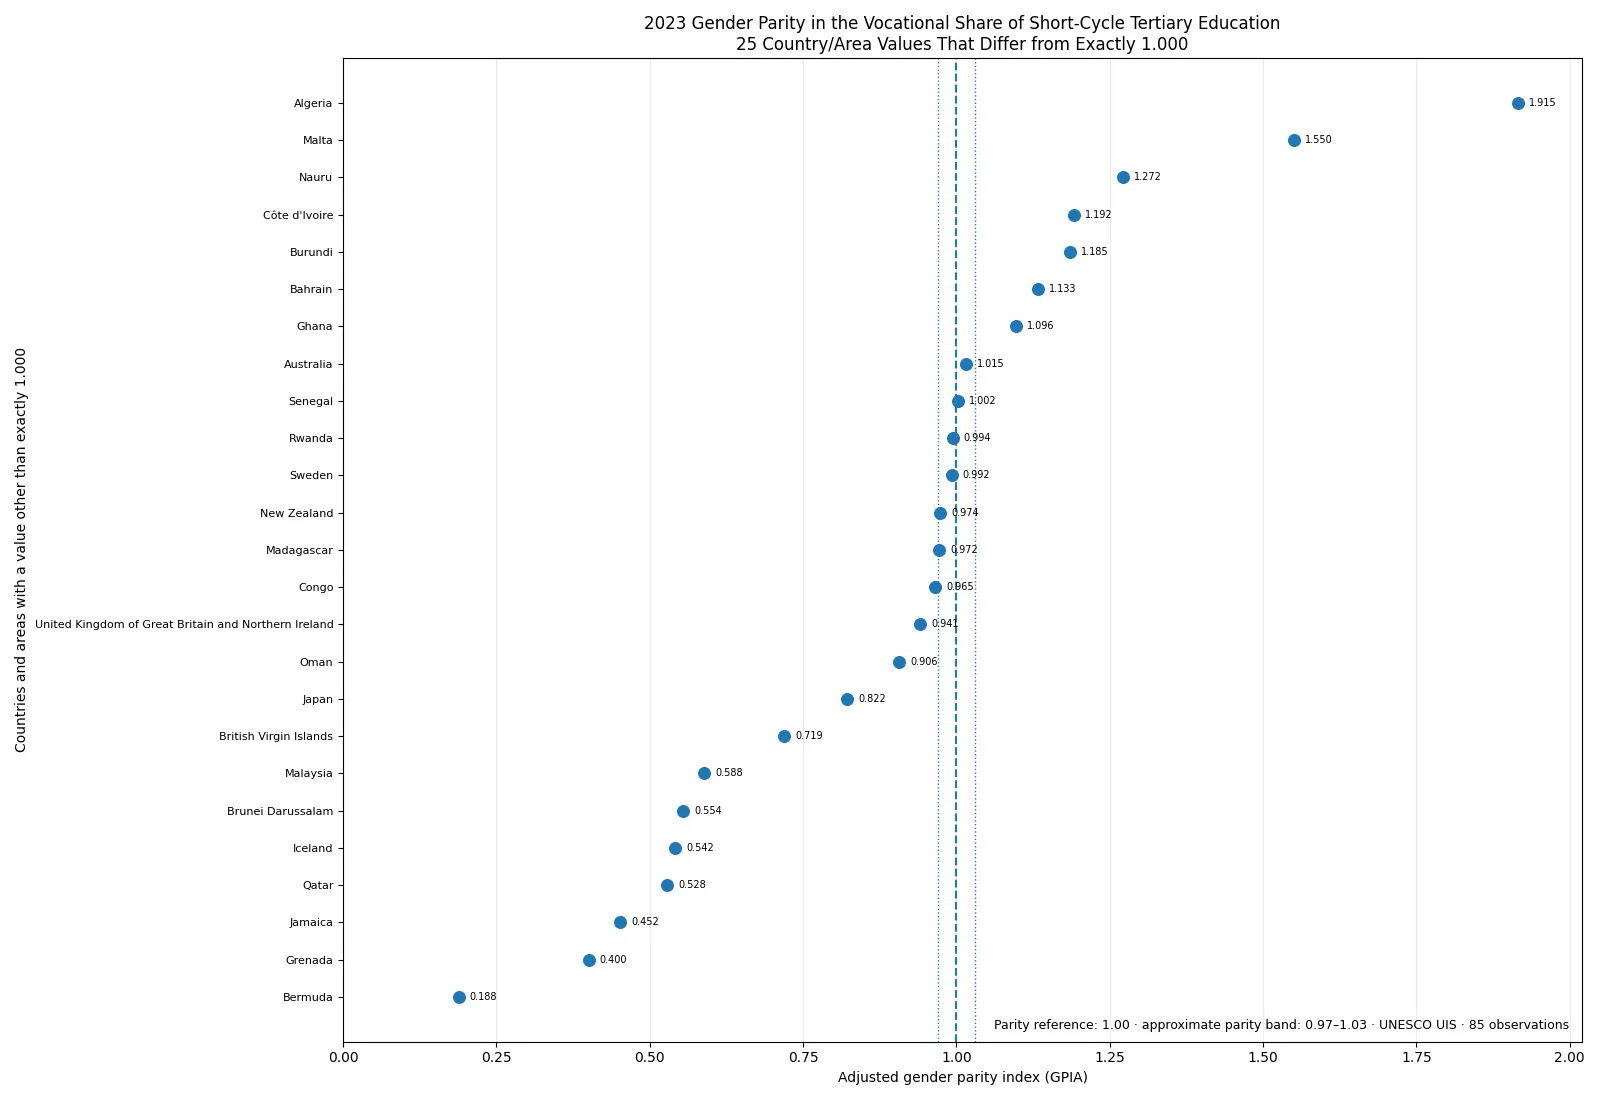
Table of Contents
What the indicator actually compares
The underlying measure concerns short-cycle tertiary education, a part of tertiary education generally designed to provide relatively short, professionally oriented or occupationally relevant programmes. The UIS indicator looks at the share of students at this level who are enrolled in vocational programmes and compares that share by sex. It therefore answers a different question from either the total number of vocational students or the overall proportion of tertiary students in vocational education.
The gender comparison uses the UIS adjusted gender parity index. When the female indicator value is less than or equal to the male value, the female value is divided by the male value. When the female value is higher, the ratio is inverted and subtracted from 2. The adjustment creates a 0-to-2 scale that is symmetric around the parity point of 1.
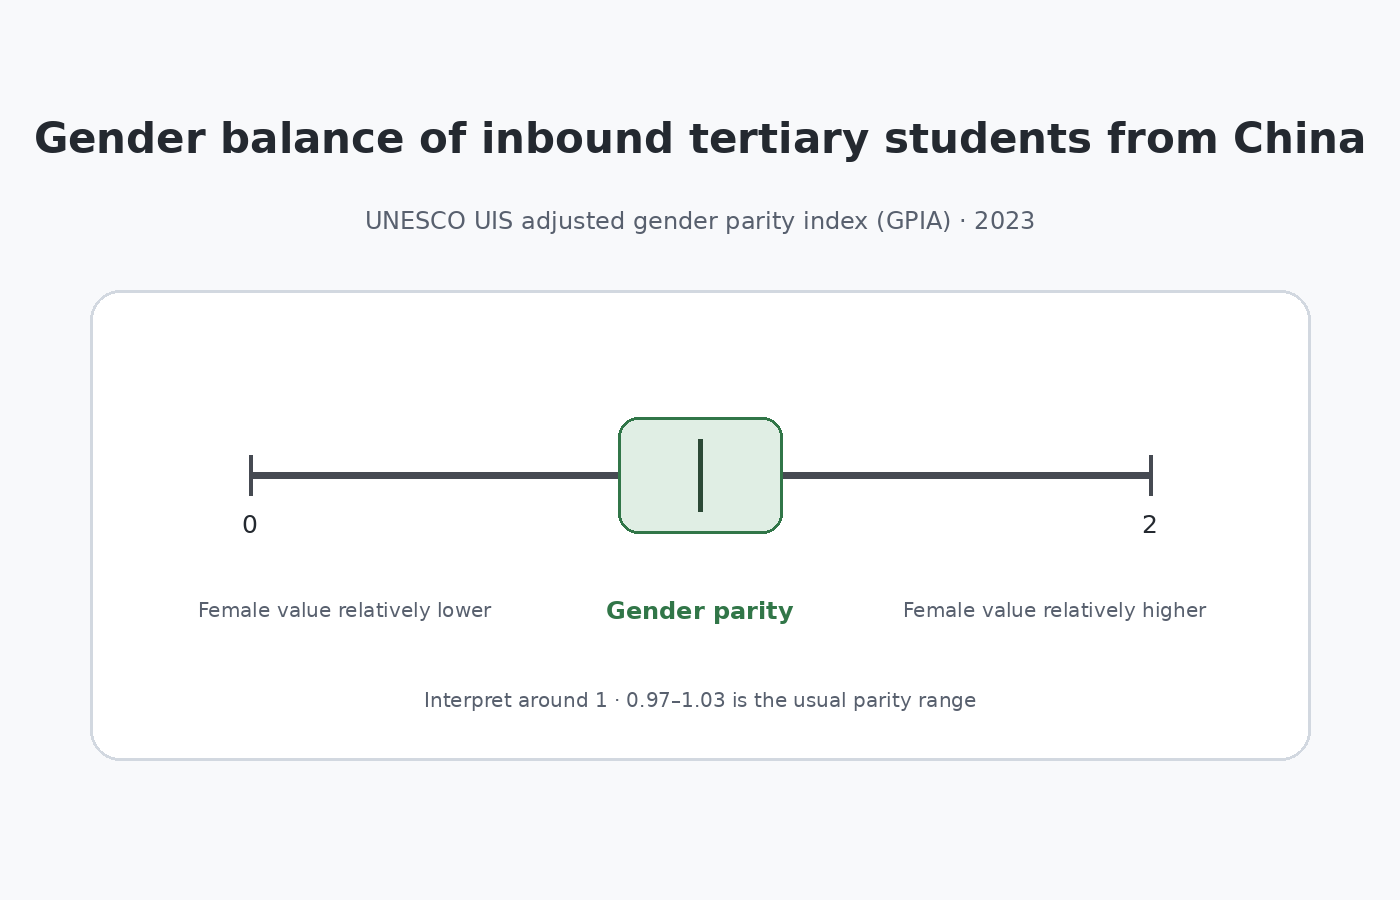
UIS commonly interprets 0.97–1.03 as approximate parity. That band does not indicate whether participation in vocational programmes is high or low in absolute terms. Both sexes could have a high vocational share or both could have a low one and still produce a parity index close to 1. The index is about the difference between the two sex-specific values.
Sixty of 85 observations are exactly 1.00000
Exactly 60 of the 85 reported country and area values are 1.00000. The 0.97–1.03 band contains 66 observations, so another 6 values are close enough to 1 to fall inside the approximate parity range without being exactly equal. 12 observations are below 0.97 and 7 are above 1.03.
The unweighted mean of all 85 values is 0.975 and the median is 1.000. Both the first and third quartiles are 1.000 and 1.000, respectively. This concentration at 1 means that the center of the distribution is very close to parity, although several observations are far from 1 and are not well represented by the average alone.
| Position relative to parity | Countries/areas | Share of 85 |
|---|---|---|
| Below 0.97 | 12 | 14.1% |
| 0.97–1.03 | 66 | 77.6% |
| Above 1.03 | 7 | 8.2% |
| Exactly 1.00000 | 60 | 70.6% |
Bermuda is lowest and Algeria is highest
Bermuda has the lowest reported value at 0.18838. Grenada follows at 0.40041, Jamaica at 0.45210, Qatar at 0.52799, Iceland at 0.54151, Brunei Darussalam at 0.55443, and Malaysia at 0.58813. Values in this direction indicate that the female vocational share within short-cycle tertiary education is lower than the male share.
For adjusted parity values below 1, the reported number is the female-to-male ratio of the underlying indicator. A value of 0.5, for example, means the female indicator is half the male indicator. Extreme ratios should still be treated carefully because a large relative gap can arise when an underlying share is small. The parity value alone does not reveal student counts.
| Lowest values | 2023 GPIA |
|---|---|
| Bermuda | 0.18838 |
| Grenada | 0.40041 |
| Jamaica | 0.45210 |
| Qatar | 0.52799 |
| Iceland | 0.54151 |
| Brunei Darussalam | 0.55443 |
| Malaysia | 0.58813 |
| British Virgin Islands | 0.71875 |
| Japan | 0.82194 |
| Oman | 0.90613 |
At the upper end, Algeria records 1.91498, the value closest to the scale maximum of 2. Malta is 1.55024, Nauru 1.27215, Côte d’Ivoire 1.19238, Burundi 1.18538, Bahrain 1.13312, and Ghana 1.09635. Values above 1 indicate that the female indicator value is higher than the male value.
| Highest values | 2023 GPIA |
|---|---|
| Algeria | 1.91498 |
| Malta | 1.55024 |
| Nauru | 1.27215 |
| Côte d'Ivoire | 1.19238 |
| Burundi | 1.18538 |
| Bahrain | 1.13312 |
| Ghana | 1.09635 |
| Australia | 1.01515 |
| Senegal | 1.00192 |
| Albania | 1.00000 |
Values above 1 are adjusted and are not simple multiples
A key feature of GPIA is that values above 1 are transformed. A value of 1.5 does not mean that the female share is simply 50% higher than the male share. Under the adjusted formula, an unadjusted female-to-male ratio of 2 becomes a GPIA of 1.5. The transformation is designed so that 0.5 and 1.5 are equally distant from parity.
That is why Algeria’s 1.91498 should be described as a very large disparity in the female-higher direction rather than as a direct 1.91498-to-1 ratio. The symmetric scale is useful for ranking the distance from parity, but recovering the original female-to-male ratio requires reversing the adjustment for values above 1.
Parity does not tell us how large vocational participation is
A parity value of 1 answers a relative question only. If the female and male vocational shares were both 20%, the GPIA would be 1; if both were 100%, it would also be 1. The index therefore cannot show whether vocational programmes are common or uncommon within short-cycle tertiary education. Sex-specific source values are needed for that.
The reverse is also important. A value far from 1 does not automatically mean that a large number of students are affected. In a small tertiary system or a small programme category, a large relative difference can be produced by small underlying numbers. Cross-country policy comparisons should therefore combine parity values with enrolment counts and the original female and male shares whenever those data are available.
What the distribution reveals
The unusually large number of exact 1.00000 observations is the clearest feature of the dataset. In addition, Sweden at 0.99238, Rwanda at 0.99392, Senegal at 1.00192, and Australia at 1.01515 are very close to parity without being exact. Madagascar at 0.97198 and New Zealand at 0.97385 also fall inside the 0.97–1.03 band.
Only 19 of the 85 reported observations lie outside the approximate parity band: 12 on the lower side and 7 on the upper side. Those departures describe differences in the vocational share within each sex’s short-cycle tertiary enrolment, not simply which sex has more vocational students in absolute numbers.
The dataset does not provide enough information to explain why particular countries or areas differ. Programme design, education-system structure, fields of study, labour-market pathways, and enrolment scale could all matter, but causal claims require additional evidence. The 2023 GPIA values are best used as a descriptive cross-country comparison.
All 85 reported values
The table below sorts all reported observations from the lowest to the highest GPIA. The many 1.00000 entries are values reported in the official source, not replacements for missing data. Five decimal places are retained so values very close to parity remain distinguishable.
| Rank | Country or area | 2023 GPIA |
|---|---|---|
| 1 | Bermuda | 0.18838 |
| 2 | Grenada | 0.40041 |
| 3 | Jamaica | 0.45210 |
| 4 | Qatar | 0.52799 |
| 5 | Iceland | 0.54151 |
| 6 | Brunei Darussalam | 0.55443 |
| 7 | Malaysia | 0.58813 |
| 8 | British Virgin Islands | 0.71875 |
| 9 | Japan | 0.82194 |
| 10 | Oman | 0.90613 |
| 11 | United Kingdom of Great Britain and Northern Ireland | 0.94120 |
| 12 | Congo | 0.96543 |
| 13 | Madagascar | 0.97198 |
| 14 | New Zealand | 0.97385 |
| 15 | Sweden | 0.99238 |
| 16 | Rwanda | 0.99392 |
| 17 | Albania | 1.00000 |
| 18 | Andorra | 1.00000 |
| 19 | Armenia | 1.00000 |
| 20 | Austria | 1.00000 |
| 21 | Azerbaijan | 1.00000 |
| 22 | Bangladesh | 1.00000 |
| 23 | Belarus | 1.00000 |
| 24 | Belgium | 1.00000 |
| 25 | Bosnia and Herzegovina | 1.00000 |
| 26 | Brazil | 1.00000 |
| 27 | Cambodia | 1.00000 |
| 28 | Cameroon | 1.00000 |
| 29 | Canada | 1.00000 |
| 30 | Chile | 1.00000 |
| 31 | China | 1.00000 |
| 32 | China, Hong Kong Special Administrative Region | 1.00000 |
| 33 | China, Macao Special Administrative Region | 1.00000 |
| 34 | Croatia | 1.00000 |
| 35 | Cuba | 1.00000 |
| 36 | Cyprus | 1.00000 |
| 37 | Czechia | 1.00000 |
| 38 | Denmark | 1.00000 |
| 39 | Ecuador | 1.00000 |
| 40 | El Salvador | 1.00000 |
| 41 | France | 1.00000 |
| 42 | Georgia | 1.00000 |
| 43 | Germany | 1.00000 |
| 44 | Hungary | 1.00000 |
| 45 | Indonesia | 1.00000 |
| 46 | Israel | 1.00000 |
| 47 | Italy | 1.00000 |
| 48 | Kyrgyzstan | 1.00000 |
| 49 | Lao People's Democratic Republic | 1.00000 |
| 50 | Latvia | 1.00000 |
| 51 | Lithuania | 1.00000 |
| 52 | Luxembourg | 1.00000 |
| 53 | Mexico | 1.00000 |
| 54 | Monaco | 1.00000 |
| 55 | Mongolia | 1.00000 |
| 56 | Morocco | 1.00000 |
| 57 | Netherlands | 1.00000 |
| 58 | Norway | 1.00000 |
| 59 | Palestine | 1.00000 |
| 60 | Peru | 1.00000 |
| 61 | Poland | 1.00000 |
| 62 | Portugal | 1.00000 |
| 63 | Republic of Korea | 1.00000 |
| 64 | Republic of Moldova | 1.00000 |
| 65 | Seychelles | 1.00000 |
| 66 | Singapore | 1.00000 |
| 67 | Slovakia | 1.00000 |
| 68 | Slovenia | 1.00000 |
| 69 | Spain | 1.00000 |
| 70 | Sri Lanka | 1.00000 |
| 71 | Switzerland | 1.00000 |
| 72 | Timor-Leste | 1.00000 |
| 73 | Turkmenistan | 1.00000 |
| 74 | Türkiye | 1.00000 |
| 75 | Ukraine | 1.00000 |
| 76 | Uruguay | 1.00000 |
| 77 | Senegal | 1.00192 |
| 78 | Australia | 1.01515 |
| 79 | Ghana | 1.09635 |
| 80 | Bahrain | 1.13312 |
| 81 | Burundi | 1.18538 |
| 82 | Côte d'Ivoire | 1.19238 |
| 83 | Nauru | 1.27215 |
| 84 | Malta | 1.55024 |
| 85 | Algeria | 1.91498 |
Limits to keep in mind
- This is a 2023 cross-section. It does not show whether the gender gap narrowed or widened over time.
- Only 85 countries and areas have reported values in this dataset. Missing observations must not be treated as zero or parity.
- A value of 1 does not indicate the absolute size of vocational participation. It only indicates equal female and male indicator values.
- Values above 1 are adjusted. They should not be read as direct female-to-male multiples.
- The index does not explain country differences. Programme structure, enrolment scale, fields of study, and policy factors require separate evidence.
Source and calculation
The country and area values come from the UNESCO Institute for Statistics GTVP.5.V.GPIA indicator for 2023. The 85 published GPIA values were used directly. No missing observation was filled and no country-level value was altered.
The summary statistics were calculated from those 85 observations. The unweighted mean is 0.975, the median is 1.000, 66 observations fall within 0.97–1.03, 12 fall below that band, and 7 are above it. Interpretation of the scale follows the UIS adjusted parity-index method.
Key takeaways
In 2023, 60 of 85 reported countries and areas had a GPIA of exactly 1.00000 for the vocational share of short-cycle tertiary education, and 66 were within the broader 0.97–1.03 parity band. Bermuda had the lowest value at 0.18838 and Algeria the highest at 1.91498.
The indicator is most useful for identifying where the female and male vocational shares differ, not for ranking the size or quality of vocational education systems. Keeping the adjusted formula and the distinction between relative parity and absolute participation in view prevents the most common misinterpretations.
Frequently Asked Questions
What does a GPIA of 1 mean?
It means the female and male values of the indicator are equal. Here, their shares of short-cycle tertiary students enrolled in vocational programmes are equal.
Does a GPIA of 1.5 mean the female share is 50% higher?
No. Values above 1 use the adjusted symmetric formula. An unadjusted female-to-male ratio of 2 becomes a GPIA of 1.5.
Does parity mean vocational participation is high?
No. Parity only means the female and male indicator values are equal. Their absolute vocational shares may both be high or both be low.
Related Maps
Green Map creates custom-edited map images using open geographic data sources such as geoBoundaries, Natural Earth, OpenStreetMap, and government open data.
These maps are edited visual materials, not raw data files, and are provided for education, documents, presentations, and graphic reference.