A state-by-state comparison of 2025 temperatures across the contiguous United States shows a wide spread. Using NOAA National Centers for Environmental Information (NCEI) nClimDiv monthly mean temperatures, the arithmetic mean of the 12 published monthly values is highest in Florida at 72.3°F and lowest in North Dakota at 42.0°F. The gap between those two state summaries is about 30.3°F.
The calculation needs a precise label. It is the arithmetic mean of 12 monthly mean temperatures, with each month receiving the same weight. It is not exactly the same as a daily-weighted annual mean because a 31-day month and a 28-day month each contribute one monthly value to the final calculation. That distinction can create small differences from an annual statistic calculated directly from every day of the year.
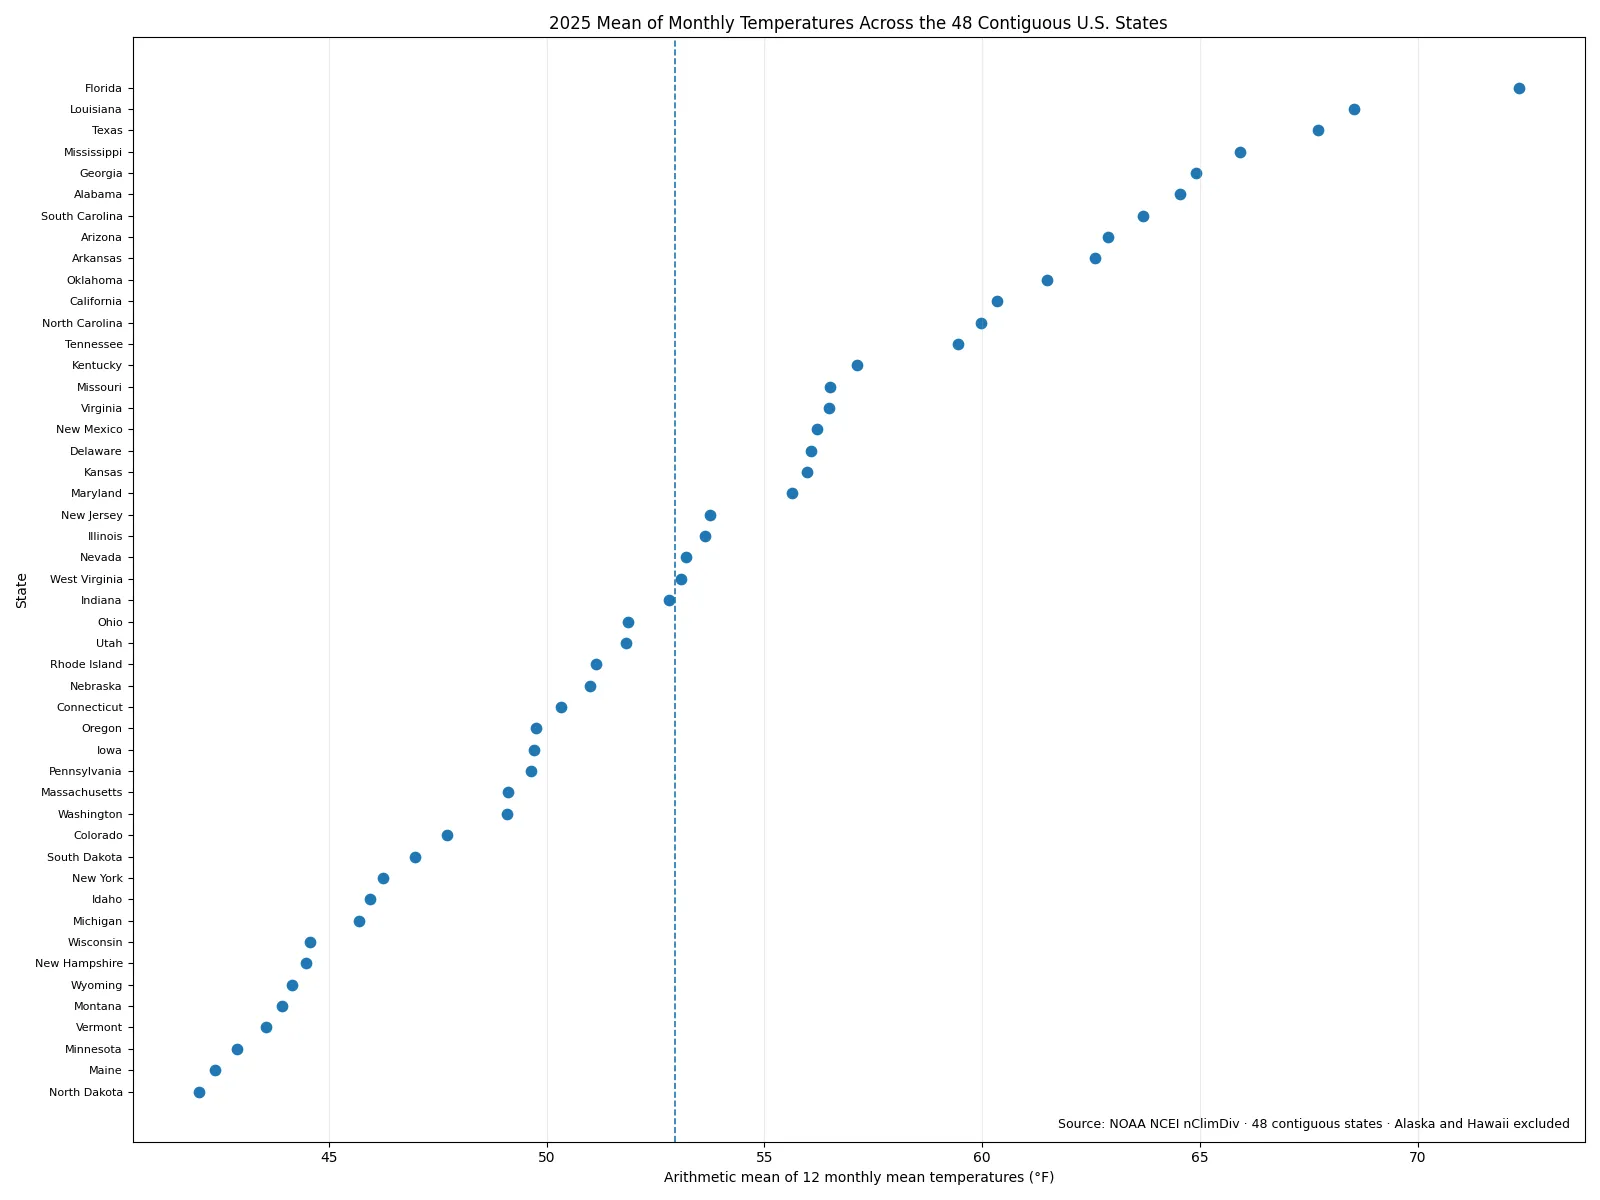
Table of Contents
What the 2025 state values measure
The dataset covers the 48 contiguous states, so Alaska and Hawaii are outside this comparison. Each state contributes one observation. The state values are not weighted by land area or population, which means the simple average across all 48 states should not be described as the temperature of the United States as a whole. Texas and Rhode Island count equally in that summary even though their areas and populations differ greatly.
The values also describe one year rather than a climate normal. Climate normals generally summarize a multi-decade reference period and are designed to describe typical conditions. This analysis instead answers a narrower question: how did the 48 state-level monthly-temperature summaries compare in 2025? It cannot by itself establish a long-term warming trend, identify an unusual year relative to history, or project future climate.
NOAA reports the source values in degrees Fahrenheit. All rankings and statistics below use those values directly. No missing state value was replaced with zero, and no state outside the verified 48-row dataset was added. The same source table supports the ranking, distribution, and summary statistics.
Florida is highest and North Dakota is lowest
Florida has the highest 2025 value at 72.3°F. Louisiana follows at 68.5°F, Texas at 67.7°F, and Mississippi at 65.9°F. Those are the only four states at or above 65°F. Georgia is next at 64.9°F, followed by Alabama at 64.6°F and South Carolina at 63.7°F.
At the other end, North Dakota records 42.0°F. Maine is 42.4°F and Minnesota is 42.9°F. Vermont, Montana, Wyoming, New Hampshire, and Wisconsin are also below 45°F. The 30.3°F difference between Florida and North Dakota is a useful measure of the total spread, but it should not be interpreted as the typical temperature difference between every location in those states.
| High rank | State | 2025 value |
|---|---|---|
| 1 | Florida | 72.3°F |
| 2 | Louisiana | 68.5°F |
| 3 | Texas | 67.7°F |
| 4 | Mississippi | 65.9°F |
| 5 | Georgia | 64.9°F |
| 6 | Alabama | 64.5°F |
| 7 | South Carolina | 63.7°F |
| 8 | Arizona | 62.9°F |
| 9 | Arkansas | 62.6°F |
| 10 | Oklahoma | 61.5°F |
| Low rank | State | 2025 value |
|---|---|---|
| 1 | North Dakota | 42.0°F |
| 2 | Maine | 42.4°F |
| 3 | Minnesota | 42.9°F |
| 4 | Vermont | 43.6°F |
| 5 | Montana | 43.9°F |
| 6 | Wyoming | 44.1°F |
| 7 | New Hampshire | 44.5°F |
| 8 | Wisconsin | 44.6°F |
| 9 | Michigan | 45.7°F |
| 10 | Idaho | 45.9°F |
The median is 53.0°F and the distribution is broad
The unweighted mean of the 48 state values is 53.7°F and the median is 53.0°F. The first quartile is 47.5°F and the third quartile is 59.6°F, so the middle half of the state observations lies roughly between those two values. Because the mean and median are close, the center of the distribution is fairly stable even though the full range is large.
Eight states fall below 45°F, while 10 are between 45 and 49.9°F. Another 10 are between 50 and 54.9°F, nine are between 55 and 59.9°F, seven are between 60 and 64.9°F, and four are at or above 65°F. In total, 18 states are below 50°F and 11 are at or above 60°F. These counts show that the ranking is not divided into only a warm group and a cold group; there is a substantial middle range.
| Arithmetic-mean range | States | Share of 48 |
|---|---|---|
| Below 45°F | 8 | 16.7% |
| 45–49.9°F | 10 | 20.8% |
| 50–54.9°F | 10 | 20.8% |
| 55–59.9°F | 9 | 18.8% |
| 60–64.9°F | 7 | 14.6% |
| 65°F or higher | 4 | 8.3% |
Higher values cluster in the South, with important exceptions
The highest-ranked states include a strong southern concentration: Florida, Louisiana, Texas, Mississippi, Georgia, Alabama, South Carolina, Arkansas, and Oklahoma all appear near the top. Arizona is also in the top 10. The low end includes northern Plains and Upper Midwest states such as North Dakota, Minnesota, and Wisconsin; northeastern states such as Maine, Vermont, and New Hampshire; and interior western states such as Montana and Wyoming.
That spatial pattern is descriptive, not causal. Latitude, elevation, proximity to oceans, terrain, atmospheric circulation, and many other factors can influence temperature, but those explanatory variables are not contained in this 48-row table. The data directly support statements about state values and their geographic distribution. Explaining why one state is warmer than another requires additional evidence.
A state average also hides substantial local variation. A large state can contain coastlines, mountains, plateaus, valleys, deserts, or several climate zones. The value used here does not mean that every city or county in a state experienced that temperature. It is a state-level summary built from NOAA’s monthly state values and is best used for broad comparison rather than local weather decisions.
Similar annual summaries can hide very different seasons
Two states can have similar arithmetic means of their 12 monthly temperatures while experiencing very different seasonal cycles. A state with a cold winter and hot summer can finish near the same annual summary as a state with milder temperatures throughout the year. Compressing 12 months into one number removes information about seasonality, extremes, and the timing of warm or cold periods.
California, for example, has a 2025 value of 60.4°F, well below Florida’s 72.3°F but still in the warmer part of the state distribution. Tennessee is 59.4°F, North Carolina is 60.0°F, and Virginia is 56.5°F. Those single-number comparisons are useful for ranking, but they cannot show whether differences emerged mainly in winter, summer, or throughout the year. A month-by-month series is required for that question.
Complete ranking of all 48 contiguous states
The table below sorts every state from highest to lowest. Displayed values are rounded to one decimal place for readability, while the ranking and summary statistics were calculated from the full-precision values in the verified data. States with very similar values can therefore appear almost tied after rounding even when the underlying decimals differ.
| Rank | State | Arithmetic mean of 12 monthly means |
|---|---|---|
| 1 | Florida | 72.3°F |
| 2 | Louisiana | 68.5°F |
| 3 | Texas | 67.7°F |
| 4 | Mississippi | 65.9°F |
| 5 | Georgia | 64.9°F |
| 6 | Alabama | 64.5°F |
| 7 | South Carolina | 63.7°F |
| 8 | Arizona | 62.9°F |
| 9 | Arkansas | 62.6°F |
| 10 | Oklahoma | 61.5°F |
| 11 | California | 60.4°F |
| 12 | North Carolina | 60.0°F |
| 13 | Tennessee | 59.4°F |
| 14 | Kentucky | 57.1°F |
| 15 | Missouri | 56.5°F |
| 16 | Virginia | 56.5°F |
| 17 | New Mexico | 56.2°F |
| 18 | Delaware | 56.1°F |
| 19 | Kansas | 56.0°F |
| 20 | Maryland | 55.6°F |
| 21 | New Jersey | 53.8°F |
| 22 | Illinois | 53.6°F |
| 23 | Nevada | 53.2°F |
| 24 | West Virginia | 53.1°F |
| 25 | Indiana | 52.8°F |
| 26 | Ohio | 51.9°F |
| 27 | Utah | 51.8°F |
| 28 | Rhode Island | 51.1°F |
| 29 | Nebraska | 51.0°F |
| 30 | Connecticut | 50.3°F |
| 31 | Oregon | 49.8°F |
| 32 | Iowa | 49.7°F |
| 33 | Pennsylvania | 49.6°F |
| 34 | Massachusetts | 49.1°F |
| 35 | Washington | 49.1°F |
| 36 | Colorado | 47.7°F |
| 37 | South Dakota | 47.0°F |
| 38 | New York | 46.2°F |
| 39 | Idaho | 45.9°F |
| 40 | Michigan | 45.7°F |
| 41 | Wisconsin | 44.6°F |
| 42 | New Hampshire | 44.5°F |
| 43 | Wyoming | 44.1°F |
| 44 | Montana | 43.9°F |
| 45 | Vermont | 43.6°F |
| 46 | Minnesota | 42.9°F |
| 47 | Maine | 42.4°F |
| 48 | North Dakota | 42.0°F |
What this comparison should not be used to claim
- It is not a daily-weighted annual mean. The 12 published monthly means receive equal weight.
- The 48-state average is not a national temperature. State area and population are not used as weights.
- It is a one-year comparison. It does not replace a multi-decade climate normal or trend analysis.
- It does not describe every location inside a state. Cities, counties, and elevation zones can differ substantially.
- It does not identify causes. Explaining the pattern requires additional geographic and atmospheric variables.
Source and calculation
The underlying values come from the NOAA NCEI nClimDiv monthly mean temperature data for the 48 contiguous states. For each state, the 12 monthly mean temperatures for 2025 were summed and divided by 12. The source unit is degrees Fahrenheit, and the verified table contains one row for each of the 48 states in scope.
The highest and lowest rankings, unweighted mean, median, quartiles, range, interval counts, and full state ranking all come directly from those 48 observations. No article or secondary-source values were merged into the calculations, which keeps the comparison on one consistent geographic and measurement basis.
Key takeaway
Using the arithmetic mean of the 12 published monthly mean temperatures, Florida is the highest of the 48 contiguous states in 2025 at 72.3°F and North Dakota is the lowest at 42.0°F. The median state is 53.0°F, the unweighted state mean is 53.7°F, and the full spread is 30.3°F. Southern states dominate the high end of the ranking, while northern and several interior western states are common near the low end.
The result is most useful as a compact one-year state comparison. It should not be treated as a climate normal, a daily-weighted annual temperature, or evidence for why state temperatures differ. Keeping the exact calculation in view makes the ranking informative without overstating what the source data can support.
Frequently Asked Questions
Which contiguous U.S. state has the highest 2025 value?
Florida ranks highest at 72.3°F when the 12 published monthly mean temperatures are given equal weight and averaged.
Is this the same as NOAA’s annual mean temperature?
Not exactly. This analysis takes a simple arithmetic mean of 12 monthly means, so it does not weight months by their different numbers of days.
Are Alaska and Hawaii included?
No. The verified dataset used here contains the 48 contiguous states only.
Related Maps
Green Map creates custom-edited map images using open geographic data sources such as geoBoundaries, Natural Earth, OpenStreetMap, and government open data.
These maps are edited visual materials, not raw data files, and are provided for education, documents, presentations, and graphic reference.