Download four high-resolution JPG maps of McLean County, Illinois, in one ZIP from this page, then use the article views to compare Bloomington-Normal, the northern I‑55 towns, Le Roy and Heyworth, major streams, lakes, and elevation. Bloomington and Normal form the dominant central urban area, while Hudson, Lexington, and Chenoa extend northward. Downs and Le Roy are southeast of the center, Heyworth and McLean are farther south, and Danvers and Stanford provide western reference points.
The county becomes more interesting when the road map is compared with water and terrain. Mackinaw River crosses the northern part of the county near Lake Bloomington, while Sangamon River, Dawson Lake, Kickapoo Creek, and North Fork Salt Creek occupy the south and southeast. The elevation map reports an actual range of about 184 to 291 meters and a mean near 234 meters. Lower Mackinaw River terrain contrasts with a broad band of higher ground across the south-central and eastern interior.
Table of Contents
Bloomington-Normal connects the I‑55 north with the I‑74 southeast
The county map begins naturally with Bloomington and Normal, which sit together slightly west of the county’s center. I‑55 leaves the urban area toward Towanda, Lexington, and Chenoa in the northeast. I‑74 passes the southern side of Bloomington and continues toward Downs and Le Roy. Route 51 runs north from Normal toward Hudson. These roads make Bloomington-Normal the easiest starting point for locating the rest of McLean County without implying that every town belongs to one continuous urban corridor.
The northern edge has its own set of places and routes. Gridley sits near Route 24, while Chenoa lies farther east where the I‑55 corridor reaches the top of the county. Lexington is south of Chenoa and close to the interstate. Hudson is northwest of Normal, and Towanda fills the space between the Bloomington-Normal area and Lexington. South of the central cities, Heyworth and the community of McLean occupy separate locations, while Le Roy sits much farther east along the I‑74 and Route 150 corridor.
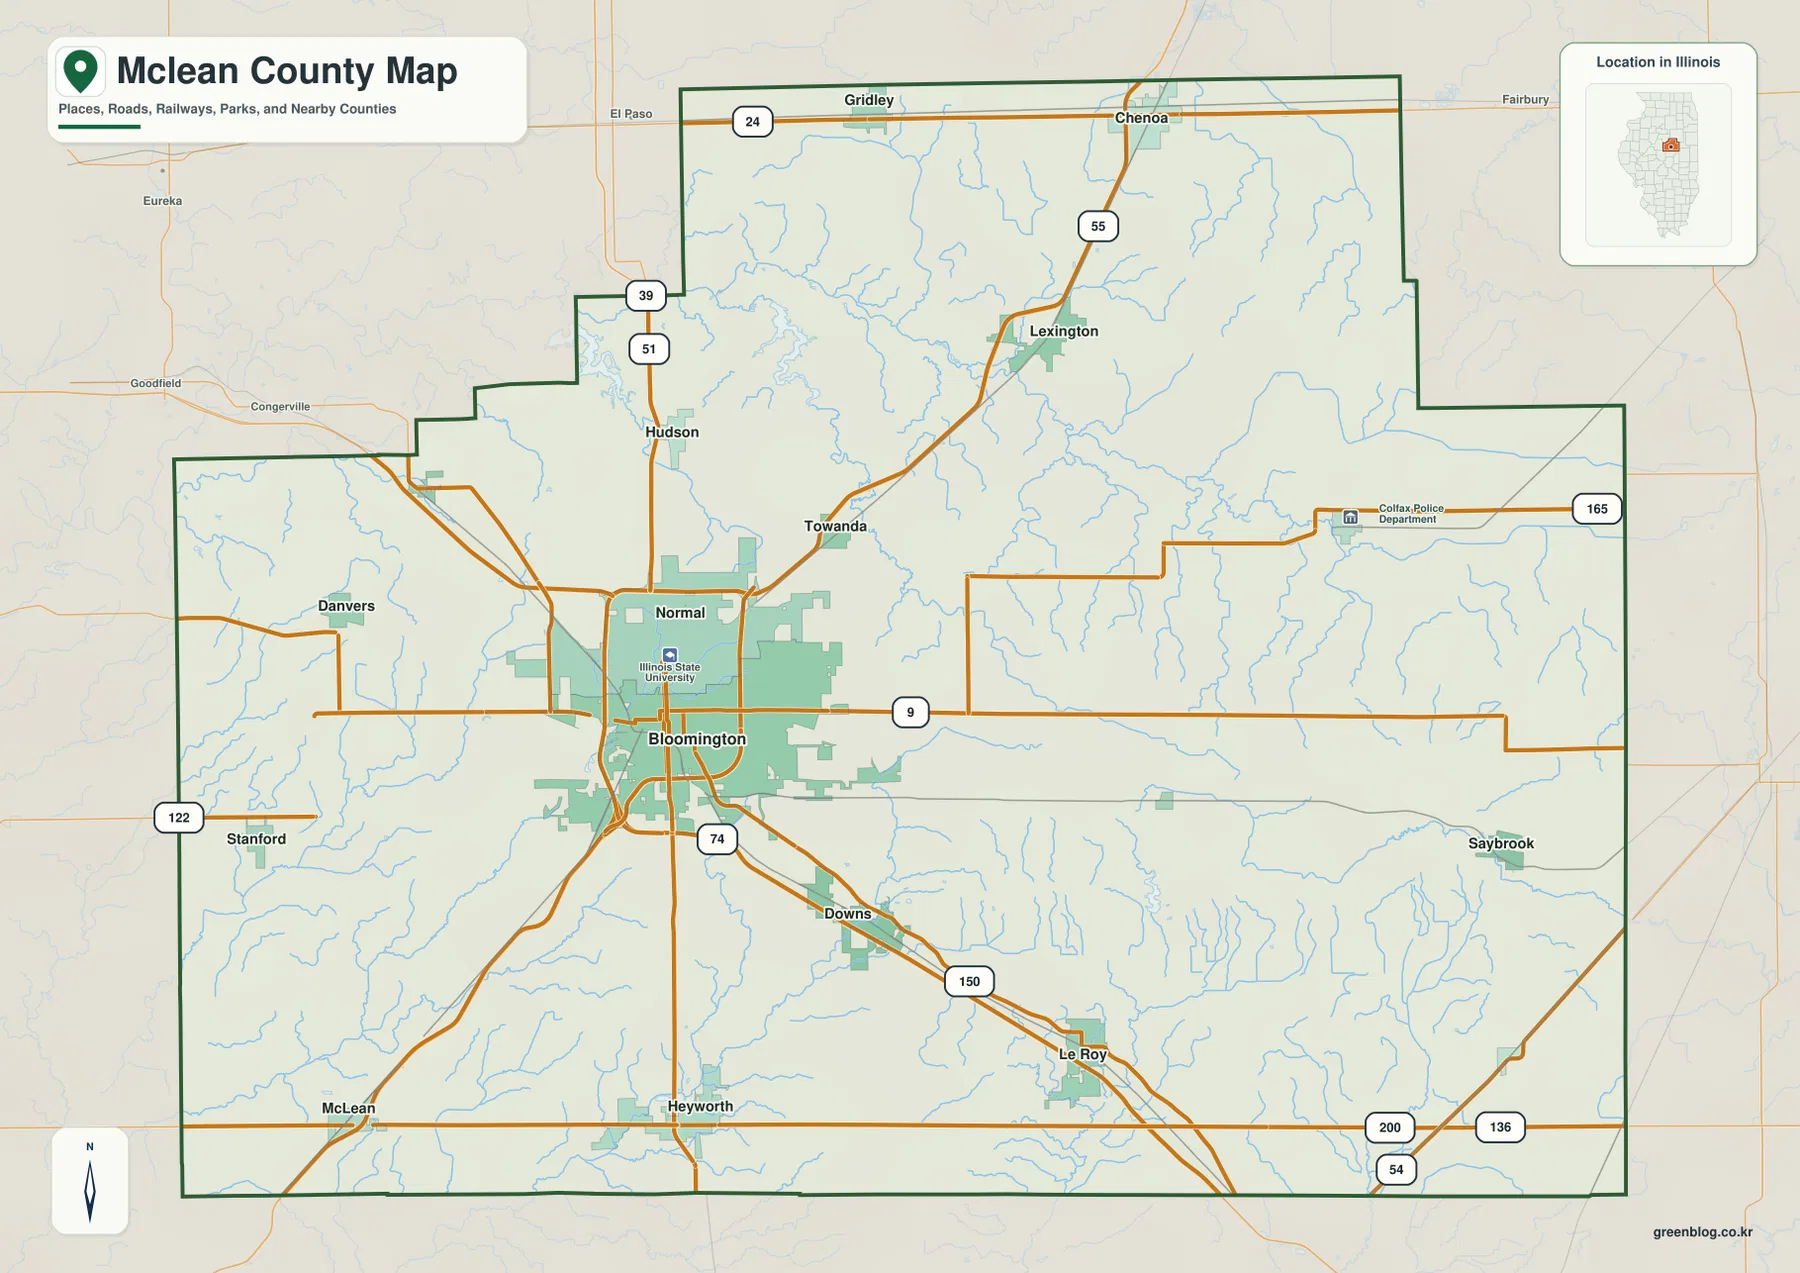
The western and eastern edges are more open. Danvers lies west of Bloomington, and Stanford is near the southwestern boundary. Saybrook is close to the eastern side along the Route 9 direction. Route 24 runs across the northern edge, and Route 136 follows the southern boundary area. The map is meant for geographic orientation rather than live navigation, so driving times, road closures, and current traffic conditions should still be checked with a dedicated road service.
Bloomington and Normal dominate a six-city ranking spread across the county
The ranked city map lists Bloomington at 78,907, Normal at 53,569, Le Roy at 3,236, Heyworth at 2,573, Lexington at 2,126, and Hudson at 1,918. Bloomington and Normal are much larger than the other four highlighted places and appear side by side near the center. Le Roy is well to the southeast, Heyworth is south, Lexington is northeast, and Hudson is north of the central urban area.
That distribution is useful because the population ranking alone does not explain McLean County’s size. Lexington and Hudson represent the northern half, while Le Roy and Heyworth extend the city map far into the southeast and south. On the general county map, Chenoa, Gridley, Downs, Danvers, Stanford, and other labels fill the wide spaces between the six ranked communities. The county therefore has one dominant metropolitan center surrounded by towns that are separated by long stretches of rural land.
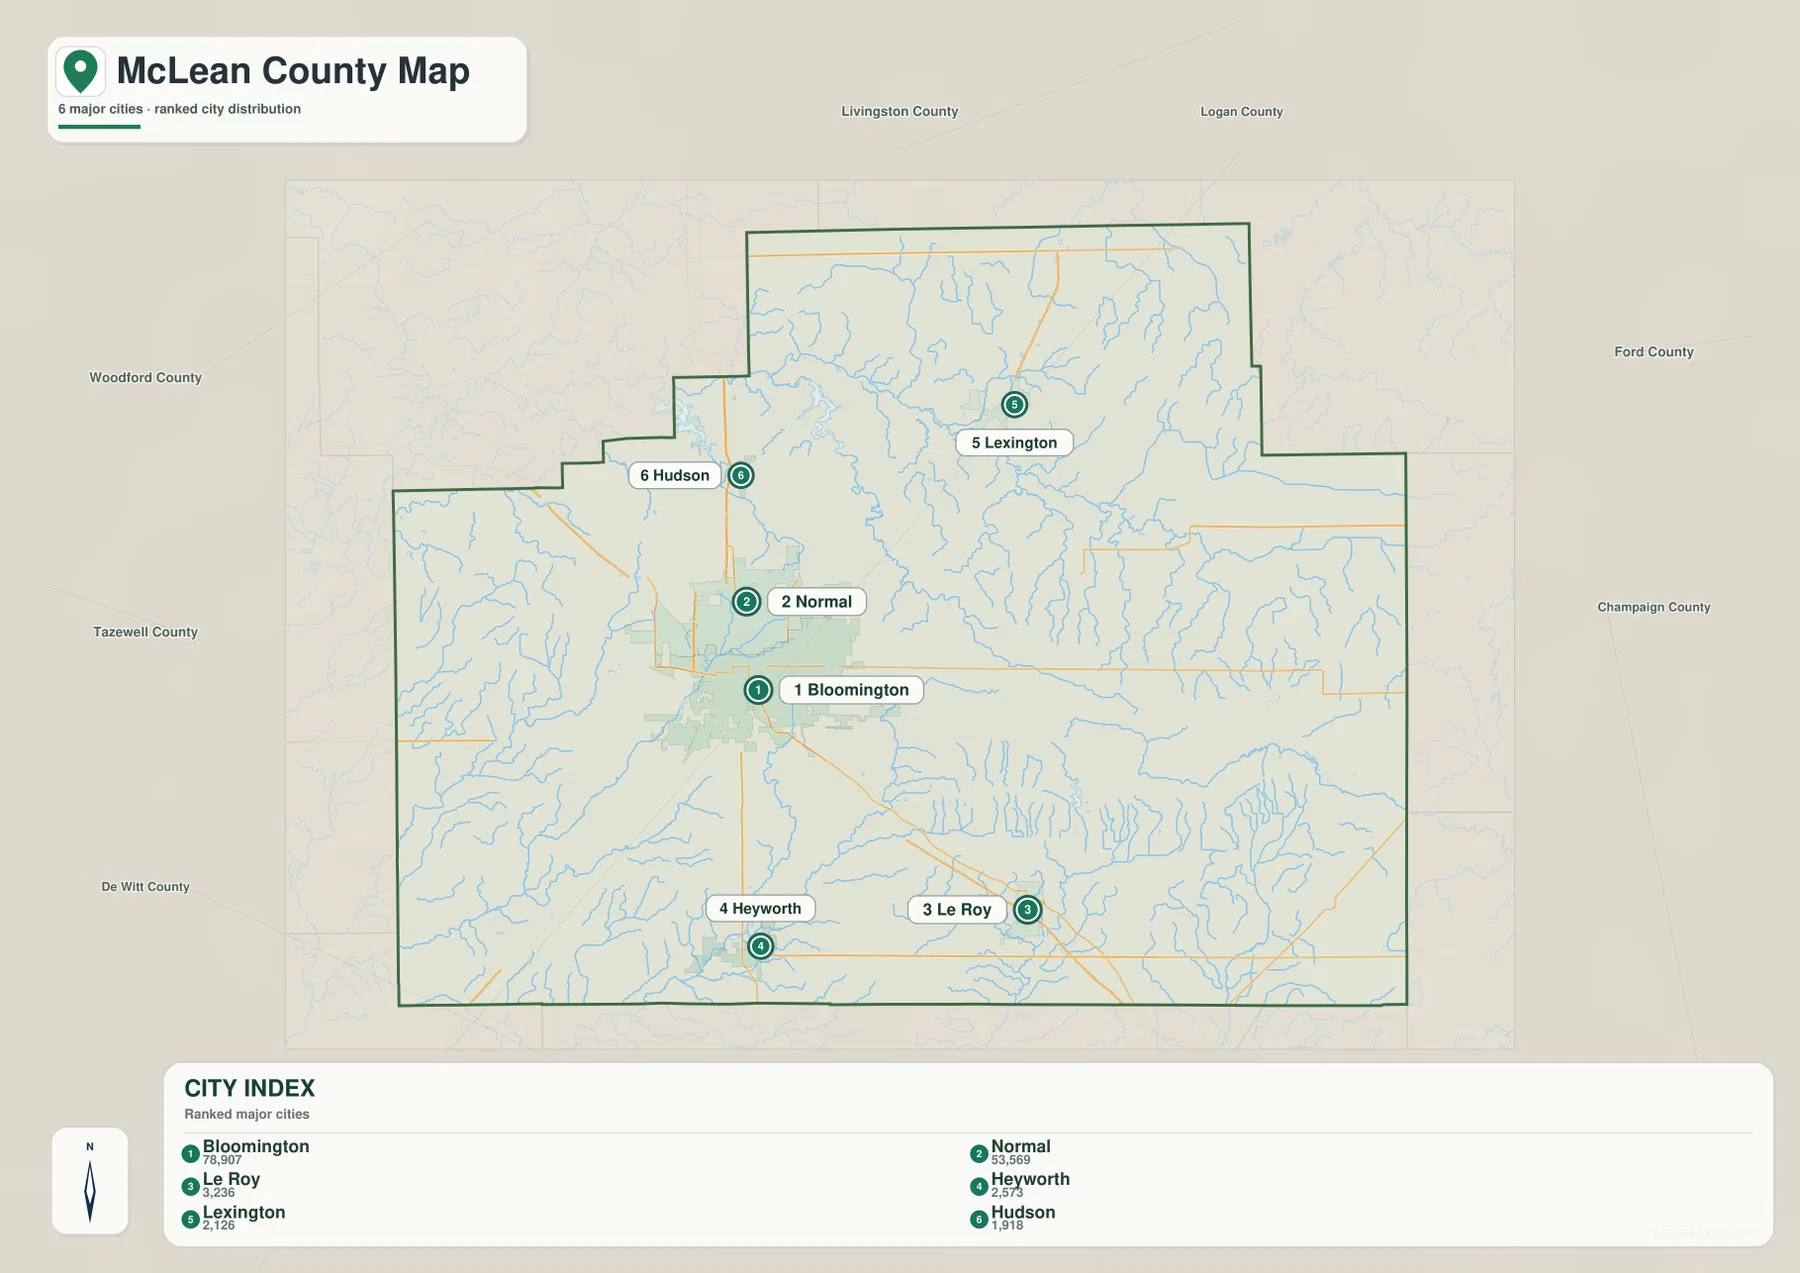
The city map works best when the road details are temporarily ignored. It makes the spacing between the six highlighted places immediately visible. Once a place is located, the county map can answer the transportation question: Le Roy aligns with I‑74 and Route 150, Lexington with I‑55, and Hudson with the Route 51 side of the county. Switching between the two maps keeps population rank and road geography clear instead of crowding both into one view.
Mackinaw River in the north and Sangamon River in the southeast
The terrain and water map is anchored by Mackinaw River across the northern part of McLean County. The river bends through a broad valley before continuing east, with numerous small tributaries entering from both sides. Lake Bloomington sits south of the river in the north-central area and provides an easy landmark between Bloomington-Normal and the northern county line. The Mackinaw corridor is one of the clearest lower areas when compared with the elevation map.
Farther south, the water network changes direction. Money Creek runs through the central-eastern interior, while Kickapoo Creek and Little Kickapoo Creek occupy the southern half. Sugar Creek and Middle Fork Sugar Creek are labeled in the west, with Timber Creek nearby. Sangamon River appears in the southeast along with Dawson Lake and North Fork Salt Creek. These features help separate the southern and eastern drainage areas from the Mackinaw River system in the north.
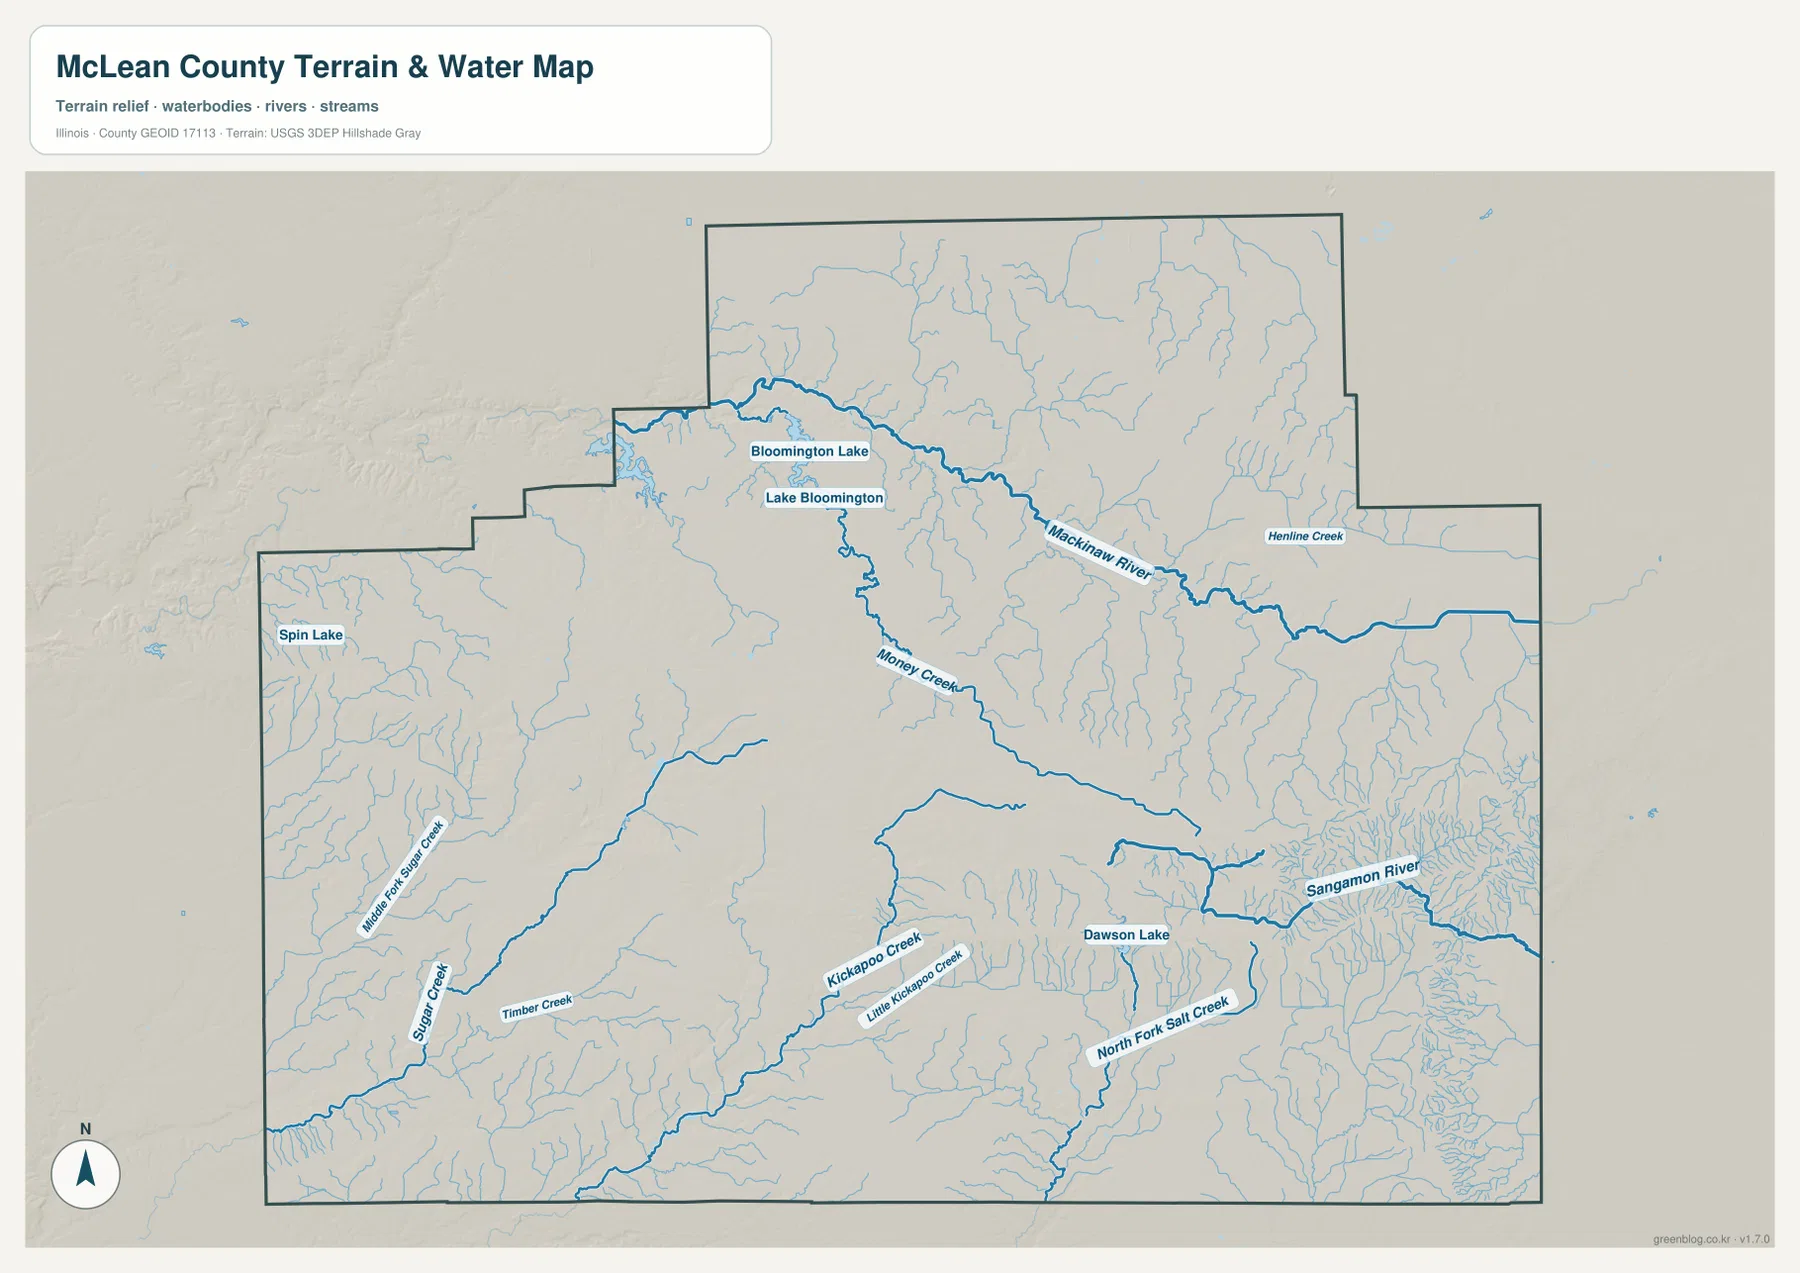
Spin Lake is also labeled in the west, and smaller streams such as Henline Creek appear toward the eastern side. The purpose of this map is to show the relative positions of rivers, creeks, lakes, and terrain. It is not a flood-risk map, legal water-boundary product, navigation chart, or drainage-engineering document. For ordinary geographic comparison, its strongest value is showing how the named waterways align with the lower corridors on the elevation map.
An 184–291 m county with low northern valleys and higher south-central ground
The elevation map reports an actual range of about 184 to 291 meters and a mean near 234 meters. Much of the northern half appears in green and light tones, and Mackinaw River follows a particularly clear lower corridor across the north-central part of the county. Smaller tributary valleys branch away from it, creating a textured surface even where the overall terrain is not especially high.
A broad band of higher tan and brown terrain stretches across the south-central and eastern interior. It begins west of the middle of the county and continues toward the eastern side, broken by narrow stream valleys. The southwest drops again into lower green terrain around Sugar Creek and nearby tributaries. This creates a more complex pattern than a simple north-to-south slope: lower northern river country, higher south-central and eastern ground, and another lower area toward the southwest.
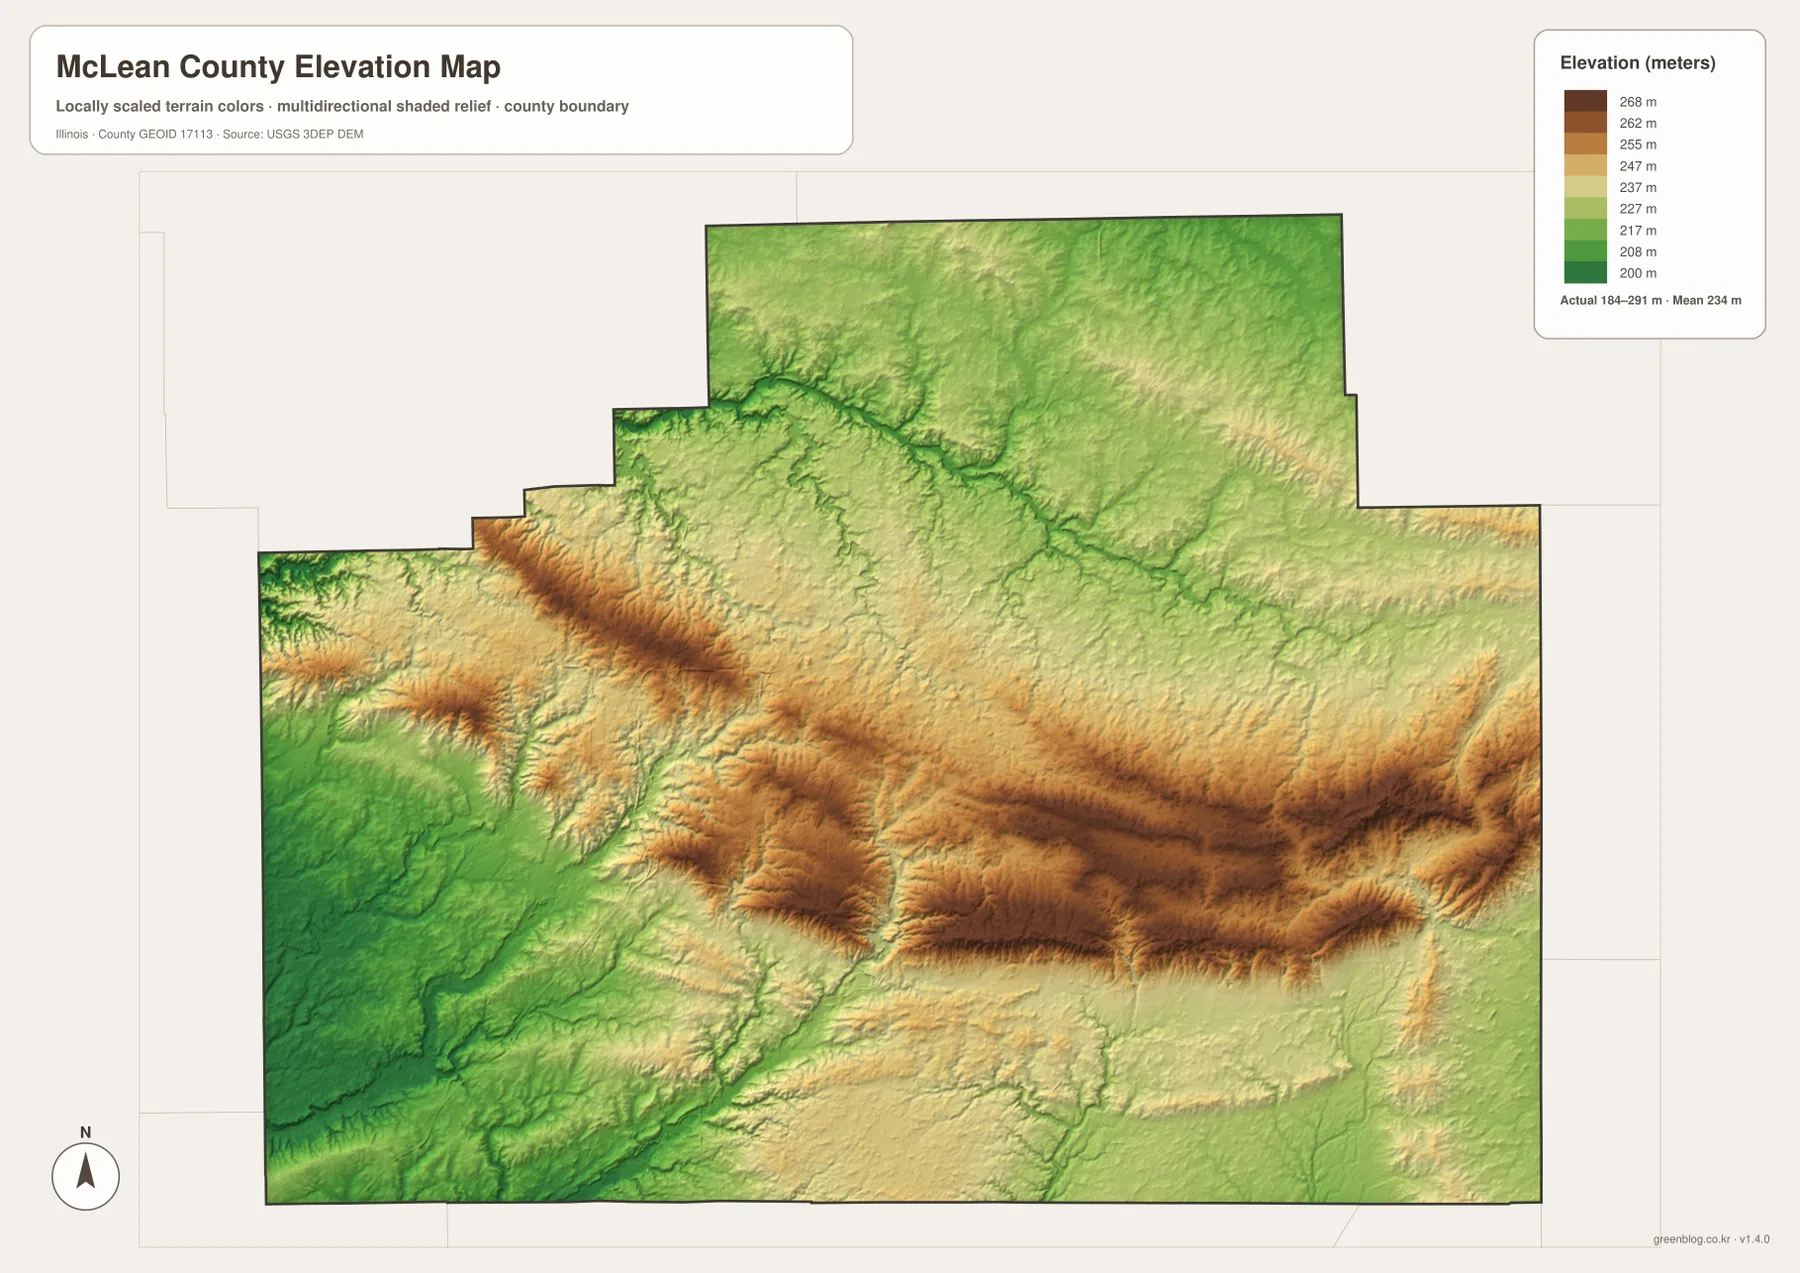
The elevation surface is generalized for county-scale comparison and should not be treated as survey-grade height, parcel elevation, or engineering data. For ordinary map reading, however, it explains the water map well. Mackinaw River, Sugar Creek, Kickapoo Creek, and other waterways follow lower terrain, while the broad ridges between them rise into the tan and brown areas shown on the map.
Follow Bloomington-Normal and Le Roy across roads, water, and elevation
Use the county map when roads, smaller towns, the full boundary, and the Bloomington-Normal urban area matter most. The ranked city map is better for comparing Bloomington, Normal, Le Roy, Heyworth, Lexington, and Hudson without extra labels. The terrain and water map is the clearest source for Mackinaw River, Lake Bloomington, Sangamon River, Dawson Lake, and the major creeks, while the elevation map explains the difference between the northern river valleys and the higher south-central interior.
Bloomington-Normal is a useful place to trace through all four views. The county map shows I‑55, I‑74, Route 51, and Route 9 converging around the urban area, while the city map shows the overwhelming population concentration there. The water map places Lake Bloomington and Mackinaw River to the north and Money Creek and Kickapoo Creek farther south. Le Roy gives a contrasting southeastern example because it sits near the I‑74 corridor, the Sangamon River side of the county, and higher interior terrain.
Frequently Asked Questions
Which map is best for comparing Bloomington, Normal, and Le Roy?
The ranked city map is the quickest comparison. Bloomington and Normal sit together near the center, while Le Roy is well to the southeast. Lexington and Hudson are north of the central pair, and Heyworth is south. Switch to the county map when you also want I‑55, I‑74, Route 51, Route 150, and the smaller communities between the highlighted cities.
Which map shows Mackinaw River and Sangamon River together?
The terrain and water map is the best choice. Mackinaw River crosses the northern part of McLean County, while Sangamon River appears in the southeast. Lake Bloomington, Money Creek, Kickapoo Creek, Dawson Lake, Sugar Creek, and other named features fill the space between them, making the county’s major drainage areas easy to compare.
What files are included in the downloadable ZIP?
The ZIP contains four high-resolution JPG files: the county and road map, ranked city map, terrain and water map, and elevation map. Each image is 3638 × 2572 pixels. Smaller WebP versions are used in the article for faster viewing, while the JPG files are better for close inspection and print. The water and elevation maps are general geographic references rather than flood, legal-boundary, survey, or engineering products.
Map File Information
Download the McLean County county map, ranked city map, terrain and water map, and elevation map together as high-resolution JPG files.
- Included Files: Use only the versions confirmed in the article and supplied images
- File Type: Use the confirmed download contents
- Intended Use: Printing, education, presentations, and map-based projects
Related Maps
Sources and references
- U.S. Census Bureau TIGER/Line Shapefiles – county boundaries, roads, and place reference
- USGS National Hydrography – rivers, creeks, lakes, and other hydrography reference
- USGS 3D Elevation Program – elevation and terrain reference
- McLean County Government – About Us – official county information and local government resources
- Visit Bloomington-Normal – local information for Bloomington-Normal and communities across McLean County
Green Map creates custom-edited map images using open geographic data sources such as geoBoundaries, Natural Earth, OpenStreetMap, and government open data.
These maps are edited visual materials, not raw data files, and are provided for education, documents, presentations, and graphic reference.