Did female and male lower-secondary students have similar public-institution enrolment shares in 2024? UNESCO Institute for Statistics (UIS) indicator ETOIP.2.PU.GPIA is the adjusted gender parity index for the percentage of lower-secondary enrolment in public institutions.
The 2024 extract contains 84 countries and areas. The unweighted mean is 0.962 and the median is 0.953. Only 18 observations fall inside the UIS parity band of 0.97–1.03, while 54 are below 0.97 and 12 are above 1.03.
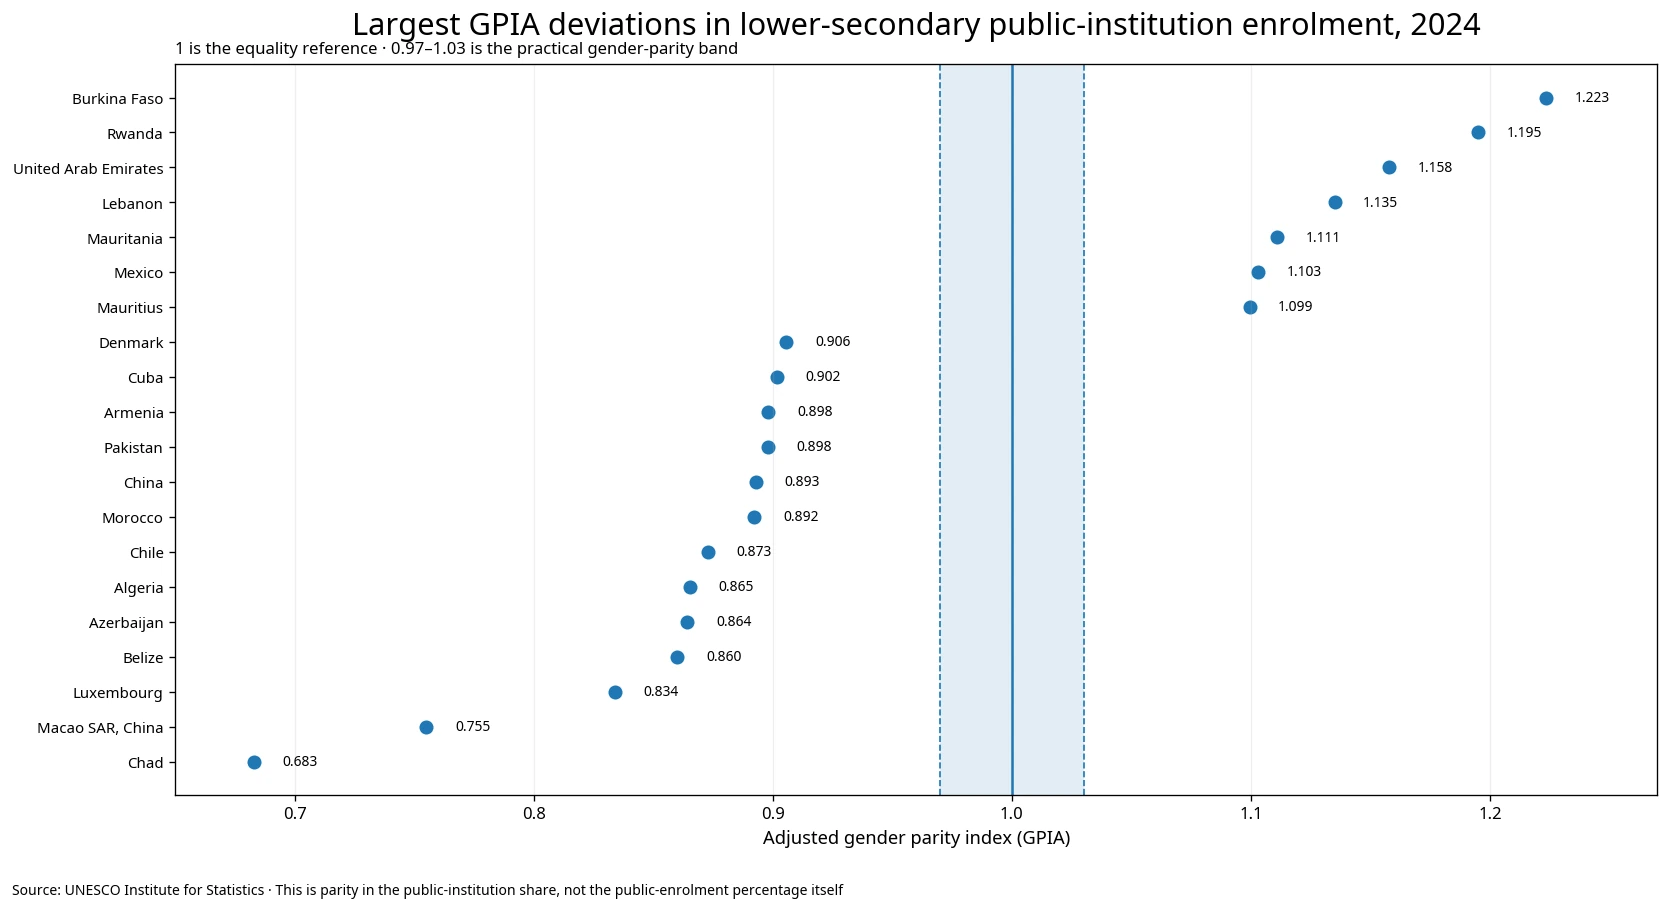
Table of Contents
This is not the female share among students in public schools
The denominator is crucial. The underlying public-institution enrollment measure is the percentage of lower-secondary students enrolled in public institutions. For GPIA, that percentage is calculated separately for female and male students and then compared.
A GPIA of 0.80 therefore does not mean that 80% of students in public lower-secondary institutions are male. It indicates that the public-institution share among female lower-secondary enrollment is lower relative to the corresponding male share.
A value above 1 points in the opposite direction. The index does not reveal the overall public-institution share, the sex-specific percentages, or the number of students. Those base measures require separate indicators.
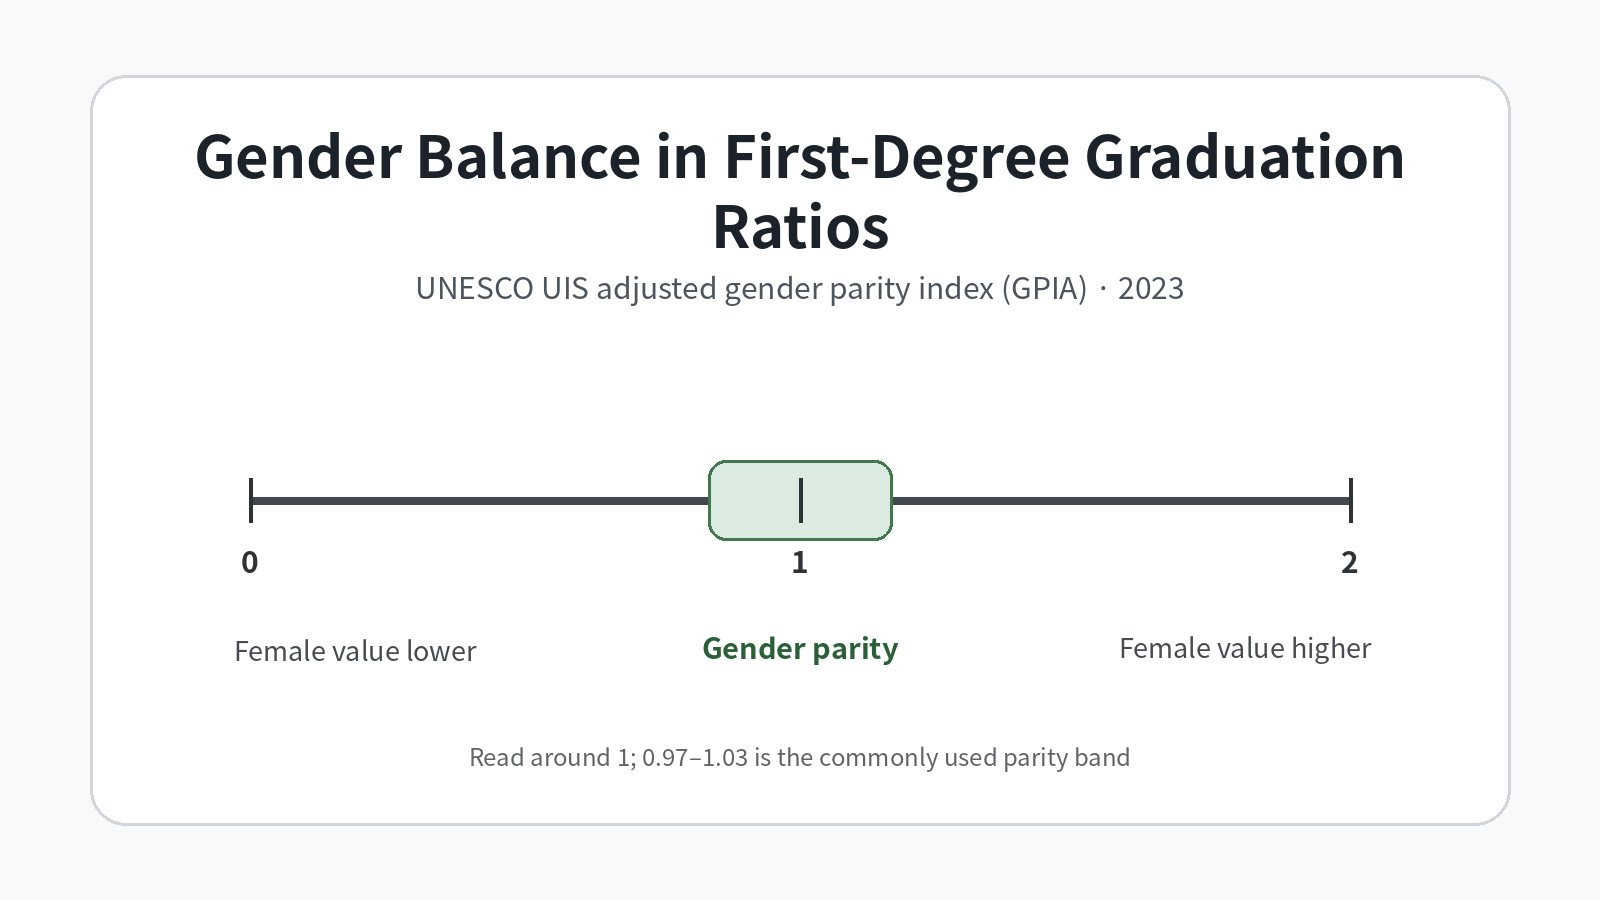
GPIA is centered on 1 and 0.97–1.03 is the practical parity band
The conventional gender parity index divides a female indicator value by the corresponding male value. Equality gives 1. UIS uses an adjusted form so that disparities above and below 1 can be represented more symmetrically within a bounded 0–2 scale.
In this dataset, only 18 of 84 observations fall within 0.97–1.03. There are 68 values below 1 and 16 above 1, with 0 exactly equal to 1.000. The median of 0.953 shows that the center of the country distribution lies below the parity reference.
Because the adjusted transformation changes the scale above 1, a GPIA of 1.20 should not be translated into the claim that the female public-institution share is exactly 20% higher. The safest interpretation is direction and distance from 1.
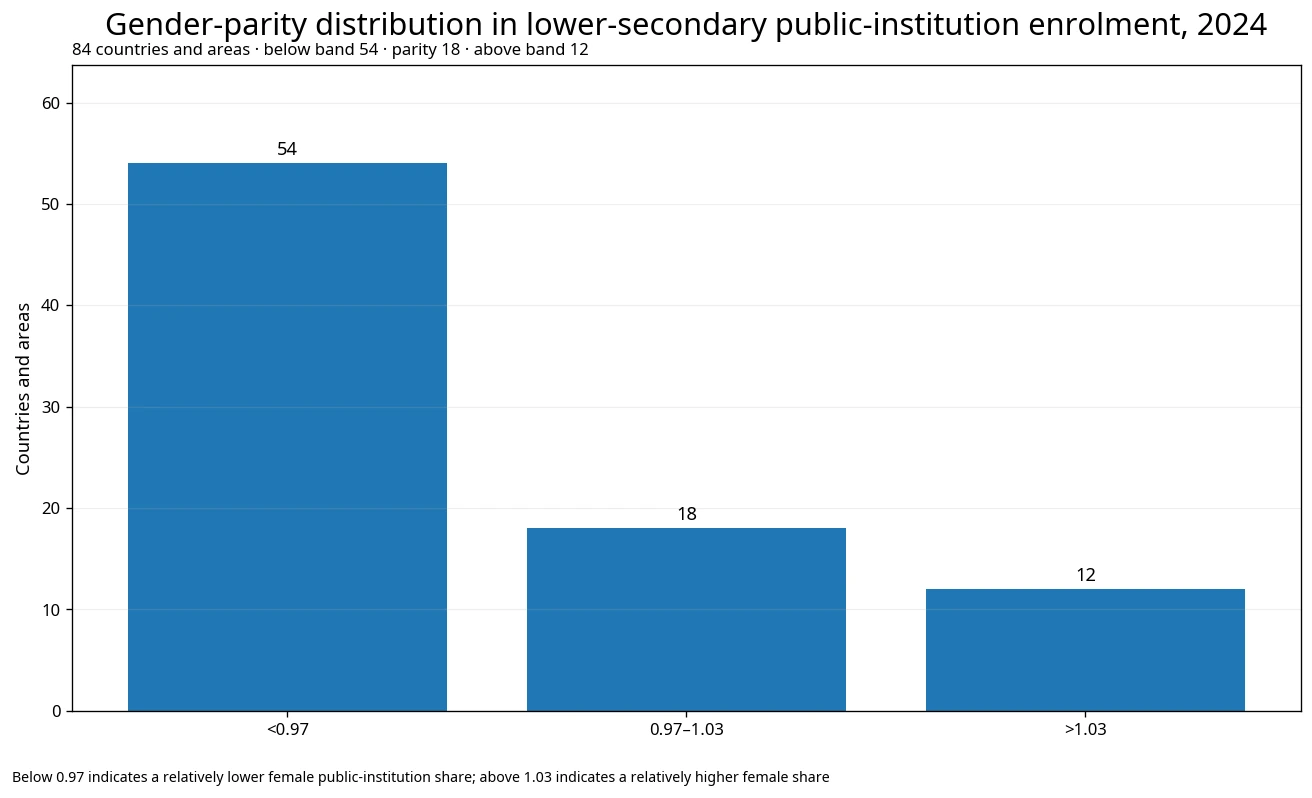
Sixty-six of 84 observations are outside the parity band
Fifty-four observations are below 0.97, indicating a relatively lower female public-institution share, while 12 are above 1.03, indicating a relatively higher female share. The lower side is therefore much more common in this reporting set.
The first quartile is 0.922 and the third quartile is 0.987. Seventeen observations are more than 0.10 away from 1, 6 are more than 0.15 away and 3 are more than 0.20 away. The country mean alone therefore hides a meaningful lower tail and several large high-side deviations.
These summary statistics give every country or area equal weight. A large education system and a small territory each contribute one GPIA value. The mean of 0.962 is not a student-weighted global public-school gender balance.
Chad and Macao are far below parity, while Burkina Faso and Rwanda are far above
The minimum is Chad at 0.683. Macao is 0.755, Luxembourg 0.834, Belize 0.860, Azerbaijan 0.864, Algeria 0.865 and Chile 0.873. These values point toward a lower female public-institution enrollment share relative to the male share.
At the high end, Burkina Faso records 1.223, Rwanda 1.195, the United Arab Emirates 1.158, Lebanon 1.135, Mauritania 1.111 and Mexico 1.103. These observations point toward a relatively higher female public-institution share.
The two sides represent opposite directions, but both are deviations from gender parity. The index should therefore not be ranked as if higher were always better or lower were always worse.
The overall size of public education and gender parity are different questions
A GPIA close to 1 does not mean that public institutions account for a large share of lower-secondary enrollment. Female and male public-institution shares could both be low but similar, producing an index near 1.
Likewise, a system in which public institutions enroll most lower-secondary students can still have a GPIA away from 1 if the female and male shares differ. The overall public-institution share and the gender balance of that share are separate dimensions.
Policy analysis therefore needs the underlying public-enrollment percentage in addition to GPIA. The parity index describes relative balance, not the scale of the public sector.
Selected observations illustrate the lower, parity and higher zones
The table below is designed to illustrate the three interpretation zones rather than rank education systems. Values below 0.97 are classified as lower female public-institution share, 0.97–1.03 as parity and above 1.03 as higher female share.
| Country / area | 2024 GPIA | Interpretation |
|---|---|---|
| Chad | 0.683 | Female public-institution share lower |
| Macao SAR, China | 0.755 | Female public-institution share lower |
| Luxembourg | 0.834 | Female public-institution share lower |
| Azerbaijan | 0.864 | Female public-institution share lower |
| Algeria | 0.865 | Female public-institution share lower |
| China | 0.893 | Female public-institution share lower |
| Pakistan | 0.898 | Female public-institution share lower |
| Republic of Korea | 0.946 | Female public-institution share lower |
| Mexico | 1.103 | Female public-institution share higher |
| Mauritania | 1.111 | Female public-institution share higher |
| Lebanon | 1.135 | Female public-institution share higher |
| United Arab Emirates | 1.158 | Female public-institution share higher |
| Rwanda | 1.195 | Female public-institution share higher |
| Burkina Faso | 1.223 | Female public-institution share higher |
The Republic of Korea records 0.946, below the 0.97 threshold. This does not mean that 94.6% of lower-secondary students are in public institutions. It indicates that the female public-institution enrollment share is relatively lower than the male share.
Public institutions are classified mainly by control and management
UIS defines a public educational institution as one controlled and managed by a public education authority or government agency, either directly or through a governing body mostly appointed by a public authority.
Public status is therefore not identical to free tuition or a simple funding distinction. Private institutions can receive government subsidies, and public institutions can still involve some household costs. The GPIA should not be turned directly into a measure of household financial burden or public funding.
National public-private structures differ substantially, so the same GPIA can arise in very different institutional contexts. Country-specific explanation requires the underlying sex-specific public-enrollment percentages and national institution classifications.
The causes of the gender gap cannot be identified from GPIA alone
Gender differences in public-institution enrollment shares can be related to school supply, location, fees, private or religious providers, household resources, safety, school choice, and the structure of general and vocational programmes.
ETOIP.2.PU.GPIA does not contain those causal variables. Chad’s low value or Burkina Faso’s high value cannot be attributed to one policy or social condition using the index alone.
A single-year extreme also may not represent a persistent structure. A time series and the underlying female and male public-enrollment shares are needed to determine whether a gap is durable or temporary.
The common 2024 reference year supports comparison but not trend analysis
All 84 observations use 2024, which avoids mixing different national reference years. That makes the cross-country comparison cleaner.
A one-year cross-section cannot show whether gender parity is improving or worsening. Changes in public-private provision or programme classification can alter the indicator over time.
Coverage also should not be described as every country in the world. Countries absent from the extract are not assigned zero or parity values, and all summary statistics use only the reported observations.
Data source and calculation method
Country values come from UNESCO Institute for Statistics indicator ETOIP.2.PU.GPIA, “Percentage of enrolment in lower secondary education in public institutions, adjusted gender parity index (GPIA),” using the 2024 NATIONAL observations in this comparison. The published observations are interpreted as adjusted gender parity values on the 0–2 scale, not as percentage points.
- UNESCO UIS official API — ETOIP.2.PU.GPIA
- UNESCO UIS — adjusted gender parity index methodology
- UNESCO UIS — 0.97–1.03 parity-band explanation
- UNESCO UIS — public educational institution definition
The mean of 0.962, median of 0.953, quartiles and parity-band counts are calculated directly from the 84 non-missing observations. Missing values are not zero-filled, and no female or male public-enrollment percentage is reconstructed from the GPIA. Because map dependency is zero, the featured visuals focus on deviation and distribution rather than forcing a country map.
The strongest conclusion supported by the data is that gender parity in the public-institution share of lower-secondary enrollment was outside the 0.97–1.03 band in 66 of 84 observations in 2024, with the majority of those deviations on the female-lower side. The overall public-sector share, student counts and the causes of the gender differences require additional measures.
Frequently Asked Questions
What does a GPIA of 1 mean here?
It means the female and male percentages of lower-secondary enrolment in public institutions are equal at the parity reference. UIS generally treats 0.97–1.03 as the practical parity band.
Does a GPIA of 0.9 mean 90% of students attend public institutions?
No. GPIA is a relative index comparing female and male public-institution enrollment shares. The actual public-enrollment percentages require separate underlying indicators.
Is a higher GPIA always better?
No. Values below and above 1 indicate opposite directions of gender disparity. Closeness to 1, rather than a high value by itself, indicates parity.
How many 2024 observations are within the parity band?
Eighteen of 84 observations are within 0.97–1.03. Fifty-four are below 0.97 and 12 are above 1.03.
Related Articles
- Lower Secondary General-Programme Share | 120 Countries in 2024
- Primary Teacher Training Gender Parity 2023 | 41 of 80 in Parity Band
- Gender Gap in STEM Share Among Tertiary Graduates 2023 | Women Lower in 99
Green Map creates custom-edited map images using open geographic data sources such as geoBoundaries, Natural Earth, OpenStreetMap, and government open data.
These maps are edited visual materials, not raw data files, and are provided for education, documents, presentations, and graphic reference.