How often do students reach minimum reading proficiency at the end of lower secondary education when they do not speak the test language at home? UNESCO Institute for Statistics (UIS) data for 2022 contain 78 country and area observations for this subgroup. The median is 45.58%. Singapore is highest at 83.08%, followed by Ireland at 83.04%, Canada at 79.76%, and Hong Kong SAR at 76.27%.
The denominator is crucial. This is not the percentage of all lower-secondary students who do not speak the test language at home. The subgroup is selected first, and the indicator then measures the percentage of those students who achieve at least the minimum proficiency level in reading. A value of 50% means roughly half of that language subgroup reaches the minimum reading benchmark.
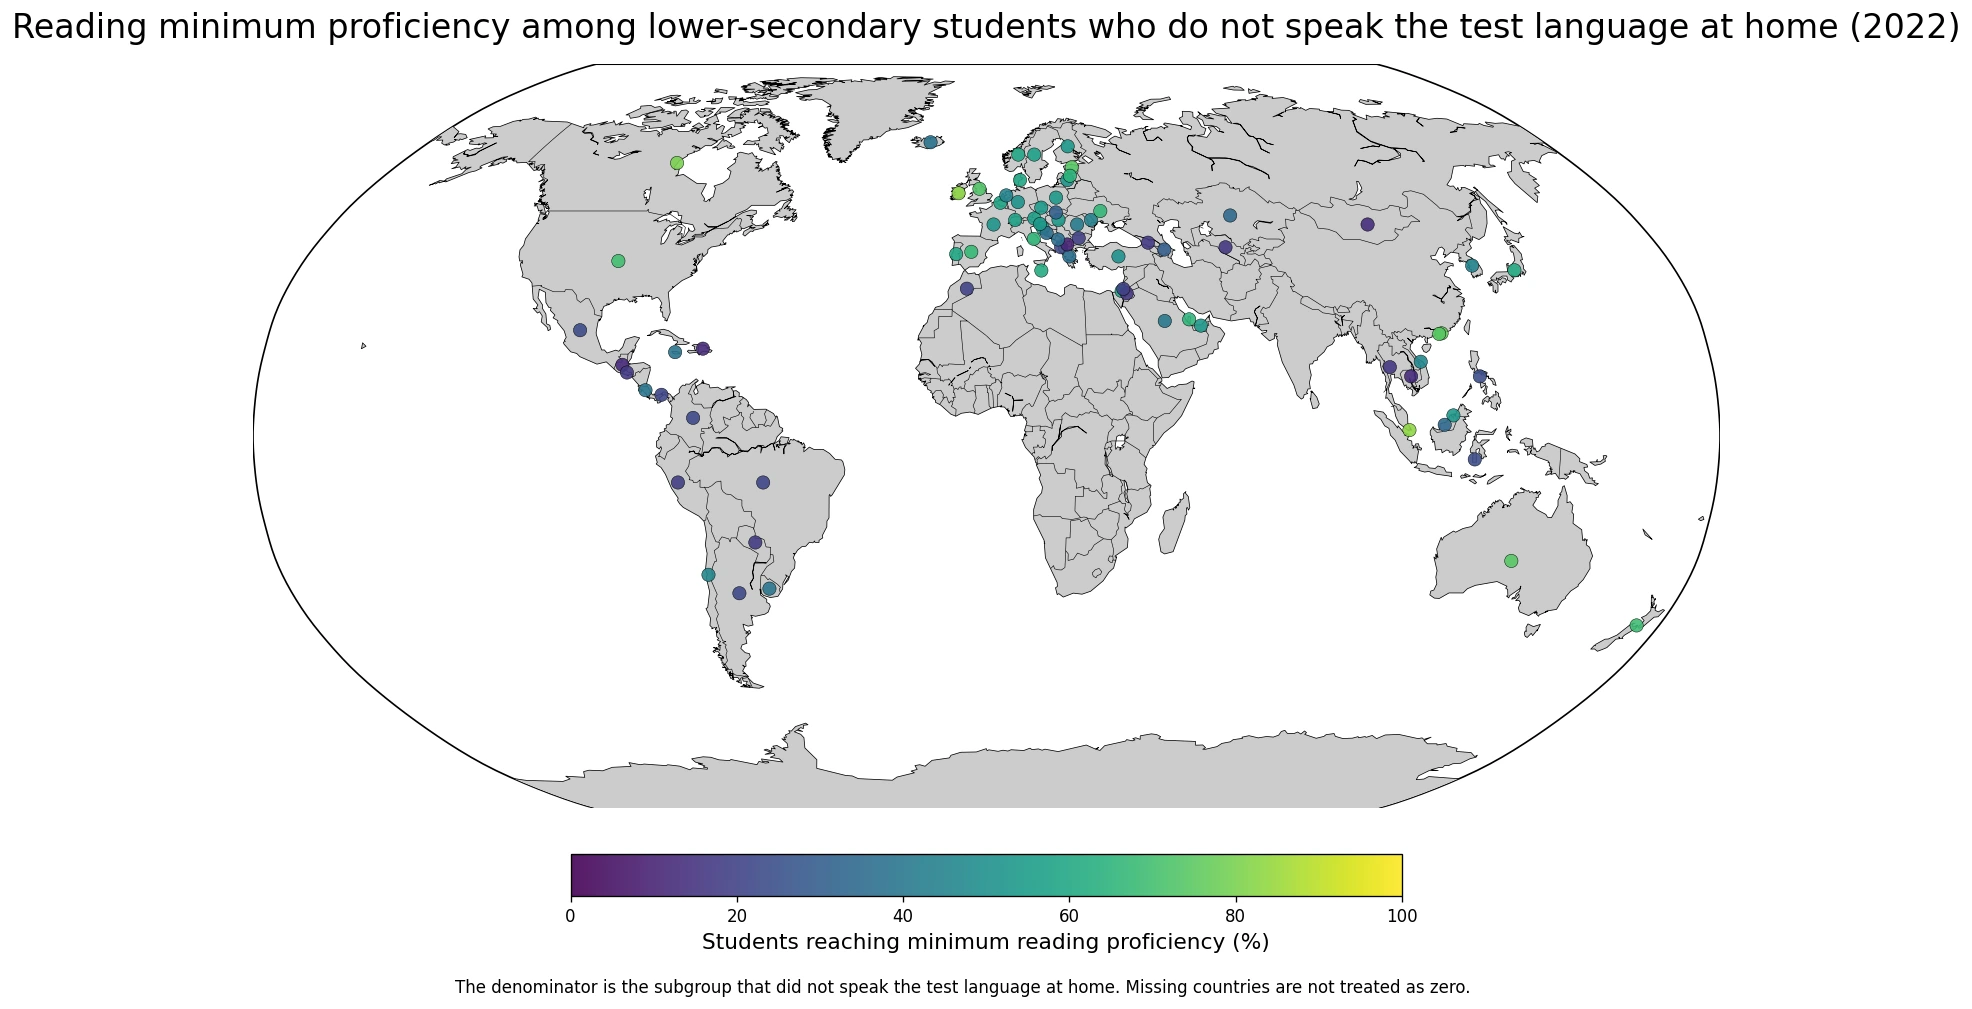
Table of Contents
Singapore and Ireland are above 83%
Singapore records 83.08% and Ireland 83.04%, the only two observations above 80%. Canada is 79.76%, Hong Kong SAR 76.27%, Macao SAR 74.17%, Estonia 74.11%, Australia 74.01%, and the United Kingdom 72.99%. The United States is 69.68% and New Zealand 69.10%.
| Rank | Country or area | Minimum reading proficiency |
|---|---|---|
| 1 | Singapore | 83.08% |
| 2 | Ireland | 83.04% |
| 3 | Canada | 79.76% |
| 4 | China, Hong Kong Special Administrative Region | 76.27% |
| 5 | China, Macao Special Administrative Region | 74.17% |
| 6 | Estonia | 74.11% |
| 7 | Australia | 74.01% |
| 8 | United Kingdom of Great Britain and Northern Ireland | 72.99% |
| 9 | United States of America | 69.68% |
| 10 | New Zealand | 69.10% |
| 11 | Spain | 67.51% |
| 12 | Ukraine | 66.13% |
| 13 | Italy | 65.84% |
| 14 | Qatar | 65.60% |
| 15 | Latvia | 64.46% |
The upper end is not confined to one region or one language system. English-speaking countries appear alongside Singapore, Hong Kong, Macao, and Estonia. The indicator documents subgroup learning outcomes; it does not establish why those outcomes differ. Language support, migration history, socioeconomic background, curriculum, school resources, and selection into the assessed population could all matter.
The median across 78 observations is 45.58%
The median is 45.58% and the unweighted mean is 43.98%. The middle half of the observations lies between 22.30% and 59.45%. 36 observations are at or above 50%, 19 are at or above 60%, 8 reach at least 70%, and only 2 are at or above 80%.
| Minimum proficiency band | Countries or areas | Share of observations |
|---|---|---|
| Below 20% | 15 | 19.2% |
| 20–39.9% | 19 | 24.4% |
| 40–59.9% | 25 | 32.1% |
| 60–69.9% | 11 | 14.1% |
| 70–79.9% | 6 | 7.7% |
| 80% or more | 2 | 2.6% |
15 observations are below 20%. The range therefore extends from just over 10% to more than 83%, showing large cross-country differences in reading outcomes for students whose home-language use does not match the test language category.
North Macedonia, Guatemala, and Cambodia are near the bottom
North Macedonia is lowest at 10.72%. Guatemala and Cambodia are both 11.80%, followed by the Dominican Republic at 12.47% and Mongolia at 12.97%. Jordan, Uzbekistan, Thailand, El Salvador, and Georgia are also below 18%.
| Low-end order | Country or area | Minimum reading proficiency |
|---|---|---|
| 1 | North Macedonia | 10.72% |
| 2 | Guatemala | 11.80% |
| 3 | Cambodia | 11.80% |
| 4 | Dominican Republic | 12.47% |
| 5 | Mongolia | 12.97% |
| 6 | Jordan | 15.71% |
| 7 | Uzbekistan | 16.53% |
| 8 | Thailand | 16.54% |
| 9 | El Salvador | 16.80% |
| 10 | Georgia | 17.28% |
| 11 | Paraguay | 17.84% |
| 12 | Peru | 18.50% |
| 13 | Palestine | 19.36% |
| 14 | Bulgaria | 19.78% |
| 15 | Morocco | 19.98% |
A low percentage indicates substantial difficulty reaching the minimum reading benchmark within this subgroup. It does not prove that language mismatch is the sole cause. Socioeconomic conditions, migration and minority status, school support, assessment participation, and unequal educational opportunities can all contribute.
The home-language category comes from assessment questionnaires
The UIS methodological note on language at home explains how international assessments use questions about how often students speak the test language at home. In assessment systems such as TIMSS, responses can be grouped so that students who always or almost always speak the test language at home are separated from those who speak it only sometimes or never.
This classification is not a complete linguistic profile. Students can live in multilingual households, and the language of a test is not always a perfect description of every classroom’s instructional language. The subgroup should therefore not be treated as one mother-tongue, ethnic, or immigrant category.
Minimum proficiency is a threshold outcome, not an average test score
The SDG 4.1.1 learning-outcome metadata defines reporting around minimum proficiency levels in reading and mathematics at specified education stages. Assessment programmes use different original scales and benchmarks, while UIS reporting maps eligible assessment evidence to the minimum-proficiency concept.
A value of 60% does not mean an average score of 60 points. It means 60% of students in the non-test-language-at-home subgroup reached or exceeded the relevant minimum reading proficiency threshold.
This dataset alone cannot calculate the gap with students who speak the test language at home
READ.LOWERSEC.NONLANGTEST contains the proficiency percentage for one subgroup only. To calculate a language-group gap, the corresponding READ.LOWERSEC.LANGTEST observation would need to be matched for the same country, year, and assessment conditions.
A NONLANGTEST value of 40% does not imply that the other subgroup is 60%. The two indicators are not complementary shares of one whole; each is a proficiency percentage calculated within a different subgroup.
The percentage does not reveal how large the subgroup is
A country can have a high or low proficiency percentage while the number of students who do not speak the test language at home is very different. If that subgroup represents 3% of students in one country and 30% in another, the same 50% proficiency rate affects very different numbers of students.
Planning the scale of language support therefore requires the subgroup population or its share of all students in addition to this outcome percentage. The current indicator is strongest for comparing learning outcomes inside the subgroup.
Cross-country differences should not be reduced to language difficulty
Reading performance can reflect how long students have been exposed to the instructional language, school language support, teacher preparation, curriculum, family resources, migration timing, and many other factors. The linguistic structure of the test language alone cannot explain the country ranking.
Likewise, a high observation does not prove that one policy caused the result. The map identifies where subgroup proficiency is higher or lower and can guide further investigation, but causal interpretation requires additional country-level evidence.
One peer observation sits close to the dataset median
The Republic of Korea records 45.24% in 2022, very close to the 45.58% median across the 78 observations. This is not the reading proficiency rate of all lower-secondary students in Korea. It applies only to students in the subgroup that did not speak the test language at home.
All observations use 2022, but coverage is not universal
All 78 rows use the 2022 reference year, avoiding a mixed-vintage comparison. Coverage remains limited to countries and areas with eligible learning-assessment data and the required home-language information.
The simple mean across countries is not a global student-weighted proficiency rate because each country contributes one row regardless of subgroup size. Countries without a 2022 observation remain missing rather than being assigned zero.
Data scope and source
The analysis uses 78 national-level 2022 observations from the UNESCO Institute for Statistics official API indicator READ.LOWERSEC.NONLANGTEST. The official topic is the proportion of students at the end of lower secondary education achieving at least a minimum proficiency level in reading, restricted to students who did not speak the language of the test at home, both sexes.
The observed range is 10.72% to 83.08%, with a median of 45.58% and an unweighted mean of 43.98%. Rankings, quartiles, and proficiency bands are calculated directly from the supplied values. Missing countries are not converted to zero.
The main takeaway
Singapore has the highest 2022 observation at 83.08%, followed by Ireland at 83.04% and Canada at 79.76%. The median across the 78 available countries and areas is 45.58%, while 15 observations are below 20%. The indicator measures reading proficiency within the subgroup that does not speak the test language at home; it does not measure the subgroup’s share of all students or the proficiency gap with students who do speak the test language at home.
Frequently Asked Questions
Does this indicator show the share of all students who do not speak the test language at home?
No. It first identifies that subgroup and then measures the percentage within the subgroup that reaches at least minimum reading proficiency.
Does a value of 60% mean an average reading score of 60?
No. It means 60% of students in the subgroup reached or exceeded the minimum proficiency threshold in reading.
Can this dataset show the gap with students who speak the test language at home?
Not by itself. The corresponding test-language-at-home proficiency series must be matched for the same country, year, and assessment conditions.
Related Articles
Green Map creates custom-edited map images using open geographic data sources such as geoBoundaries, Natural Earth, OpenStreetMap, and government open data.
These maps are edited visual materials, not raw data files, and are provided for education, documents, presentations, and graphic reference.