UNESCO Institute for Statistics (UIS) data for 2023 show a wide spread in full-time-equivalent researchers per million inhabitants. Across the 76 countries and territories with an observation, the median is 2,038 researchers per million. Liechtenstein is highest at 18,130, followed by the Republic of Korea at 9,472, Sweden at 8,911, Denmark at 8,838, and Finland at 8,315. The minimum is 1.4 in Guatemala.
The indicator is based on full-time equivalents (FTE), not a simple headcount. FTE converts the actual time spent on research and development into full-time researcher units. Two people each spending half of their working time on R&D can therefore add up to roughly one FTE. This makes researcher input more comparable across different working arrangements, but it does not measure research quality, publications, patents, or the amount of R&D funding.
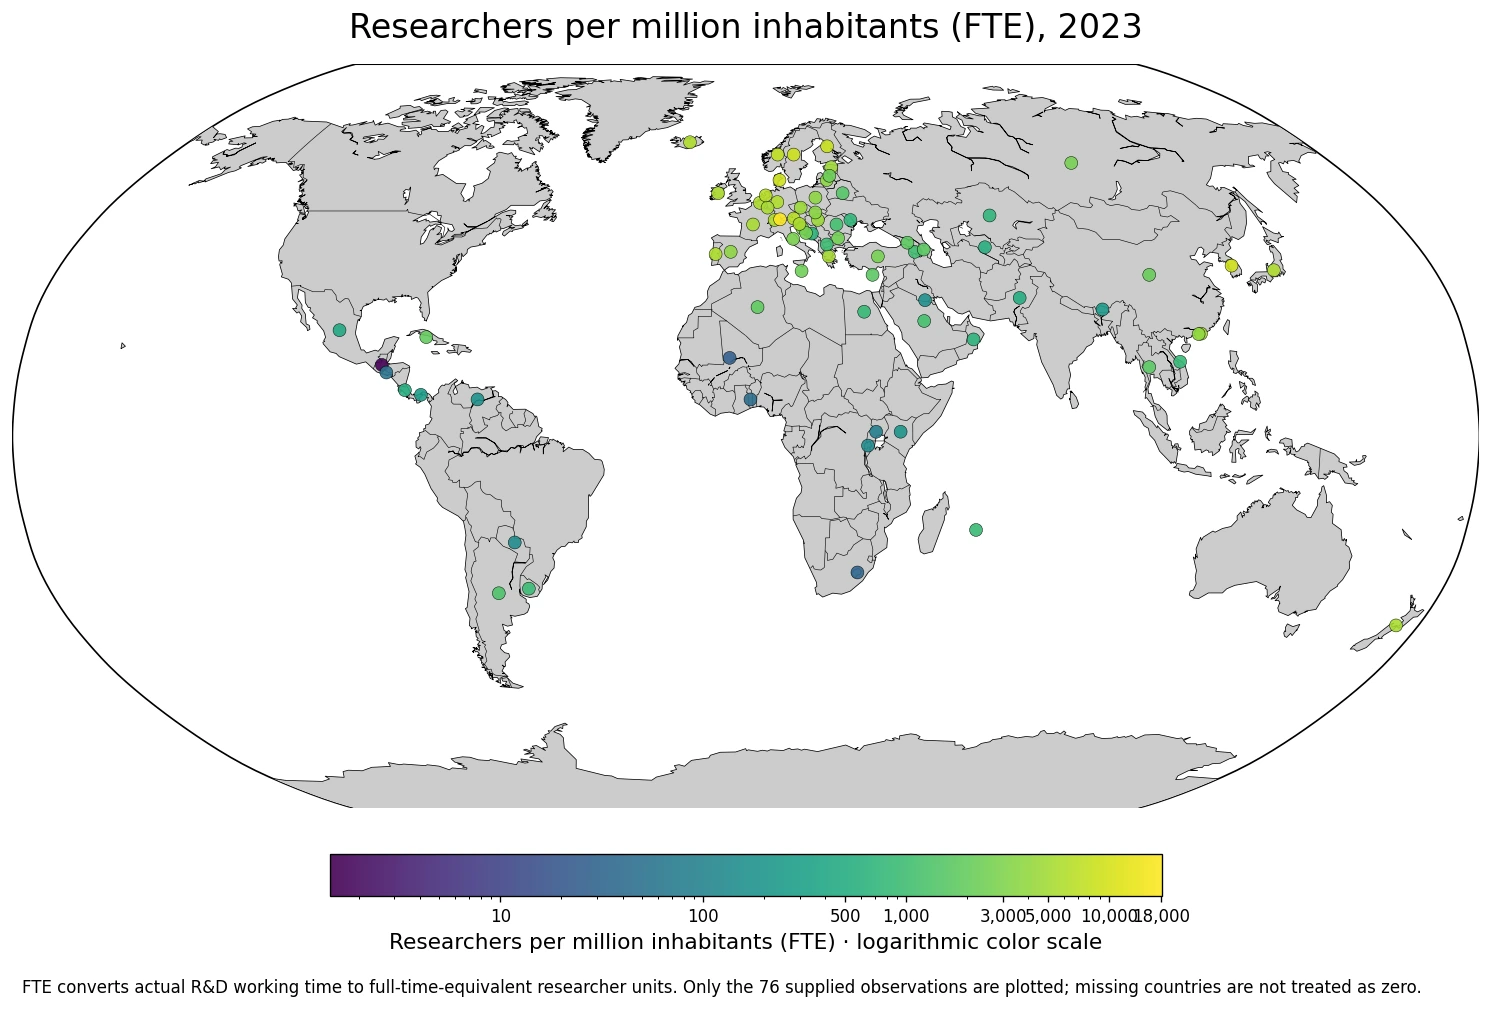
Table of Contents
Liechtenstein is the highest observation, with Nordic countries clustered near the top
Liechtenstein records about 18,130 researchers per million inhabitants, well above every other observation in the dataset. Sweden, Denmark, Finland, and Norway all sit between roughly 7,400 and 8,900. Austria, the Netherlands, Switzerland, Belgium, Portugal, Iceland, Germany, Ireland, and Slovenia also appear among the fifteen highest values.
East Asia and Oceania also provide high-density cases. The Republic of Korea is at 9,472, Japan at 5,609, and New Zealand at 5,435. Because this is a population-normalized density indicator, the ranking can look very different from a ranking of the total number of researchers. A small country with a large research sector can post an exceptionally high per-million figure.
| Rank | Country or territory | Researchers per million inhabitants (FTE) |
|---|---|---|
| 1 | Liechtenstein | 18,130 |
| 2 | Republic of Korea | 9,472 |
| 3 | Sweden | 8,911 |
| 4 | Denmark | 8,838 |
| 5 | Finland | 8,315 |
| 6 | Norway | 7,451 |
| 7 | Austria | 6,634 |
| 8 | Netherlands | 6,563 |
| 9 | Switzerland | 6,108 |
| 10 | Belgium | 5,990 |
| 11 | Portugal | 5,983 |
| 12 | Iceland | 5,953 |
| 13 | Germany | 5,926 |
| 14 | Ireland | 5,753 |
| 15 | Slovenia | 5,616 |
Twenty observations are above 5,000, while twenty-two are below 1,000
21 of the 76 observations are at or above 5,000 researchers per million, and 5 are above 8,000. At the other end, 27 observations are below 1,000. The median of roughly 2,038 shows that the upper group is several times denser in researchers than the middle of the observed distribution.
| Researchers per million (FTE) | Countries or territories | Share of observations |
|---|---|---|
| Below 100 | 7 | 9.2% |
| 100–499 | 9 | 11.8% |
| 500–999 | 11 | 14.5% |
| 1,000–2,999 | 20 | 26.3% |
| 3,000–4,999 | 8 | 10.5% |
| 5,000 or more | 21 | 27.6% |
The middle half of the observations lies between about 666 and 5,302. The mean is 3,020, above the median of 2,038, because Liechtenstein and the countries in the 8,000–9,000 range pull the average upward. For this skewed distribution, the median and the value bands describe a typical observation better than the mean alone.
Researchers per million is a density measure, not a measure of total research workforce
Dividing FTE researchers by population makes it easier to compare countries of very different sizes. A large country can have more researchers in absolute numbers while still having a lower researcher density, whereas a small country can have a smaller total workforce but a high number per million inhabitants.
The normalization also creates a small-country effect. When the population denominator is small, the presence of a few large universities, laboratories, or research-intensive companies can move the per-million value sharply. Liechtenstein’s very high result is therefore informative about research intensity, but its small population should remain part of the interpretation.
A high researcher density does not automatically mean stronger research outcomes
The indicator describes the human-resource base devoted to R&D. It does not directly measure productivity or quality. Countries with similar researcher density can differ in fields of research, university-industry links, R&D expenditure, infrastructure, international collaboration, and the outputs generated by researchers.
A complete research-system comparison would therefore combine researcher density with measures such as R&D expenditure, publications, patents, high-technology activity, or other output indicators. Researchers per million is best understood as one input-side measure: how much research labor is present relative to the population.
Several observations are below 100 researchers per million
Guatemala is lowest at 1.4 researchers per million, followed by Mali at 26.0, Myanmar at 28.0, Lesotho at 32.2, Togo at 41.4, El Salvador at 55.5, and Uganda at 81.3. Rwanda, Paraguay, Kuwait, and Venezuela are in the roughly 100–200 range, while Kenya, Bhutan, and Panama remain below 300.
| Low-end order | Country or territory | Researchers per million inhabitants (FTE) |
|---|---|---|
| 1 | Guatemala | 1 |
| 2 | Mali | 26 |
| 3 | Myanmar | 28 |
| 4 | Lesotho | 32 |
| 5 | Togo | 41 |
| 6 | El Salvador | 55 |
| 7 | Uganda | 81 |
| 8 | Rwanda | 133 |
| 9 | Paraguay | 139 |
| 10 | Kuwait | 159 |
| 11 | Venezuela (Bolivarian Republic of) | 180 |
| 12 | Kenya | 201 |
| 13 | Bhutan | 237 |
| 14 | Panama | 253 |
| 15 | Mexico | 419 |
Low values can indicate a thin research workforce relative to population, but they should not be translated into claims that a country performs no research. National statistical capacity, sector coverage, researcher definitions, and survey practices can also affect reported R&D personnel data. The most defensible statement is that these are low published values for this specific UIS indicator.
Europe forms the clearest high-density cluster on the map
Many of the highest observations are in Northern, Western, and Central Europe. Sweden, Denmark, Finland, and Norway form a prominent Nordic cluster, while Austria, the Netherlands, Switzerland, Belgium, Germany, Ireland, France, Luxembourg, and others also occupy the upper ranges. This concentration is visually clear on the map.
The regional pattern is not uniform, however. Bosnia and Herzegovina is around 670 researchers per million, while high values also appear outside Europe in the Republic of Korea, Japan, and New Zealand. The map is useful for identifying clusters, but explaining them requires separate information about national R&D systems, industrial structure, universities, and policy.
FTE helps account for part-time and mixed research roles
Researchers can work in universities, government institutes, businesses, and other organizations, and not every person classified as a researcher spends all working hours on R&D. FTE adjusts for this by converting actual research time into a full-time basis.
A researcher who spends half of the working year on research can contribute about 0.5 FTE rather than a full unit. That improves comparability between systems with different mixes of part-time, teaching, administrative, and research duties. It does not eliminate every methodological difference, because national surveys can still differ in coverage and implementation.
Only 76 countries and territories have a supplied 2023 observation
The dataset contains 76 countries and territories with a 2023 value. It is not a complete same-year dataset for every country in the world, so the mean and median calculated here should not be described as a precise global average. Countries without a value are left unplotted rather than assigned zero.
R&D statistics can be published on different schedules across countries, which can limit same-year coverage. The map is therefore best read as a comparison of the available 2023 observations. A trend analysis would require multiple years for the same countries to determine whether researcher density is rising or falling.
Data scope and source
The analysis uses 76 national-level 2023 observations from the UNESCO Institute for Statistics official API indicator RESDEN.INHAB.TFTE, titled ‘Researchers per million inhabitants (FTE)’. The values are researchers in full-time-equivalent terms per one million inhabitants. All rankings, averages, medians, and value bands in this article are calculated from the supplied observations.
The map places each country or territory at a representative location and uses color to encode the published value. Because the range runs from about 1.4 to more than 18,000, the map uses a logarithmic color scale. Point size does not represent researcher count, and countries without an observation are not treated as zero.
The main takeaway
The median across the 76 available 2023 observations is 2,038 FTE researchers per million inhabitants. Liechtenstein is the highest at 18,130, and 21 countries and territories are above 5,000. The upper end is dominated by several European systems, with additional high-density cases in East Asia and Oceania. The indicator is a useful measure of research-workforce density, but it should not be confused with total researcher numbers, research spending, or research performance.
Frequently Asked Questions
How is researcher FTE different from a simple researcher headcount?
FTE converts the actual time researchers spend on R&D into full-time-equivalent units. Two people each spending half their time on research can contribute about one FTE in total.
Does a high number of researchers per million guarantee strong research performance?
No. The indicator measures research-workforce density, not publications, patents, R&D spending, research quality, or productivity.
Can small countries have especially high researcher-density values?
Yes. A small population denominator means a few large research institutions or research-intensive firms can produce a very high researchers-per-million value.
Related Articles
Green Map creates custom-edited map images using open geographic data sources such as geoBoundaries, Natural Earth, OpenStreetMap, and government open data.
These maps are edited visual materials, not raw data files, and are provided for education, documents, presentations, and graphic reference.