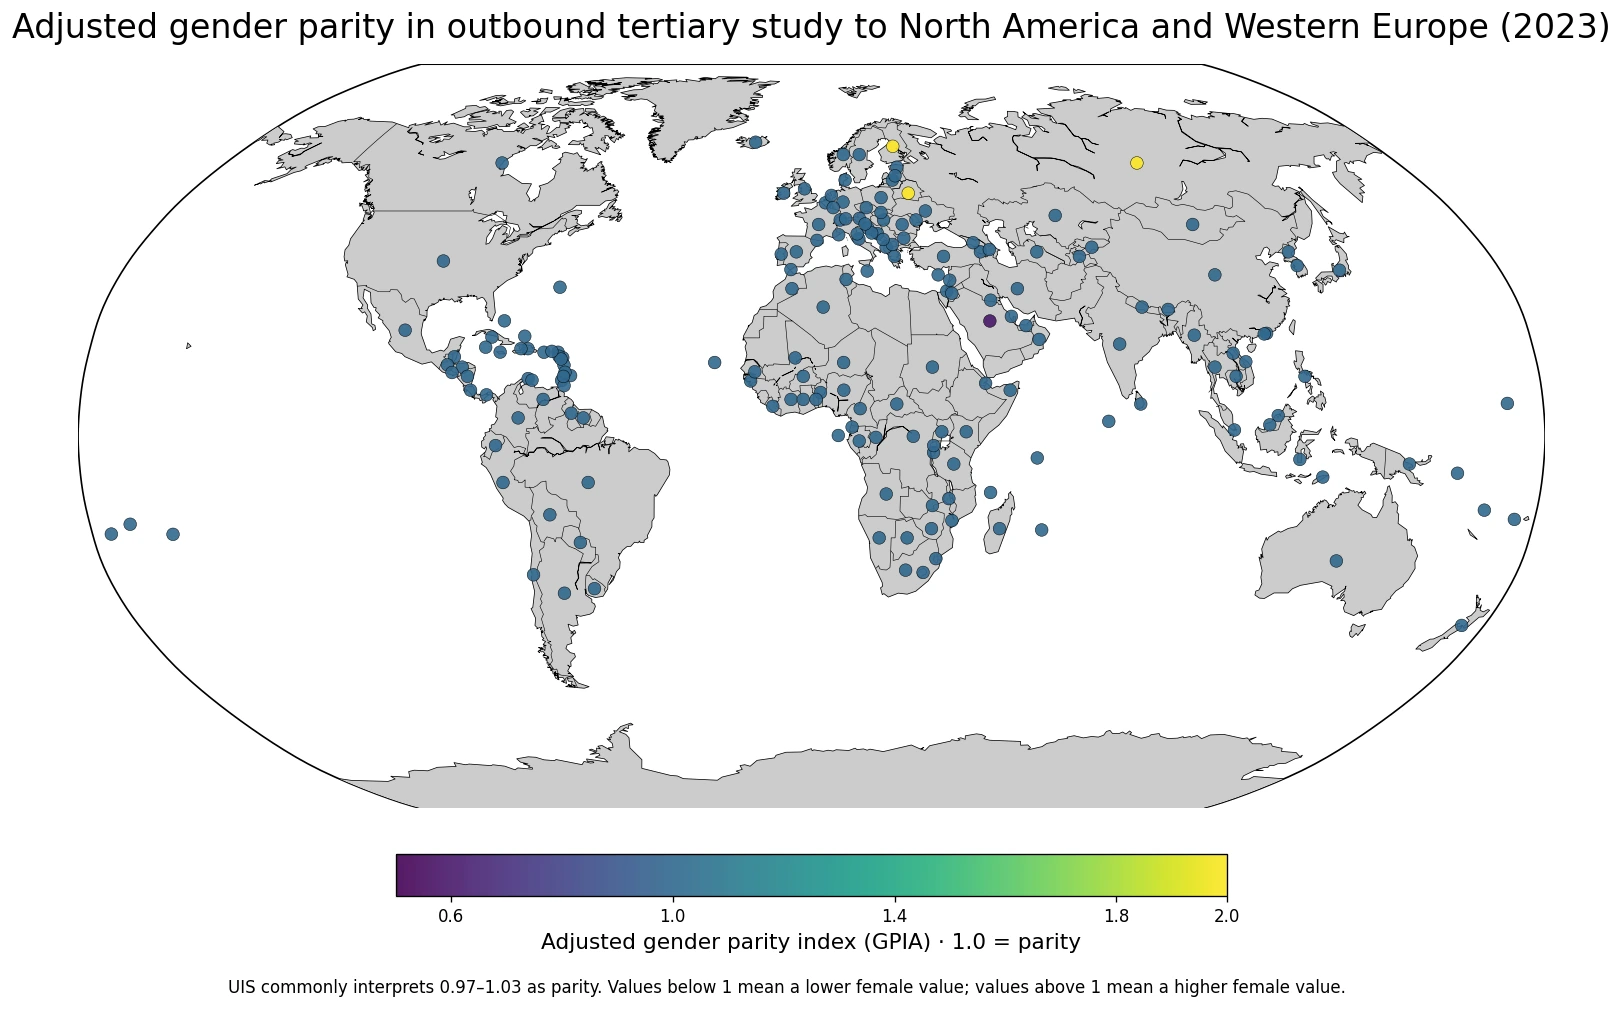
Gender balance in education is not only about how many women and men are enrolled. UNESCO Institute for Statistics (UIS) also compares the expected amount of time each sex would spend in a given level of education if current age-specific participation patterns continued. For post-secondary non-tertiary education, the 2023 adjusted gender parity index summarizes the female-to-male relationship in school life expectancy around a neutral value of 1.
This measure is easy to misread. It is not a percentage, not the number of years in the official curriculum and not an estimate of how long one individual will actually remain in a programme. School life expectancy is an average derived from current enrolment patterns. The adjusted parity index then compresses the relationship between female and male values into a dimensionless scale designed to be symmetric around 1.
The 2023 comparison set contains 87 country or area observations. That coverage can describe where parity is closer or farther from 1 among reporting observations, but the parity index alone cannot rank the overall strength of education systems. Two sexes can have equally short expected participation and still produce a value near 1, while a country with much longer participation overall can still show a gender gap.
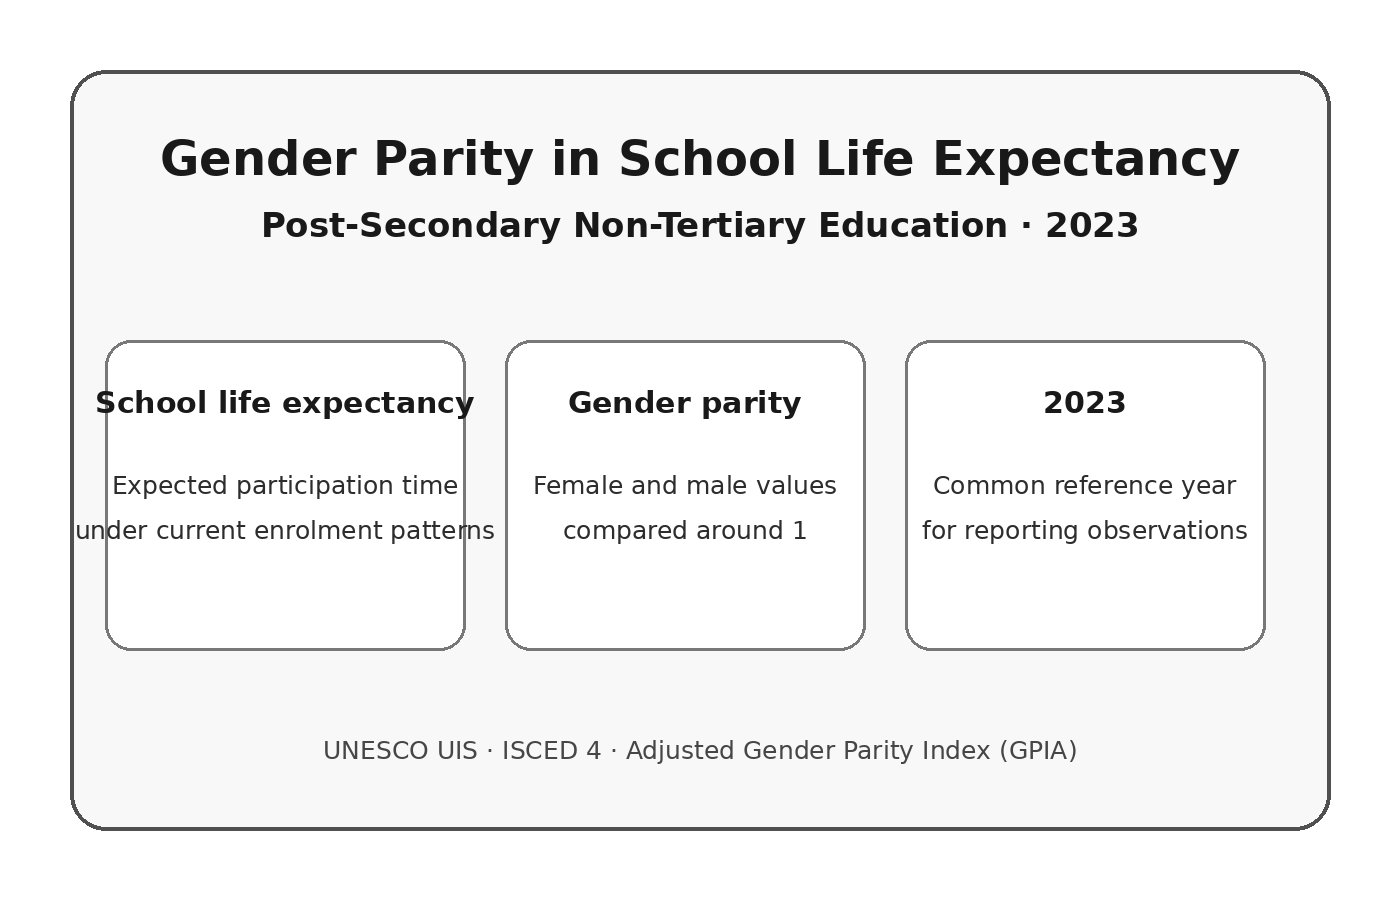
Table of Contents
School life expectancy measures expected participation time, not programme length
UIS defines school life expectancy as the total number of years of schooling a person of a given age can expect to receive in the future if current age-specific enrolment ratios remain unchanged. For a level-specific indicator, the idea is applied to time expected within the specified level. This differs from simply adding the official duration of programmes. Participation can be incomplete, people can enter at different ages and some people may never enter the level at all.
Because it is an average across a population, the value can be a fraction of a year even when individual programmes last one or more full academic years. A low value can reflect limited participation in that level rather than a very short official curriculum. A higher value can reflect broader participation, longer programmes or repeated participation. The indicator therefore describes exposure to the education system under current conditions, not a standardized credential length.
The gender parity version first calculates the underlying expectancy separately for females and males. It then compares those two values. That makes the indicator useful for identifying relative gender differences in participation time, but it does not tell the reader whether either sex is achieving strong learning outcomes, graduating successfully or obtaining qualifications valued in the labour market.
The education level is ISCED 4: after upper secondary, below tertiary education
Post-secondary non-tertiary education corresponds to ISCED level 4. UIS describes it as learning that builds on upper-secondary education and can prepare people for labour-market entry or for progression to tertiary education while remaining below the complexity associated with tertiary programmes. National labels vary widely, so the international category should not be treated as one specific diploma, college type or vocational certificate everywhere.
In some systems, ISCED 4 is an important vocational or professional route. In others, learners move directly from upper secondary into tertiary education, making the level comparatively small. Programme duration, entry requirements, typical ages and institutional arrangements can all differ. Those structural differences matter when comparing school life expectancy because the indicator reflects how a national education system actually uses the level.
The parity index does not remove those structural differences. It answers a narrower question: within each reporting education system, how does the female school life expectancy at ISCED 4 compare with the male value? Cross-country comparisons are still possible, but small numerical differences should not be interpreted as if every country had the same programme architecture.
The adjusted gender parity index makes disparities symmetric around 1
A standard gender parity index divides the female indicator value by the male indicator value. Equality produces 1. The problem is that an ordinary ratio is not symmetric: values below 1 are bounded by zero, while values above 1 have no comparable upper bound. UIS developed the adjusted gender parity index (GPIA) to represent disparities more symmetrically around 1 and keep the scale between 0 and 2.
When the female value is less than or equal to the male value, the adjusted index is the same as the ordinary female-to-male ratio. When the female value is higher, UIS applies a transformation so that an equivalent proportional disparity on the female-higher side is the same distance from 1 as the corresponding male-higher disparity. This makes visual comparisons and parity bands more intuitive.
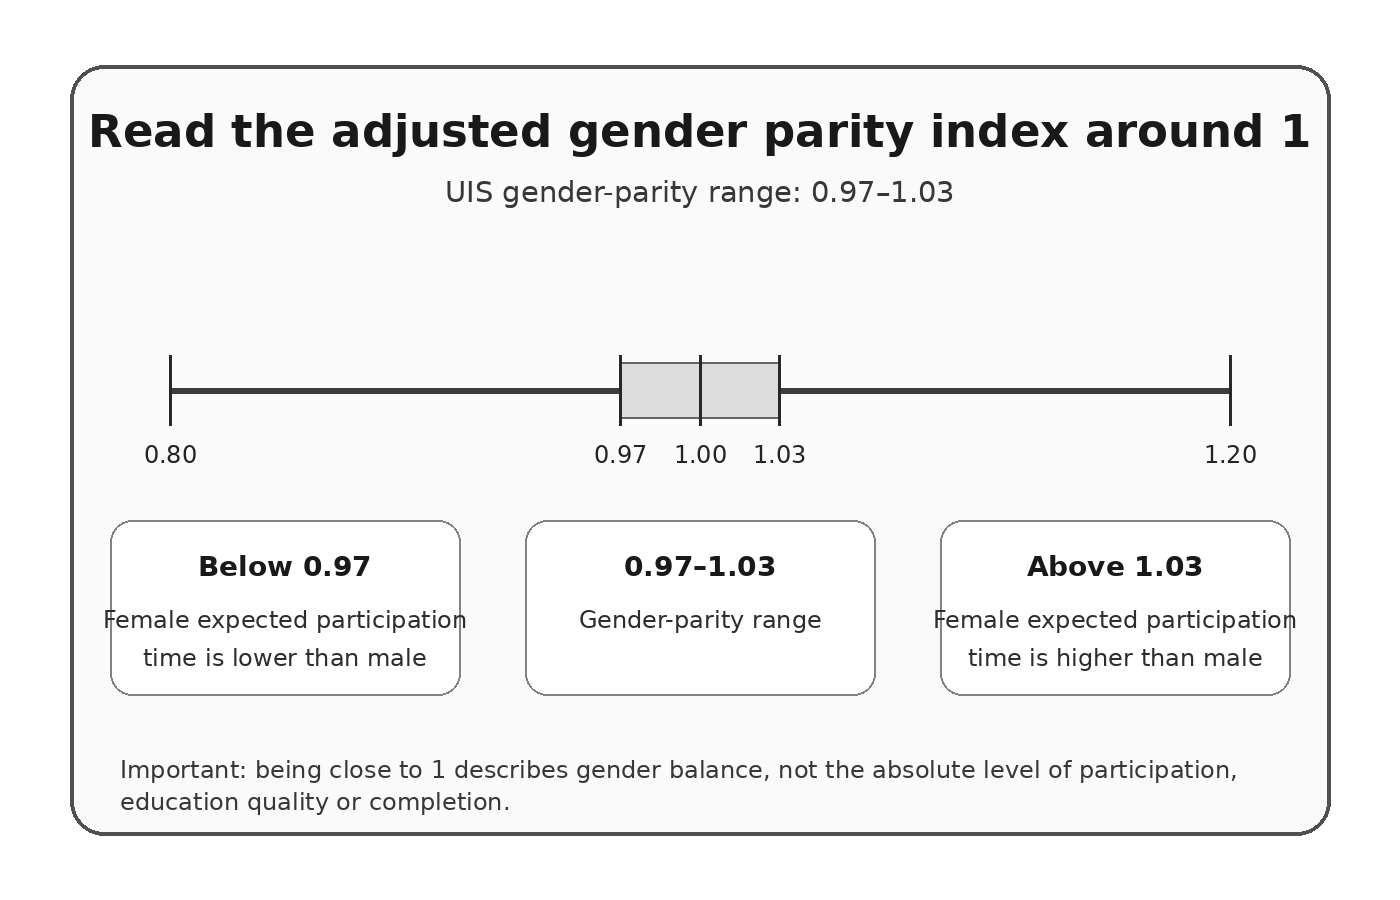
UIS generally treats 0.97 to 1.03 as the gender-parity range. A value of exactly 1 means the female and male school life expectancy values are equal. Values modestly above or below 1 can still fall inside the parity band. The band is a convention for interpreting small differences; it does not mean every value inside it is literally identical.
| Adjusted GPIA | Relative school-life-expectancy reading | What it does not mean |
|---|---|---|
| Below 0.97 | Female expected participation time is lower than the male value | The whole education system is necessarily weak |
| 0.97–1.03 | Generally interpreted by UIS as gender parity | Female and male absolute expectancy must be high |
| Above 1.03 | Female expected participation time is higher than the male value | Women necessarily receive better-quality education |
Whether a value above 1 is favorable depends on the underlying indicator
Parity indices must always be read together with the direction of the original measure. Here, the underlying measure is school life expectancy, so a higher value means more expected time participating in the specified education level under current enrolment patterns. An adjusted parity value above 1 therefore indicates a higher female school life expectancy, while a value below 1 indicates a higher male value.
The same verbal interpretation cannot be copied to every GPIA series. For an undesirable outcome such as an out-of-school rate, a larger female value would signal a different substantive direction. This is why a label such as “female advantage” or “male disadvantage” should not be attached automatically to a parity number before checking what the underlying indicator measures.
School life expectancy is different from attainment, graduation and official duration
Educational attainment records the highest level people have successfully completed. Graduation measures successful completion flows. Official duration tells us how long a programme is designed to last. School life expectancy is different from all three because it uses current participation probabilities to estimate expected time in education. Mixing these concepts can produce misleading conclusions about access or performance.
For example, a country can have a high adult share completing post-secondary education because many older and middle-aged cohorts accumulated that qualification over decades, while the current gender balance in ISCED 4 participation follows a different pattern. Conversely, a recent change in enrolment behavior can affect school life expectancy before it materially changes attainment across the entire adult population.
A longer school life expectancy is also not equivalent to a higher completion rate. Repetition, re-entry or switching among programmes can add time in education without guaranteeing completion. Learning quality is another separate dimension. Test scores, skills, credentials and employment outcomes require additional indicators rather than being inferred from expected participation time.
Cross-country comparisons inherit differences in national education structures
ISCED improves comparability by placing diverse national programmes into a common level framework, but it cannot make every education system identical. Some countries have a broad ISCED 4 sector; others have a narrow one. The relative importance of vocational, professional and transition programmes differs, as do typical student ages and institutional providers. These differences can influence the absolute expectancy values that sit behind the parity index.
Adult return to education can matter as well. Post-secondary non-tertiary programmes may include learners returning for vocational upgrading or additional qualifications, not only recent upper-secondary graduates. The extent to which administrative systems capture these learners consistently can vary. Cross-country differences of only a few hundredths should therefore be interpreted more cautiously than a clearly large departure from the parity band.
A parity gap also does not identify its cause. Gendered fields of vocational study, labour-market incentives, tuition and financial aid, upper-secondary completion, family responsibilities, geography and institutional design can all be relevant. The GPIA contains none of those explanatory variables. Causal claims require separate evidence rather than being inferred from one parity measure.
The 87 observations are a reporting set, not a complete world ranking
The 2023 indicator coverage identifies 87 country or area observations with a value for the reference year. Countries without a reported comparable observation should not be assigned zero. Missing education data can result from reporting schedules, validation, coverage limitations or differences in whether the relevant education level is statistically represented.
Any summary statistic or ranking should therefore be described as applying to the 2023 reporting set, not automatically to every country in the world. The same principle matters for mapping: no-data areas should remain distinct from genuine values. Filling missing countries into the lowest category would create a false geographic pattern.
Country values should not be reconstructed from another year or another indicator
Parity rankings can change with small numerical differences, so the underlying country rows matter. A 2023 comparison should use 2023 observations for each included country, preserve the original geographic identifiers and verify the unit and missing-value status. Combining latest available observations from different years and labeling them as a 2023 ranking would mix time periods and undermine the main advantage of a common-year dataset.
A map also requires a verified join between country identifiers and boundary geometry. Missing values must remain “no data” rather than being replaced with zero. Because the interpretation is centered on 1, a useful parity map should visibly distinguish the 0.97–1.03 parity range and the two directions outside it instead of treating the index as an ordinary one-way quantity.
Pairing the parity index with other education measures adds context
The adjusted parity index deliberately compresses the two sex-specific values into one relative number. That is useful for gender balance but hides absolute participation. Looking at female and male school life expectancy separately can distinguish a system with low participation for both sexes from one with longer participation and similar parity. The same GPIA value can occur in education systems with very different absolute levels.
Enrolment indicators answer how many people are participating at a point in time. Adult attainment answers how many have already completed a threshold level. Graduation measures completion flows. School life expectancy summarizes expected participation time if current age-specific enrolment patterns persist. Each measure adds a different piece of the picture, and none should be substituted for another.
For ISCED 4 specifically, comparisons with upper-secondary attainment and post-secondary attainment can help place the level in the wider education pathway. Those comparisons remain descriptive. A difference between two percentages is not automatically a transition rate, dropout rate or causal effect unless the populations, reference years and statistical definitions are designed for that calculation.
| Companion measure | Question it answers | How it differs from GPIA |
|---|---|---|
| Female and male school life expectancy | What is the absolute expected participation time for each sex? | GPIA summarizes only their relative balance |
| Enrolment rate | How much of the relevant population is participating now? | Measures participation share, not expected time |
| Adult educational attainment | How many adults have already completed a threshold level? | Measures accumulated completion |
| Graduation/completion indicators | How many learners successfully finish? | Completion is not the same as expected participation duration |
Source, definitions and interpretation limits
The underlying statistical source is the UNESCO Institute for Statistics. UIS defines school life expectancy from age-specific enrolment patterns and classifies post-secondary non-tertiary education as ISCED level 4. UIS also documents the adjusted gender parity index and its symmetric transformation around 1, with a conventional parity range of 0.97 to 1.03.
Comparability still depends on reliable enrolment data by age, appropriate population estimates and consistent classification of programmes. The length of an academic year, repetition practices and the boundary between education and other forms of training can differ across countries. School life expectancy also says nothing directly about the quality of teaching, learning outcomes or the economic value of qualifications.
For definitions, the UIS Data Browser glossary and Education Indicators Technical Guidelines are the best starting points. Readers should check the education level, sex disaggregation, reference year and whether an index is adjusted before comparing values from different portals. Similar labels can refer to broader school-life-expectancy measures that include several education levels rather than ISCED 4 alone.
- UNESCO UIS Data Browser Glossary
- UNESCO UIS Education Indicators Technical Guidelines
- UNESCO UIS explanation of the adjusted gender parity index
- UNESCO UIS Other Policy Relevant Indicators for Education
Frequently Asked Questions
Is school life expectancy the number of years an individual will actually study?
No. It is an average expected duration based on current age-specific enrolment patterns. It is not the official programme length or an individual forecast.
What does 1 mean in the adjusted gender parity index?
A value of 1 means the female and male values of the underlying indicator are equal. UIS generally treats 0.97–1.03 as the gender-parity range.
Does a value above 1 mean women receive better education?
No. For this indicator it means female school life expectancy is higher than the male value. It does not measure teaching quality, learning outcomes or graduation success.
Should countries with missing data be treated as zero?
No. A missing observation is not a zero value and should remain no data in tables and maps.
Related Articles
- Post-Secondary Attainment 2023 | 9 Countries Above 50%
- Post-Secondary Attainment for Adults 25+ | 2020–2024 Map
- Global Upper-Secondary Attainment Map | Adults 25+ by Country
Green Map creates custom-edited map images using open geographic data sources such as geoBoundaries, Natural Earth, OpenStreetMap, and government open data.
These maps are edited visual materials, not raw data files, and are provided for education, documents, presentations, and graphic reference.