Lewis County in north-central Idaho packs a large change in terrain into a relatively compact outline. Nezperce sits near the middle of the mapped road network, while Kamiah is separated to the east where the county narrows into a lower valley. Craigmont, Winchester, and Reubens lie farther west, and the county’s streams cut deeply through the uplands before reaching lower ground. This page explains those roads, towns, waterways, and elevation changes from the supplied maps, and the same map set is available as high-resolution JPG files in a downloadable ZIP.
The county map is easiest to understand by using Nezperce as an anchor. The Idaho Blue Book identifies Nezperce as the county seat, and the map shows several routes spreading from the central part of the county toward Craigmont, Winchester, Reubens, and Kamiah. The city index adds a second view by ranking five mapped communities, while the water and elevation maps show why the eastern edge and the deeply cut southern valleys look so different from the broader western uplands.
The WebP images in the article are optimized for on-page viewing. The download archive contains the county, city, terrain-and-water, and elevation maps as 2572×3638 JPG files, which are better for zooming in on road numbers and small stream labels or for printing. These maps are intended for general geographic reference; they are not parcel, flood-hazard, legal-boundary, engineering, or real-time road-condition products.
Table of Contents
Roads spread west from Nezperce while Kamiah sits in a separate eastern valley
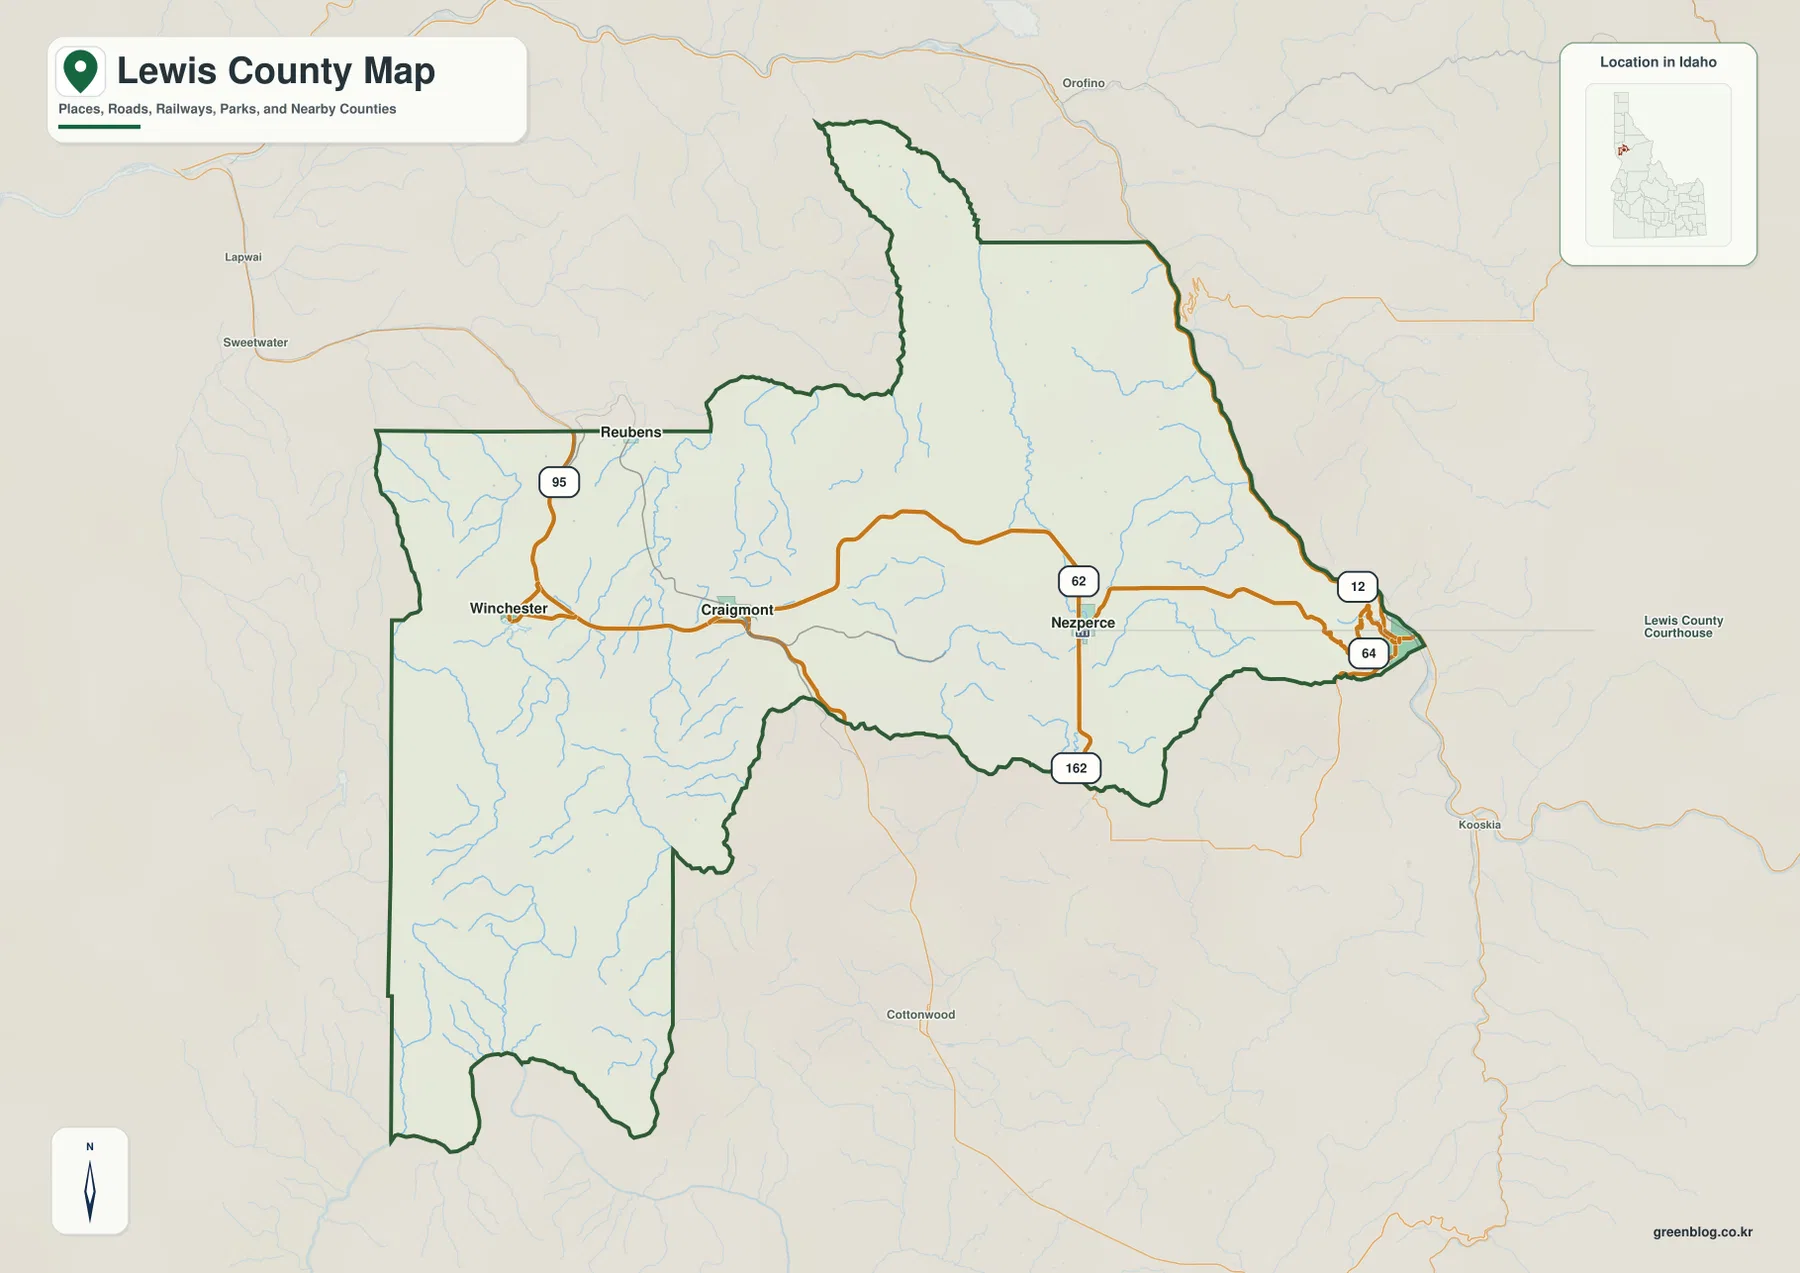
On the county map, Nezperce is slightly east of center, with Craigmont and Winchester extending the settlement pattern toward the west. Reubens sits near the northwestern part of the main county body, while Kamiah appears at the narrow eastern tip. Route 95 passes through the western side near Reubens and Winchester, Route 62 links the Craigmont area with Nezperce, and Route 162 runs south from Nezperce. Route 64 continues east toward Kamiah, where Route 12 is also shown near the valley corridor.
The county boundary itself helps explain why the road pattern does not look like a simple grid. Lewis County is broad in the west, has a long narrow projection to the north, and tapers toward Kamiah on the east. Roads are more concentrated through the settled middle of the county, while the outer sections contain more streams and relief than major road labels. The neighboring-county labels on the city map place Nez Perce County to the west and Idaho and Clearwater counties to the east, giving useful context for the county’s position in north-central Idaho.
Near Kamiah, the road network reaches a much lower valley than the prairie towns farther west. That is important when using the map for orientation: the straight map distance between two towns does not show the full terrain change between them. For trip planning, the county map is best used to identify the route corridor first, then checked against current transportation information for conditions and driving time.
Five mapped communities reveal a split between prairie towns and the eastern lowlands
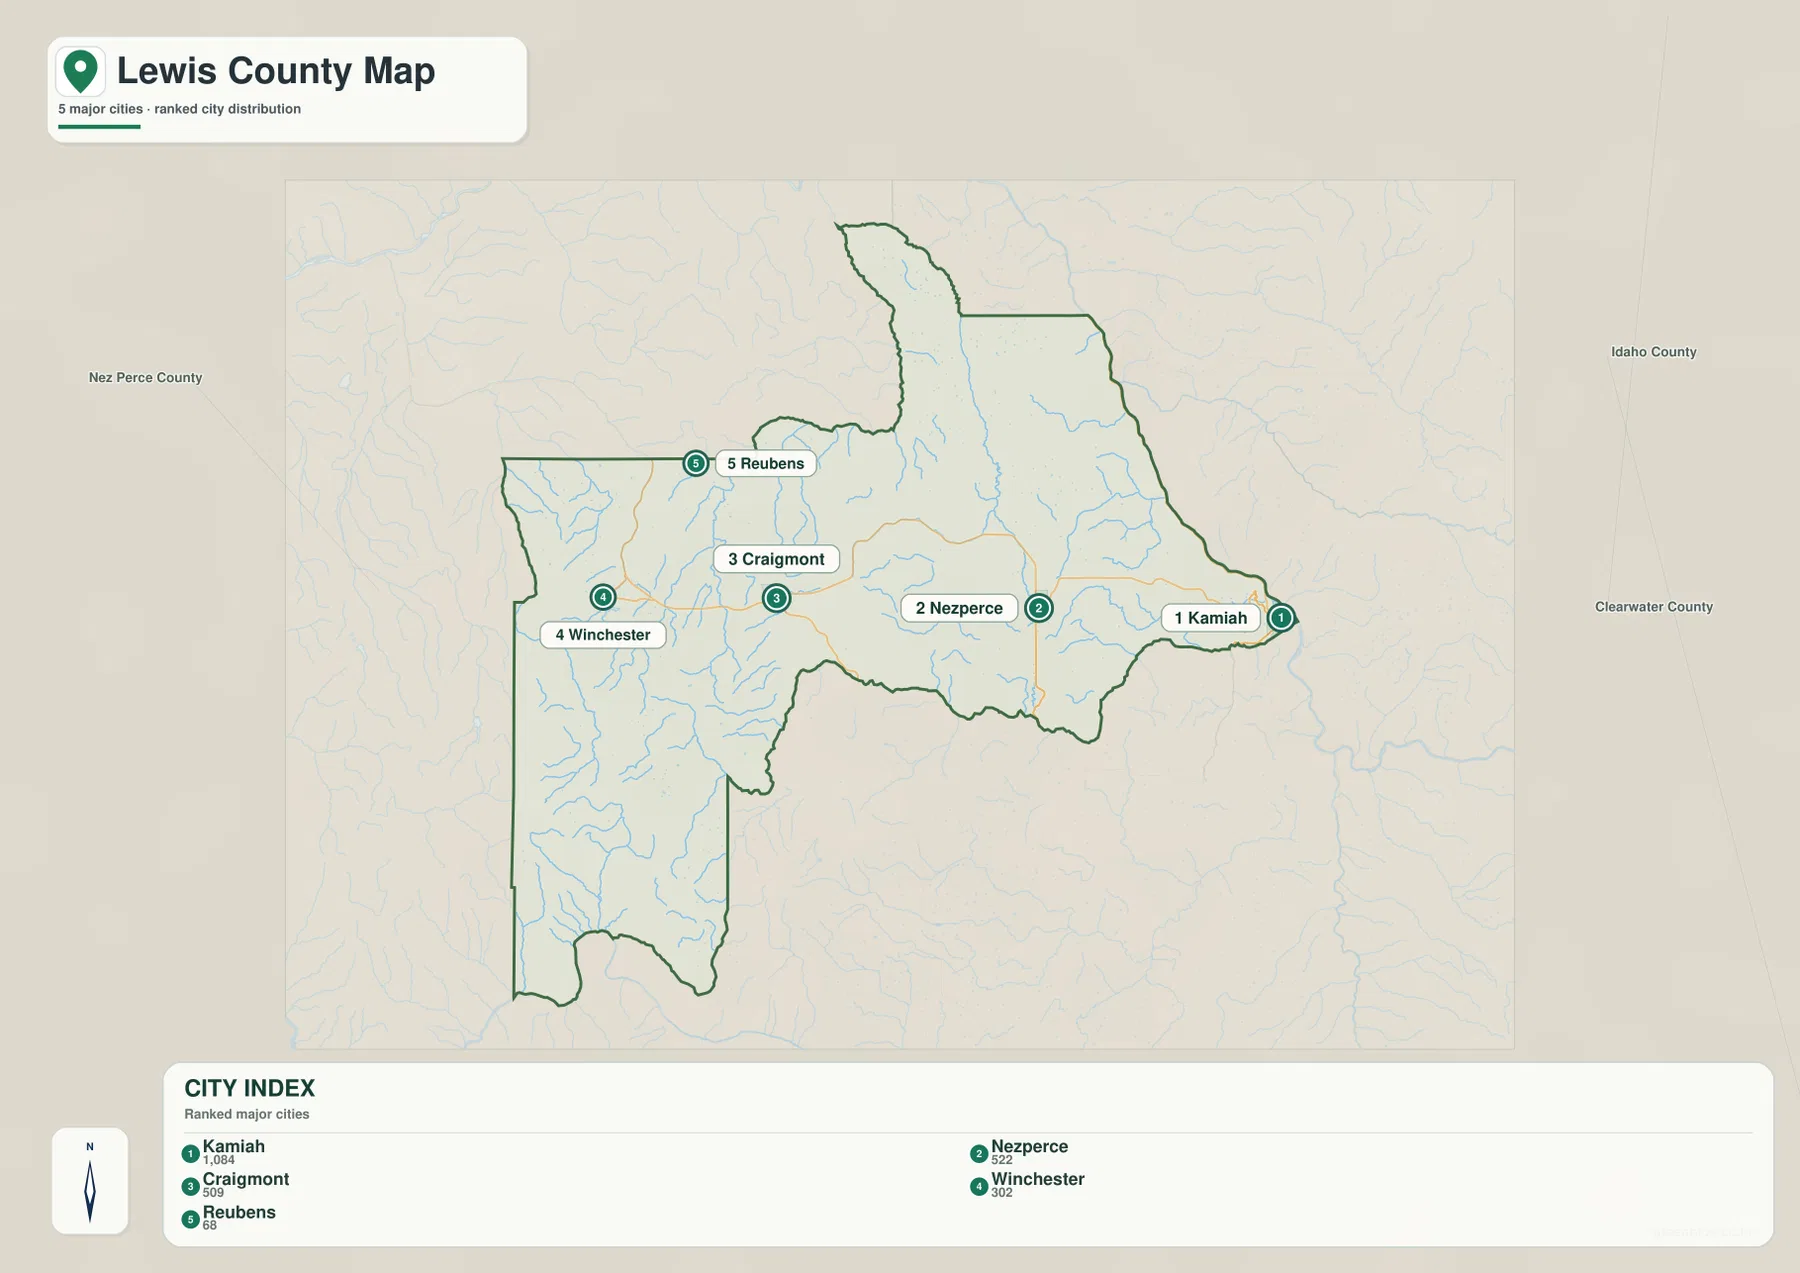
The city map ranks five communities and makes their separation easier to see than the more detailed county map. Its index shows Kamiah 1,084, Nezperce 522, Craigmont 509, Winchester 302, and Reubens 68. Those values belong to the map’s city-ranking dataset and should not be treated as a live population count. If current population figures are needed, they should be checked against an up-to-date Census source.
Kamiah is the outlier in location as well as in the city index. It lies at the far eastern end of the county, while Nezperce, Craigmont, Winchester, and Reubens occupy the central and western uplands. The four western communities are not packed together, but they share the broader high ground shown by the elevation map. Kamiah, by contrast, sits beside the steep descent into the eastern valley, so its physical setting differs noticeably from the other mapped towns.
No mileage connectors are drawn between the cities on this map. The numbered markers indicate rank, not travel distance, and the map should not be used to estimate driving time. To understand how the communities connect, compare the city map with the county map: Routes 62, 64, 95, and 162 provide the road context that the city index intentionally leaves out.
Canyon creeks cut through the uplands before reaching the Salmon River corridor
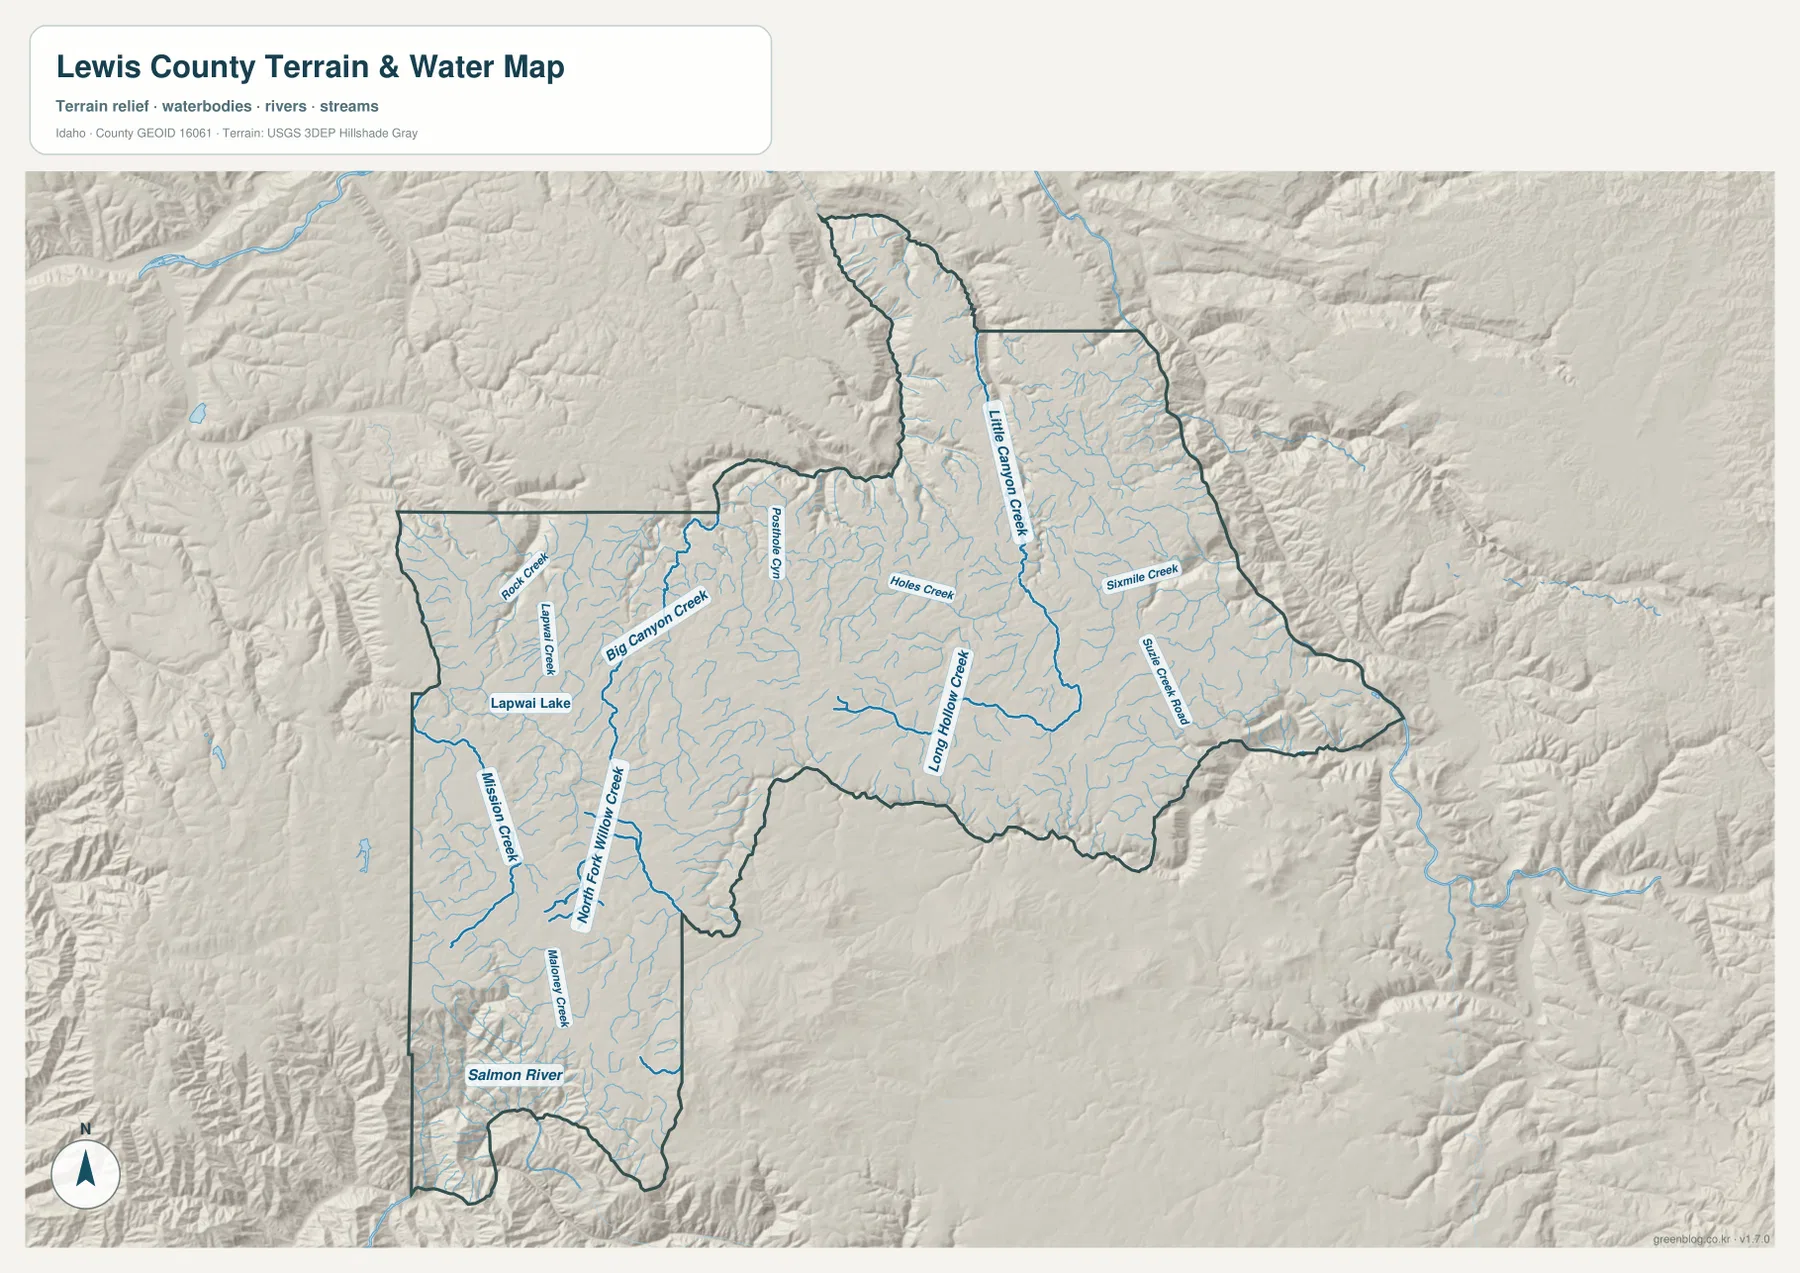
The terrain-and-water map gives Lewis County a much more rugged appearance than the road map alone. Big Canyon Creek crosses the western and central part of the county, while Little Canyon Creek runs through the long northern projection. Sixmile Creek appears in the east, and Long Hollow Creek and Holes Creek drain the central area. Numerous smaller tributaries branch into these named streams, creating a dense network of narrow valleys.
Several other labels help distinguish the western and southern parts of the county. Lapwai Lake is marked in the west, Mission Creek runs through the southwest, and North Fork Willow Creek and Willow Creek follow valleys farther south. The Salmon River forms the most prominent named waterway along the county’s southern edge. Compared with the smaller creeks on the upland surface, the river corridor is set into much deeper relief.
This water map is useful for locating streams and seeing how they relate to the surrounding terrain, but it does not show flood zones, legal access, navigability, or current water conditions. Those questions require current agency data. For ordinary map reading, the strongest use is to compare the named creeks with the shaded relief and see how the county’s plateau surface is broken by canyon after canyon.
Elevation falls from broad western uplands into deep eastern and southern valleys
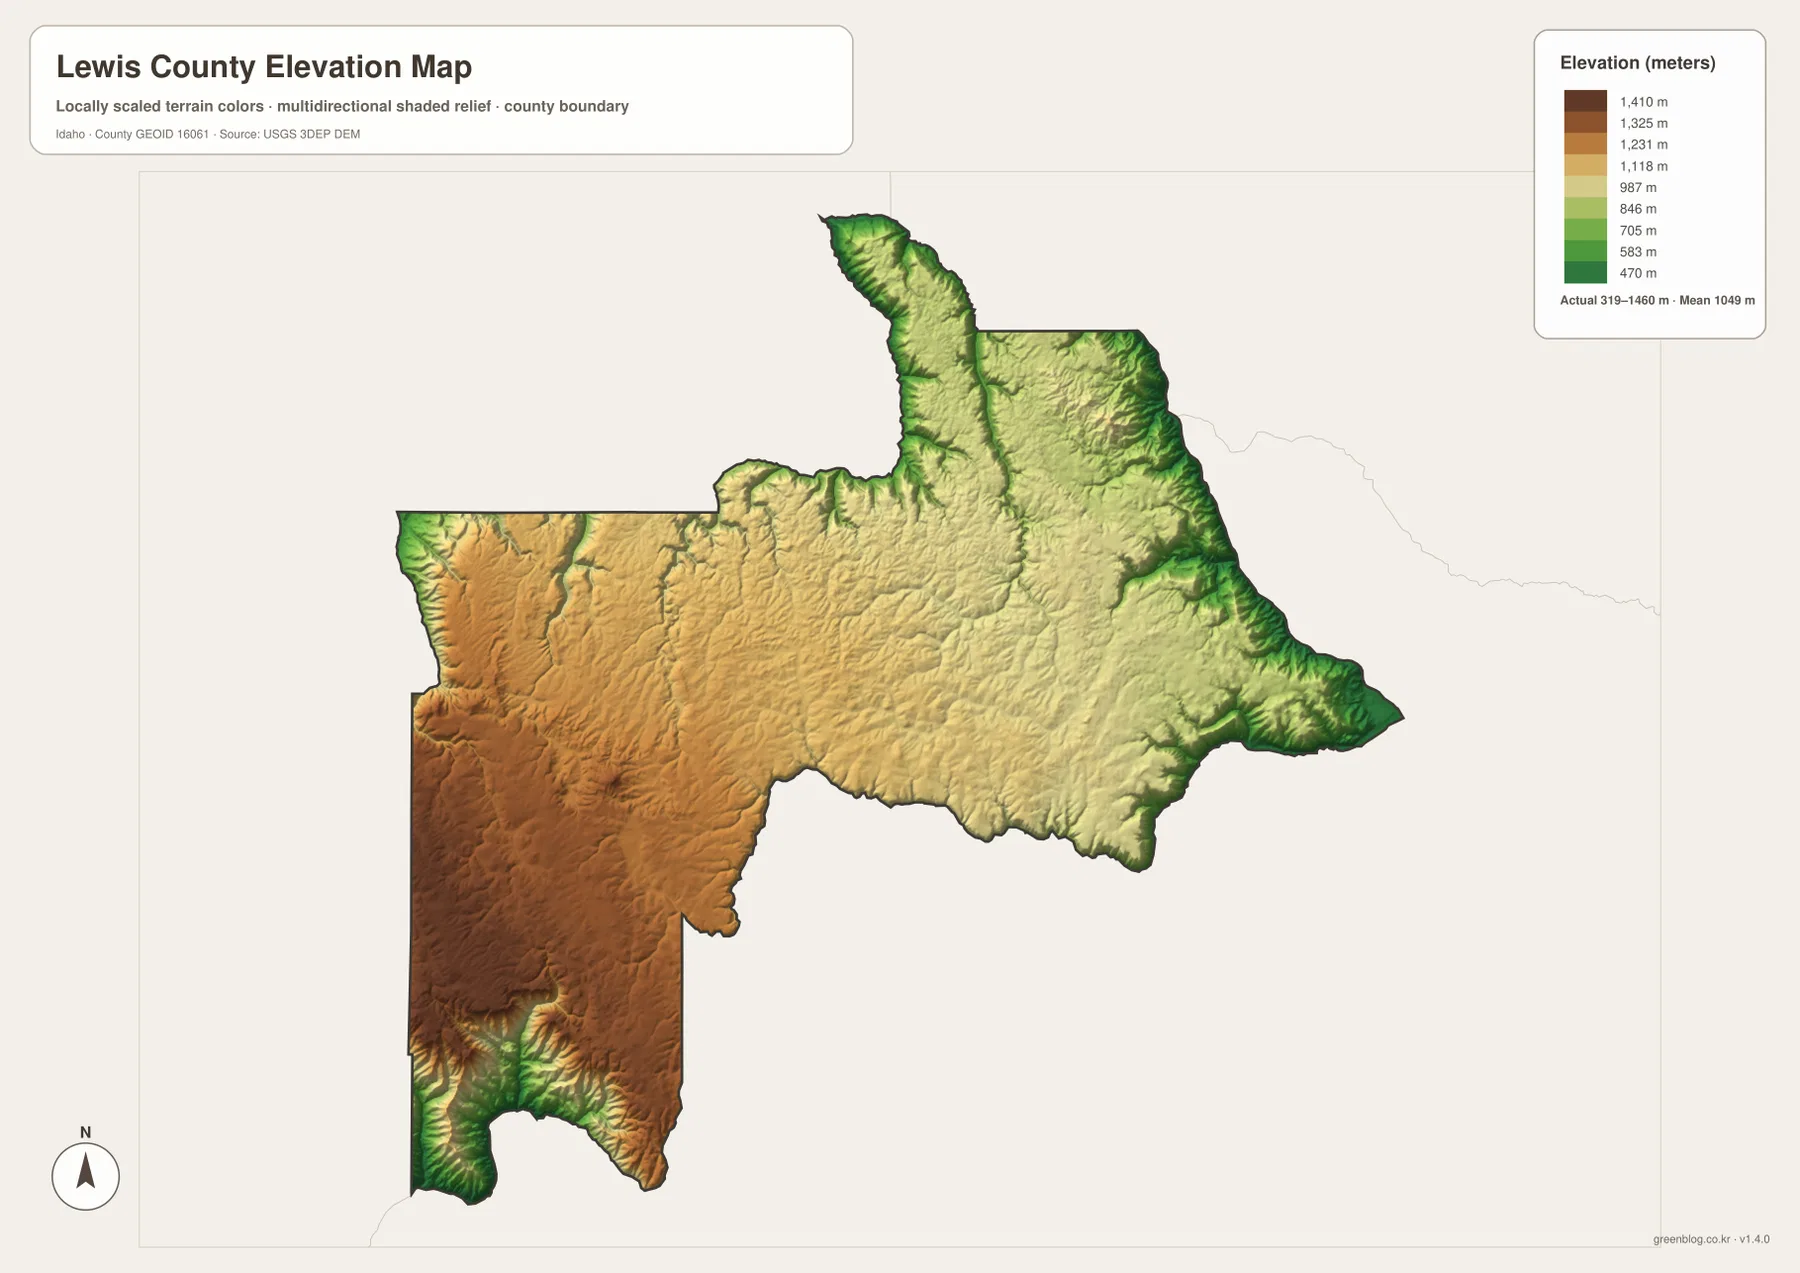
The elevation map reports an actual range of about 319 to 1,460 meters, with a mean near 1,049 meters. Browns and warm yellows cover much of the western and southwestern uplands, while greens trace the lower eastern tip and deeply incised valleys. The central plateau remains relatively high, but narrow low corridors extend into it where streams have cut down through the surface. This produces a much more varied landscape than the county’s broad outline might suggest.
The contrast is especially useful when comparing Kamiah with the prairie communities to the west. Kamiah is shown near the low eastern edge, whereas Winchester and Craigmont sit on much higher terrain. In the southwest, low canyon floors are surrounded by elevated ground, so elevation can change quickly over a short horizontal distance. Switching back to the water map makes the relationship clear: the lower green corridors often line up with the same creeks and river valleys that are labeled there.
These colors summarize county-scale elevation, not survey-grade measurements for individual properties or structures. The map is appropriate for comparing uplands, canyon floors, and broad terrain transitions. Engineering, construction, or precise site work should rely on the underlying USGS elevation data and professional field measurements rather than values read from this generalized map.
Choose the map by the question: routes, communities, streams, or terrain
For basic orientation, start with the county map. It is the only view that combines the main town names, numbered roads, county outline, and enough surrounding geography to show how Nezperce connects west toward Craigmont and Winchester and east toward Kamiah. The city map is cleaner when the goal is simply to compare the five ranked communities without the extra road and stream detail.
The terrain-and-water map is the better choice when a place name such as Big Canyon Creek, Little Canyon Creek, Lapwai Lake, or Willow Creek is the target. The elevation map answers a different question by showing how sharply the county drops from the uplands into low valleys. Used together, the water and elevation maps explain why the eastern tip and southern river corridor look so deeply cut compared with the central prairie surface.
For printing, classroom use, or a larger on-screen view, the high-resolution JPGs preserve more detail than the WebP previews in the article. The archive keeps each map as a separate file, so there is no need to print every layer when only one topic is relevant. A road-and-place lesson may need the county map, while a terrain comparison can rely on the water and elevation views.
Frequently Asked Questions
Which map is best for comparing Nezperce and Kamiah?
The county map is the best first choice because it shows both communities together with Routes 62, 64, and 162 and the county boundary. The city map provides a cleaner comparison of the five ranked communities, while the elevation map adds the important terrain contrast between Nezperce’s upland setting and the lower eastern valley around Kamiah.
Can I see Big Canyon Creek and the Salmon River on the same map?
Yes. The terrain-and-water map labels Big Canyon Creek across the western and central part of the county and shows the Salmon River along the southern edge. It also labels Little Canyon Creek, Sixmile Creek, Long Hollow Creek, Mission Creek, Willow Creek, and Lapwai Lake, making it the most detailed water-reference map in the set.
Is the 319–1,460 m elevation range suitable for surveying?
No. The range summarizes county-scale terrain and is useful for comparing uplands with canyon floors, but it is not a survey measurement for a specific site. Precise engineering or property work should use the original USGS elevation data and appropriate field surveying.
Map File Information
Download the Lewis County county, city, terrain-and-water, and elevation maps as high-resolution JPG files in one ZIP archive.
- Included Files: county map, major-city map, terrain-and-water map, elevation map
- Printable Size: 2572×3638 pixels for each JPG
- File Type: ZIP containing 4 JPG files
Related Maps
Sources and reference links
For county background and the county-seat designation, see the Idaho Blue Book county section. Local context for Nezperce is available from Visit North Central Idaho’s City of Nezperce page.
Boundary reference data are available from the U.S. Census Bureau TIGER/Line Shapefiles. Water features can be checked against USGS National Hydrography, and elevation data are available through the USGS 3D Elevation Program.
Green Map creates custom-edited map images using open geographic data sources such as geoBoundaries, Natural Earth, OpenStreetMap, and government open data.
These maps are edited visual materials, not raw data files, and are provided for education, documents, presentations, and graphic reference.