Out-of-school rates among children of official primary-school age can differ between boys and girls. UNESCO Institute for Statistics indicator ROFST.MOD.1.GPIA is the adjusted gender parity index (GPIA) for the out-of-school rate of primary-school-age children.
The 2025 modelled dataset contains 190 country and area observations. 32 fall within the 0.97–1.03 parity band, 61 have higher female out-of-school rates, and 97 have higher male out-of-school rates. The Republic of Korea records 0.833, indicating a higher out-of-school rate for boys.
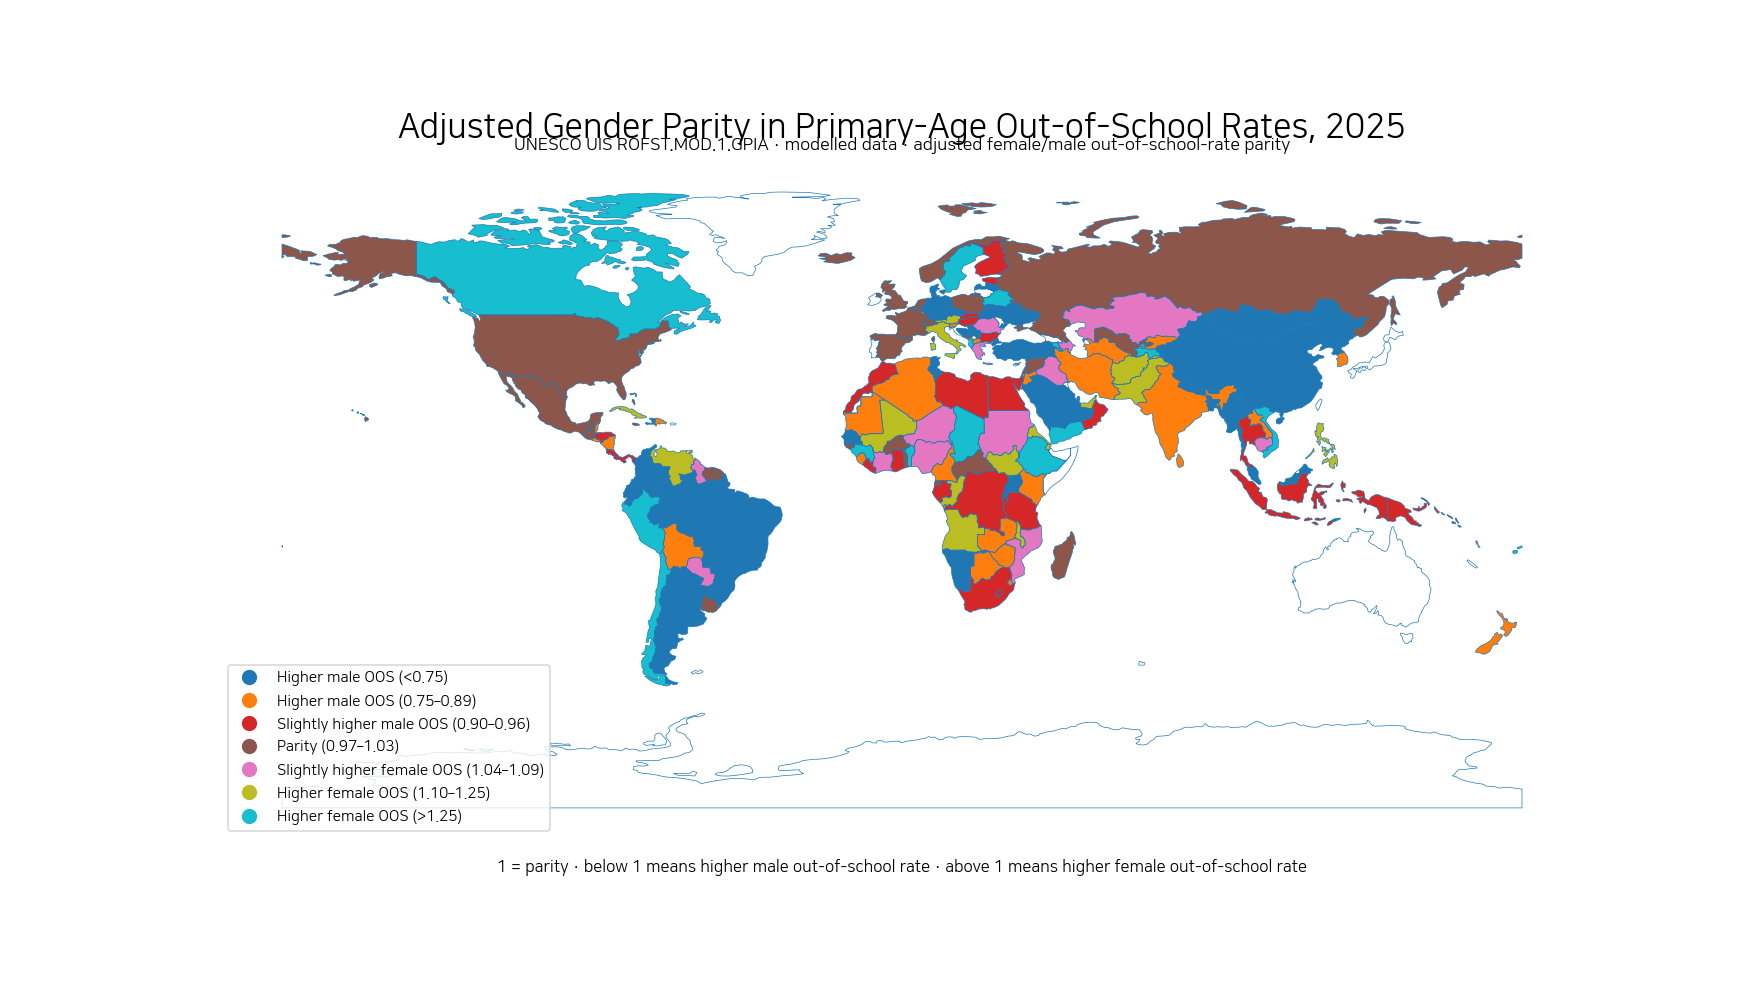
Table of Contents
The indicator measures the gender gap, not the out-of-school rate itself
ROFST.MOD.1.GPIA is not a percentage of children who are out of school. It summarizes the relationship between the female and male out-of-school rates in one adjusted parity index.
Korea’s 0.833 therefore should never be written as an out-of-school rate of 0.833%. Actual out-of-school percentages require the male, female or both-sexes out-of-school-rate indicators.
How primary-age out-of-school status is defined
UIS calculates the primary out-of-school rate using children in the official primary-school age range. Children enrolled in primary or secondary education count as in school; those not enrolled in primary or secondary education count as out of school.
A primary-age child who has already advanced to secondary school is therefore still considered in school. The concept is broader than simply asking whether the child is registered in a primary-school grade.
These are modelled data
The indicator name explicitly identifies the series as modelled data. The UIS Data Browser separates out-of-school rates into administrative, household-survey and modelled series.
The 2025 values should therefore be distinguished from a single directly observed administrative return. Modelled series are designed for comparable monitoring and broader coverage, while country-specific policy analysis should also consult the latest national administrative and survey evidence.
GPIA is centered on 1
An adjusted parity index is centered on 1 and bounded between 0 and 2. A value of exactly 1 indicates parity, and the farther the index is from 1, the larger the disparity.
UIS commonly uses 0.97–1.03 as the practical parity band. Starting in 2020, parity indices in the UIS framework use the adjusted methodology.
Out-of-school rates reverse the usual direction of parity interpretation
This detail is essential. For indicators where higher values are desirable, an index above 1 has one interpretation. But the out-of-school rate should ideally approach zero, so the interpretation is reversed.
For this indicator, a GPIA above 1.03 means the female out-of-school rate is higher and girls are relatively disadvantaged. A GPIA below 0.97 means the male out-of-school rate is higher and boys are relatively disadvantaged.
Korea’s 0.833 indicates a higher out-of-school rate for boys
The Republic of Korea has a modelled GPIA of 0.833. Because the value is below 0.97, the modelled male out-of-school rate is higher than the female rate.
The index does not reveal the percentage-point gap. To know how much higher the male out-of-school rate is in absolute terms, the separate male and female out-of-school rates are required.
The United States, France, the United Kingdom and Mexico are modelled at parity
The United States, France, the United Kingdom, Mexico, Norway, Spain, Belgium and the Netherlands are among the observations with a GPIA of 1.000.
In total, 32 of the 190 observations lie in the 0.97–1.03 parity band. Parity does not mean the out-of-school rate itself is low; boys and girls can have equally high rates or equally low rates.
| Country or area | ISO3 | GPIA | Interpretation |
|---|---|---|---|
| Belgium | BEL | 1.000 | Parity |
| Cook Islands | COK | 1.000 | Parity |
| France | FRA | 1.000 | Parity |
| Iceland | ISL | 1.000 | Parity |
| Liechtenstein | LIE | 1.000 | Parity |
| Mexico | MEX | 1.000 | Parity |
| Montenegro | MNE | 1.000 | Parity |
| Netherlands | NLD | 1.000 | Parity |
| Norway | NOR | 1.000 | Parity |
| Poland | POL | 1.000 | Parity |
| Russian Federation | RUS | 1.000 | Parity |
| Spain | ESP | 1.000 | Parity |
Canada, Sweden and Viet Nam have higher female out-of-school rates
Canada records 1.304, Sweden 1.667, Viet Nam 1.286, the Philippines 1.202 and Italy 1.176. All are above 1.03, indicating higher female out-of-school rates.
The size of the index should not be treated as a simple ranking of education-system performance. Where overall out-of-school rates are very low, a small absolute sex difference can produce a large ratio, and the values are modelled.
Dominica, Sweden, Fiji and Hong Kong have especially high female-disadvantage indices
Dominica has the highest value at 1.935. Sweden is 1.667, Fiji 1.636, Hong Kong SAR 1.591 and Albania 1.552.
These values indicate a larger relative female out-of-school rate than male out-of-school rate. They do not mean those countries have the world’s highest female out-of-school percentages.
| Higher female out-of-school rate | ISO3 | GPIA |
|---|---|---|
| Dominica | DMA | 1.935 |
| Sweden | SWE | 1.667 |
| Fiji | FJI | 1.636 |
| Hong Kong SAR, China | HKG | 1.591 |
| Albania | ALB | 1.552 |
| Antigua and Barbuda | ATG | 1.500 |
| Saint Vincent and the Grenadines | VCT | 1.500 |
| Tajikistan | TJK | 1.476 |
| Armenia | ARM | 1.457 |
| Chad | TCD | 1.426 |
| Belarus | BLR | 1.409 |
| Grenada | GRD | 1.367 |
Germany, Bangladesh, China and Brazil have higher male out-of-school rates
Germany is 0.474, Bangladesh 0.442, China 0.702, Brazil 0.667, India 0.867 and Indonesia 0.923. Each is below 0.97, indicating a higher male out-of-school rate.
The pattern is a reminder that educational exclusion is not uniformly greater for girls. Country and period matter, and boys can face higher out-of-school risk in some contexts.
| Higher male out-of-school rate | ISO3 | GPIA |
|---|---|---|
| Montserrat | MSR | 0.062 |
| Bermuda | BMU | 0.154 |
| Latvia | LVA | 0.188 |
| Serbia | SRB | 0.200 |
| Bhutan | BTN | 0.202 |
| Argentina | ARG | 0.250 |
| Curaçao | CUW | 0.253 |
| Seychelles | SYC | 0.333 |
| Timor-Leste | TLS | 0.375 |
| Tonga | TON | 0.391 |
| Cabo Verde | CPV | 0.395 |
| Ecuador | ECU | 0.404 |
More destinations fall on the male-disadvantage side in this country-level distribution
Excluding the parity band, 97 observations have higher male out-of-school rates and 61 have higher female rates. The median GPIA is 0.961, slightly below 1.
This is not a population-weighted global conclusion about whether more boys or girls are out of school worldwide. Each country or area counts once in this distribution, regardless of its number of primary-school-age children.
Extreme values need the underlying male and female rates for context
The lowest observation is Montserrat at 0.062, while the highest is Dominica at 1.935. Such values signal large relative disparity.
But where overall out-of-school rates are very low or populations are small, a modest absolute difference can create a large ratio. Interpretation is safer when the male and female out-of-school percentages and age-group populations are available.
This is different from the upper-secondary out-of-school-rate article
The upper-secondary-age article compares the both-sexes out-of-school percentage itself. The current indicator focuses on primary-school-age children and measures only the gender disparity in that rate.
The education level and the statistical measure are both different, so the two values should not be added or directly compared as if they were the same scale.
Modelled GPIA should be read alongside national evidence
Modelled data are useful for international comparison and coverage, but they may not capture every recent local change or subnational disruption immediately.
Conflict, displacement, disasters, administrative gaps and rapid policy changes can affect out-of-school estimates. Country-level interpretation is stronger when modelled UIS results are read with ministry data, household surveys and sex-disaggregated national statistics.
Blank map areas do not mean a GPIA of zero
The source table contains 190 country and area observations, of which 154 match separate polygons in the low-resolution world boundary layer used here. Small territories can have valid values without a visible polygon.
Missing values remain unclassified. They are never replaced with zero because zero would imply an extreme male-disadvantage result rather than missing data.
Data source and interpretation
Country values come from the UNESCO UIS Data Browser for ROFST.MOD.1.GPIA, using the 2025 modelled series. The out-of-school-rate concept follows the UIS methodology.
Adjusted parity-index interpretation follows the UIS parity-indices methodology. The source metadata labels the unit as percent, but GPIA itself is a 0–2 adjusted index rather than a percentage. The source package also tagged the provider as World Bank even though the official indicator and data are UNESCO UIS, so the completed metadata corrects the provider to UNESCO UIS.
Frequently Asked Questions
What does Korea’s GPIA of 0.833 mean?
It indicates that the modelled out-of-school rate for primary-school-age boys is higher than the rate for girls. It does not mean the out-of-school rate is 0.833%.
What does a GPIA above 1 mean for an out-of-school rate?
Because lower out-of-school rates are better, a value above 1 indicates a higher female out-of-school rate, while a value below 1 indicates a higher male rate.
Are these direct administrative observations?
No. ROFST.MOD.1.GPIA is identified by UIS as a modelled-data series and should be distinguished from direct administrative observations.
Can GPIA tell me the actual out-of-school percentage?
No. GPIA measures the relative gender disparity. Actual percentages require the separate male, female or both-sexes out-of-school-rate indicators.
Related Articles
- Out-of-School Rate for Upper-Secondary-Age Youth | 2024
- Out-of-School Rates for School-Age Children and Youth | 2024
- Compulsory Education Duration by Country | 2025
Green Map creates custom-edited map images using open geographic data sources such as geoBoundaries, Natural Earth, OpenStreetMap, and government open data.
These maps are edited visual materials, not raw data files, and are provided for education, documents, presentations, and graphic reference.