Lower Connecticut River Valley Planning Region stretches from the Middletown area south along the Connecticut River to the shoreline around Old Saybrook and Old Lyme. The maps on this page make it easier to place the region within Connecticut, follow its main roads and waterways, compare its larger and smaller incorporated places, and see how the broad river valley opens toward the coast. WebP versions are provided for quick viewing in the article, and the original high-resolution JPG files can be downloaded together in one ZIP archive.
The name “Planning Region” matters here. Connecticut no longer uses its former eight counties as the Census Bureau’s current county-equivalent geography. Since the 2022 geographic change, nine Councils of Governments and planning regions fill that statistical role. Lower Connecticut River Valley Planning Region is one of those nine units. It should therefore be read as a modern regional boundary used for statistics and mapping rather than as a traditional county government with the same structure found in many other states.
Table of Contents
Seventeen municipalities tied together by river valley and shoreline
RiverCOG, the Lower Connecticut River Valley Council of Governments, lists seventeen member municipalities: Chester, Clinton, Cromwell, Deep River, Durham, East Haddam, East Hampton, Essex, Haddam, Killingworth, Lyme, Middlefield, Middletown, Old Lyme, Old Saybrook, Portland, and Westbrook. Their combined outline is not a narrow strip following the river. The region spreads west into Durham, Killingworth, Clinton, and Westbrook, east into East Hampton, East Haddam, Lyme, and Old Lyme, and north to the Middletown-Cromwell area.
The Connecticut River is still the easiest feature to use as an orientation line. It enters the region from the north, bends through the Middletown area, passes Haddam and East Haddam, then continues toward Chester, Deep River, Essex, and the broad estuary between Old Saybrook and Old Lyme. Once that central line is clear, the rest of the region falls into place. Western inland towns sit away from the main stem, eastern communities occupy tributary valleys and wooded uplands, and the southern edge reaches the Long Island Sound shoreline.
Middletown provides the strongest urban reference point on the north side of the region. Portland is directly across the river, while East Hampton lies farther east. Moving south, the pattern changes to a series of smaller river and shoreline centers such as Chester Center, Deep River Center, Essex Village, Old Saybrook Center, and the borough of Fenwick. Clinton and Westbrook add another coastal component west of the Connecticut River mouth, so the planning region is best understood as both a lower-river area and a section of the central Connecticut shoreline.
Roads, boundaries, and community centers from Middletown to Old Saybrook
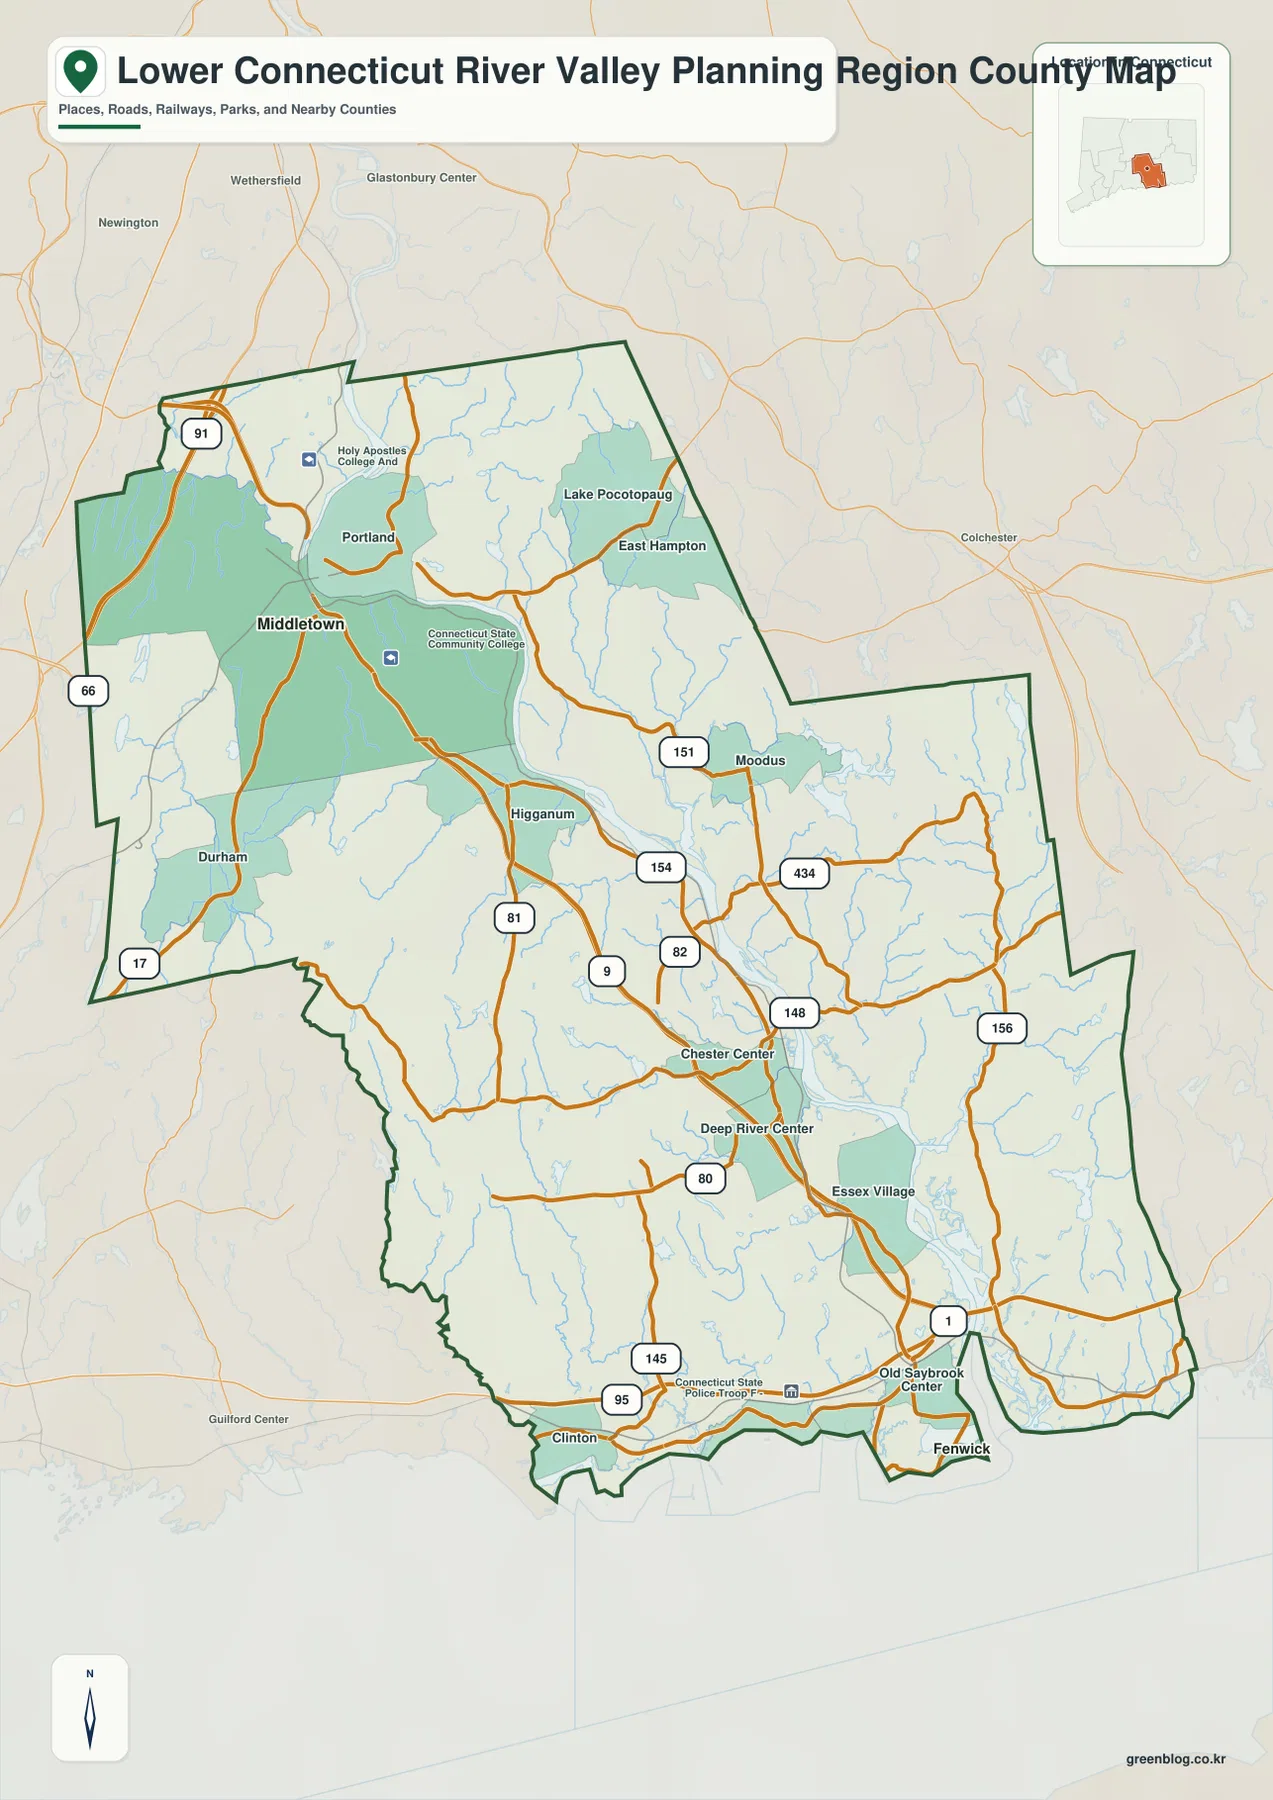
The boundary and road map is the best starting point when you need the entire region in one view. Middletown and Portland anchor the northern river area, East Hampton occupies the northeastern side, and the outline extends south through Haddam, Chester, Deep River, and Essex before reaching Old Saybrook and the coast. Nearby labels such as Wethersfield, Glastonbury Center, Colchester, and Guilford Center appear outside the boundary, which helps place the region in relation to other parts of central and southeastern Connecticut.
Route 9 is one of the clearest transportation features on the map. It runs south from the Middletown area and stays close to the lower Connecticut River corridor before reaching the shoreline network. Near the coast, I-95 and U.S. Route 1 form the major east-west links. Inland routes such as 17 and 81 appear on the western side, while Routes 82, 154, 148, and 156 connect communities closer to the river and eastern part of the region. The map is useful because these roads can be compared directly with the river, town centers, and the irregular planning-region boundary.
The settlement pattern is easier to understand when roads and waterways are viewed together. Middletown sits where several routes converge near a major bend in the river. Farther south, Chester Center, Deep River Center, and Essex Village are smaller centers close to the lower river corridor. Old Saybrook lies where the river mouth and coastal transportation routes meet. This does not mean every community is centered on a highway or on the river, but the map clearly shows how transportation and water features provide recurring reference points from north to south.
Green areas and blue stream lines fill much of the space between the named centers. That makes the map useful for broad regional orientation, but it should not be treated as a legal parcel, park-boundary, zoning, or ownership map. If a project depends on an exact municipal property line, regulated wetland, conservation easement, or road right-of-way, use the relevant town or Connecticut state source instead. This page is intended as a readable regional map and downloadable graphic reference.
Why Middletown and tiny Fenwick stand out on the city index
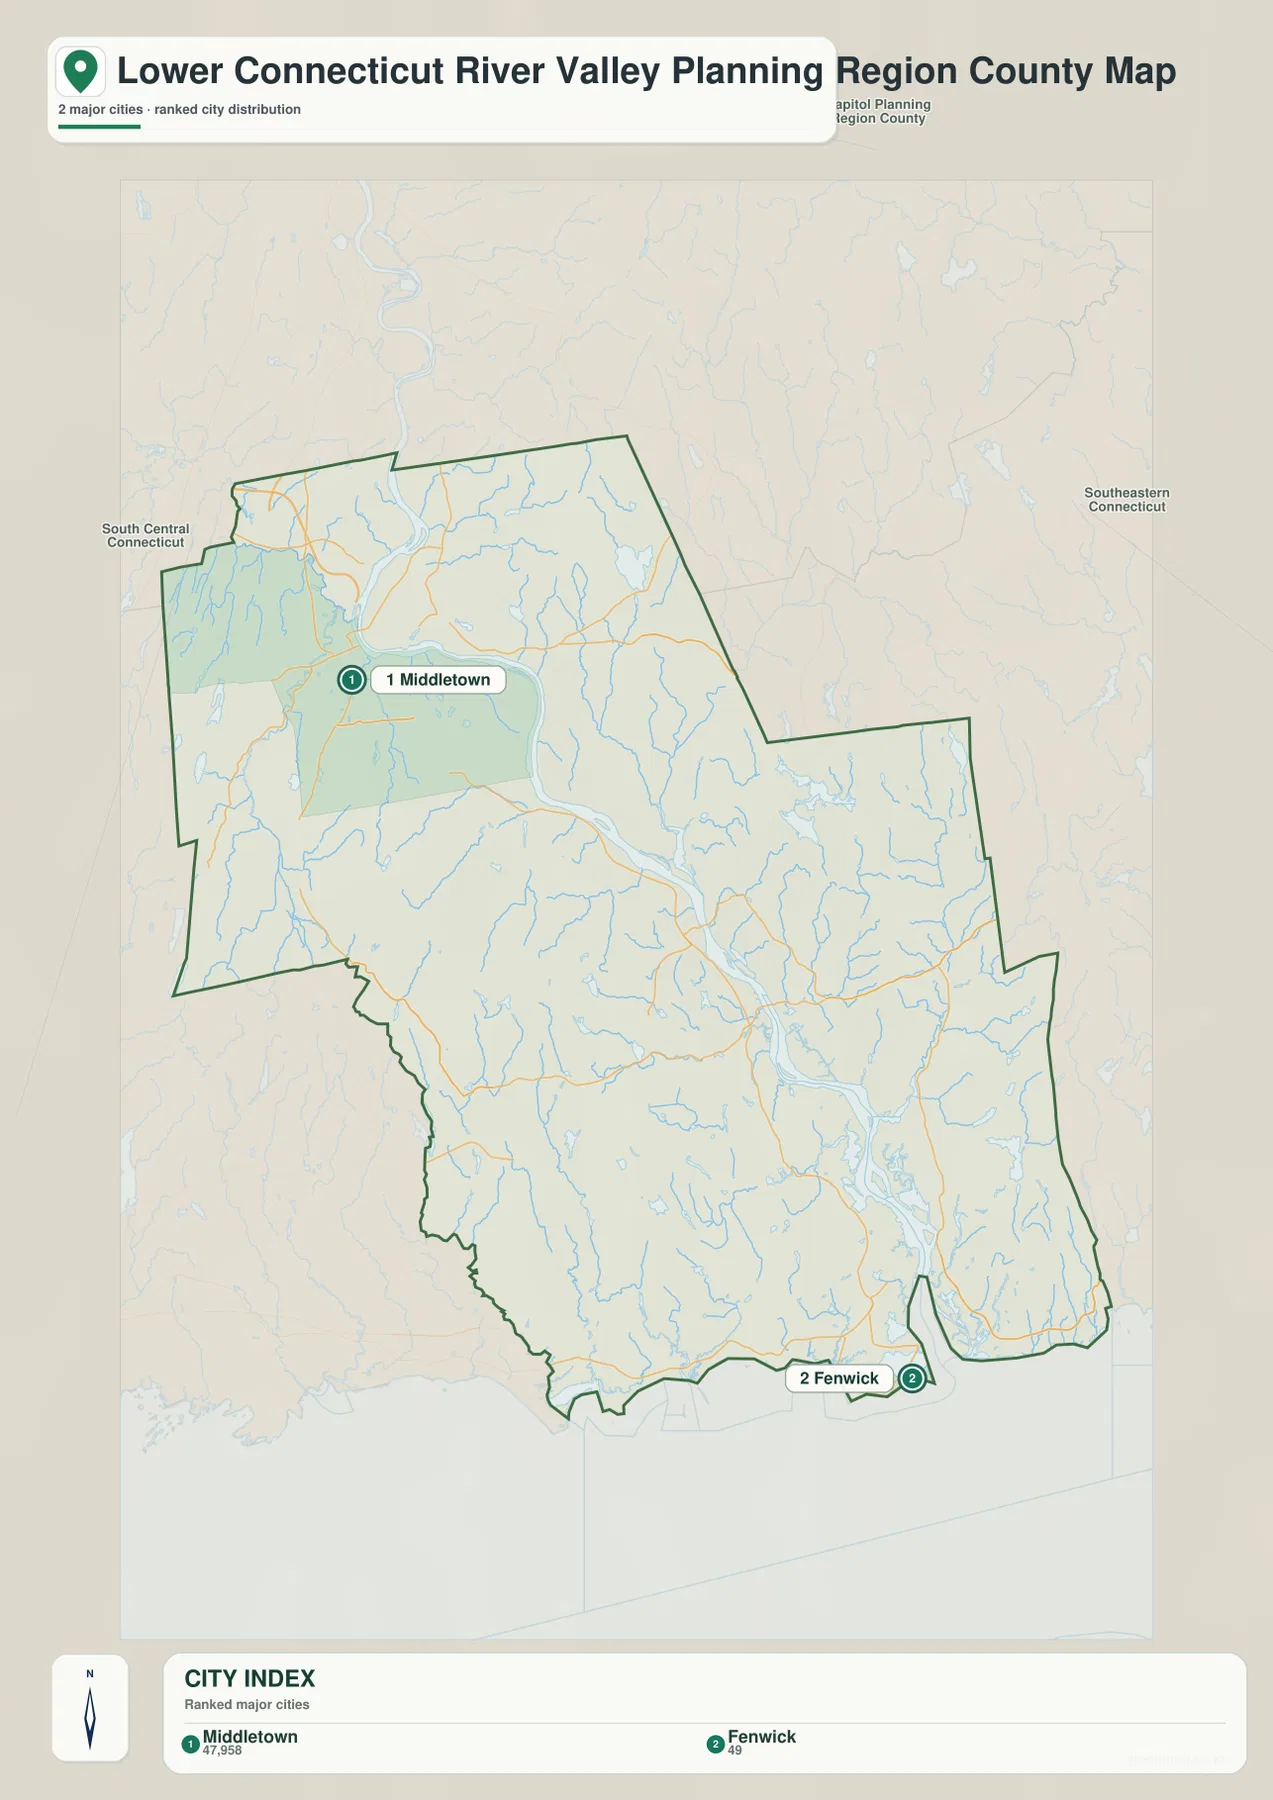
The city map has a much simpler purpose than the boundary map. Its ranked index highlights Middletown at 47,958 and Fenwick at 49. Those values come from the supplied map’s city index and should not be read as a complete population ranking of all seventeen RiverCOG municipalities. Instead, the map creates a striking geographic contrast between a substantial inland city near the northern part of the region and a very small incorporated borough at the southern river mouth.
Middletown is easy to recognize even without many labels. It sits west of the Connecticut River where the main channel bends through the northern section of the planning region. On the road map, Route 9 and other roads converge around this area. On the city map, Middletown becomes the dominant indexed place, giving readers a practical northern anchor before they follow the river south toward Haddam, Chester, Essex, and Old Saybrook.
Fenwick appears at the opposite end of the region. It is located on the coast near the Connecticut River mouth within the Town of Old Saybrook. Connecticut records identify Fenwick as a borough, which explains why it can appear as a separate incorporated place on a city-oriented map while Old Saybrook remains the RiverCOG member municipality. This distinction is useful when comparing maps because a place index, a municipal membership list, and a county-equivalent boundary do not always organize geography in exactly the same way.
Several important community centers between Middletown and Fenwick are not part of the two-place index. Chester, Deep River, Essex, Old Saybrook, East Haddam, and other towns remain essential to understanding the region even when they are not ranked on this particular map. For a classroom presentation, the city map works well when the goal is to show the north-to-south contrast quickly. For a fuller explanation of where communities and roads sit, pair it with the regional boundary map rather than treating the index as a complete urban hierarchy.
The Connecticut River, tributaries, and the transition to the coast
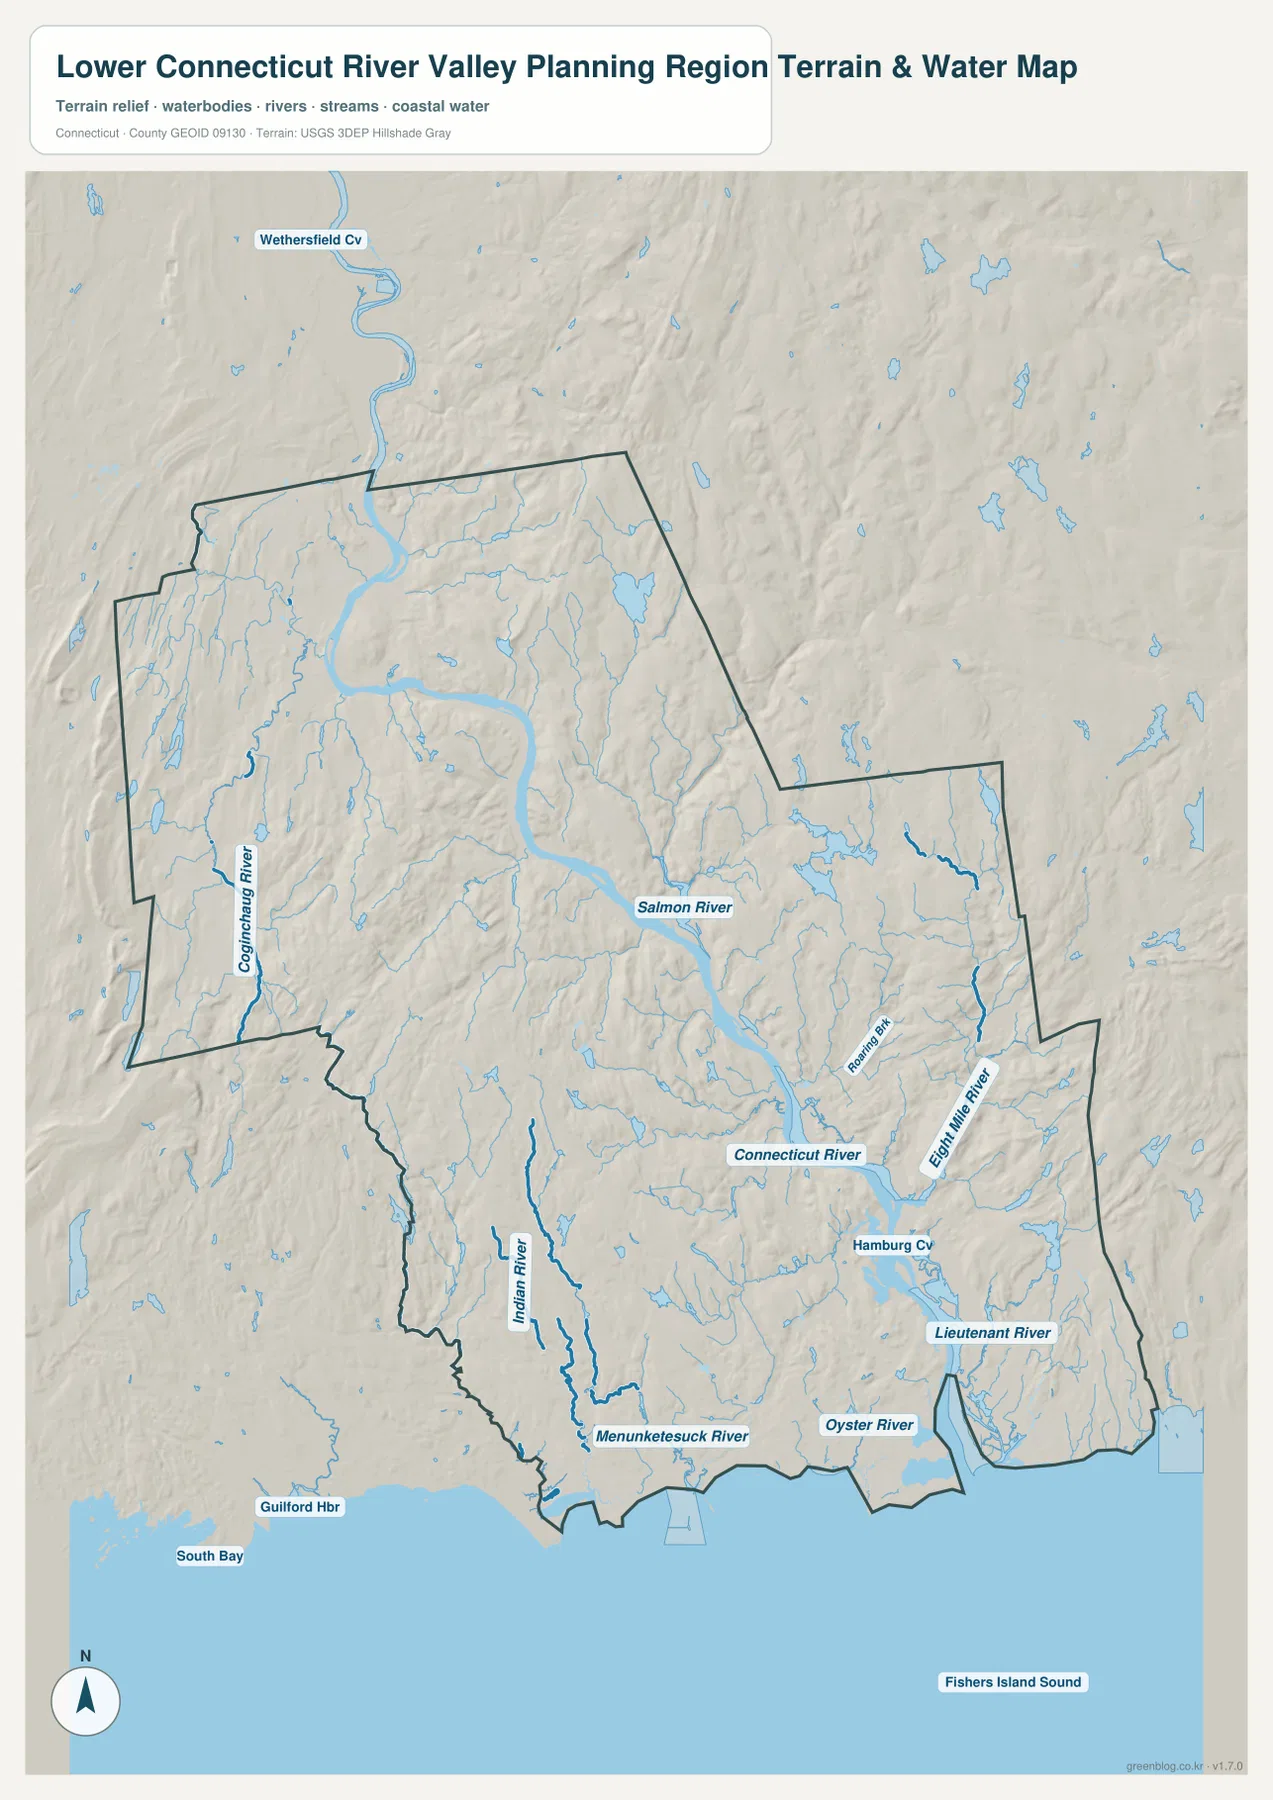
The terrain and water map makes the region’s name immediately understandable. The Connecticut River is drawn as the dominant channel from north to south. It widens and curves through the center of the planning region before reaching the estuary. Smaller streams branch into it from both sides, while separate coastal rivers drain directly toward Long Island Sound. Because the waterways are placed over shaded relief, readers can also see the broad difference between lower river and coastal ground and the more broken inland hills.
On the eastern side, Salmon River joins the Connecticut River in the central part of the region. Farther southeast, Roaring Brook and the Eight Mile River are labeled within a dense network of smaller streams. On the western and southwestern side, Indian River is one of the clearer named waterways. Near the coast, the Menunketesuck River and Oyster River run toward the Sound, while the Lieutenant River is shown east of the Connecticut River mouth. These names make the map more useful than a simple outline because they connect individual valleys to the larger river and shoreline system.
Hamburg Cove is another useful landmark near the lower Connecticut River. Outside the planning-region boundary, labels such as Guilford Harbor, South Bay, Wethersfield Cove, and Fishers Island Sound add wider geographic context. Together they show that the region is not an isolated inland watershed. It sits where a major New England river, many smaller tributaries, tidal coves, and the Long Island Sound coast meet. The Connecticut River Gateway Commission specifically focuses on the scenic and ecological character of the lower river from Haddam toward the Sound, which fits the broad landscape visible here.
The shaded terrain should be read as a visual guide, not as survey-grade elevation data. Land close to the main river and shoreline appears generally lower and smoother, while the interior on both sides of the river shows repeated ridges and small valleys. That relief helps explain why so many short tributaries are visible. It does not provide precise elevations, slope measurements, flood boundaries, or engineering information. Projects that require those values should use dedicated elevation, flood, hydrographic, or local regulatory datasets.
The water map also has limits that matter near the coast. It is not a navigation chart and does not show safe boating channels, depths, tides, bridge clearances, or hazards. It is not a flood-risk map either. Its strength is regional comparison: following the Connecticut River from the north, seeing which named tributaries join it, identifying the coastal streams, and relating those waterways to the surrounding terrain. For those tasks, the simplified relief and labeled water features are easier to use than the busier road map.
A region that is broader than the river corridor alone
It is tempting to reduce Lower Connecticut River Valley Planning Region to the towns directly touching the Connecticut River, but the full boundary covers more varied geography. Durham and Killingworth extend the region west of the main stem, while Clinton and Westbrook add a shoreline area that drains through smaller coastal rivers. East Hampton and East Haddam spread into the eastern interior, and Lyme and Old Lyme connect inland valleys with the eastern side of the estuary. The maps make these differences clear without requiring a long list of coordinates.
This broader shape is also why the planning-region boundary does not match a simple river watershed. Some streams shown on the western side reach the coast separately from the Connecticut River, and the eastern side contains tributary basins with their own local valleys. The region is a governmental planning geography built from member municipalities, not a hydrologic unit. When a map project is specifically about drainage basins, watersheds, or water quality, the correct watershed boundary should be used instead of assuming that the planning-region outline follows every drainage divide.
Neighboring planning regions help provide another frame of reference. The region meets South Central Connecticut to the west, Southeastern Connecticut to the east, and the Capitol Planning Region to the north. The Census Bureau’s current county-equivalent geography reflects those planning-region boundaries rather than the historic eight-county pattern. That matters when comparing recent ACS, TIGER/Line, or other county-level data with older publications that still organize Connecticut by Middlesex, New Haven, New London, or Hartford County.
Choosing the map that fits the question
Use the boundary and road map when the main question is where a place sits in the region. It is the most useful image for locating Middletown, Portland, East Hampton, Chester, Deep River, Essex, Old Saybrook, major road corridors, and nearby communities outside the boundary. It also works well in a report or presentation that needs one regional overview. Because it contains many kinds of information at once, however, smaller tributaries and terrain details are less prominent.
Choose the city index when the contrast between Middletown and Fenwick is the point of the graphic. Its limited labeling keeps the page uncluttered and makes the two indexed places easy to find. The tradeoff is that it should not be used as a complete list of the region’s towns, villages, or population centers. If the audience needs to know all seventeen RiverCOG members, pair the map with the official municipal list rather than adding conclusions that the index was not designed to support.
The terrain and water map is the strongest option for natural geography. It shows the main river, tributaries, coves, smaller coastal rivers, and generalized relief in one image. It is especially useful for explaining why the Connecticut River remains the organizing feature of the region even though the planning boundary extends well beyond the immediate riverbanks. The same map also makes it easy to compare tributaries on opposite sides of the river and to see the transition from inland valleys to the shoreline.
All three on-page images are optimized for viewing in a browser. The ZIP below contains the original JPG versions corresponding to those same three maps. Downloading the JPG files is the better choice when you want to print a map, place it in a slide deck, crop a section for a worksheet, or keep an offline reference. Keep the map title and planning-region name visible whenever possible so viewers do not confuse this current Connecticut county-equivalent geography with the state’s former county boundaries.
Frequently Asked Questions
Why is this called a Planning Region instead of a county?
Connecticut’s nine Councils of Governments and planning regions are now used by the U.S. Census Bureau as county-equivalent geographic units. Lower Connecticut River Valley Planning Region is one of them. It can therefore appear in county-level datasets and map workflows, but it should not be confused with a traditional county government. Recent Census geography should be compared with other planning-region data rather than assumed to match the former Middlesex or New London County boundaries.
Which map is best for following the Connecticut River and its tributaries?
The terrain and water map is the clearest choice. It emphasizes the Connecticut River and labels waterways such as Salmon River, Eight Mile River, Indian River, Menunketesuck River, Oyster River, and Lieutenant River. Use the regional boundary map beside it if you also need roads and community names. Neither image is a flood map or navigation chart, so specialized water-safety or regulatory questions require official datasets.
Why does the city map highlight Fenwick separately from Old Saybrook?
The supplied city index treats Fenwick as a separate incorporated place and labels it near the Connecticut River mouth. Connecticut records identify Fenwick as a borough within the Town of Old Saybrook. RiverCOG’s seventeen-member list uses Old Saybrook as the member municipality, so the city index and the regional membership list are describing different geographic concepts. The map is useful for place comparison, not for reconstructing the full municipal membership structure.
Map File Information
The ZIP contains the original high-resolution JPG versions of the regional boundary and roads map, city index map, and terrain and water map discussed on this page.
- Included Files: 3 JPG maps
Related Maps
Sources and References
- Lower Connecticut River Valley Council of Governments (RiverCOG) – official regional overview and the seventeen member municipalities
- U.S. Census Bureau TIGER/Line Shapefiles – current county-equivalent and planning-region geography for Connecticut
- USGS National Hydrography – official hydrography reference for rivers, streams, and water features
- Connecticut River Gateway Commission – regional information on the scenic and ecological lower Connecticut River valley
Green Map creates custom-edited map images using open geographic data sources such as geoBoundaries, Natural Earth, OpenStreetMap, and government open data.
These maps are edited visual materials, not raw data files, and are provided for education, documents, presentations, and graphic reference.