Renewables account for almost none of electricity generation in some systems and essentially all generation in others. The IRENASTAT source table contains 232 rows for 2023, including ten regional or global aggregates such as World, Africa and Europe. Removing those aggregates leaves 222 country and area observations. Their median renewable electricity share is 25.54% and their unweighted mean is 36.70%. The Republic of Korea records 7.76% and ranks 176th. IRENA’s separate World aggregate is 29.89%, which should not be confused with the equal-weight country mean.
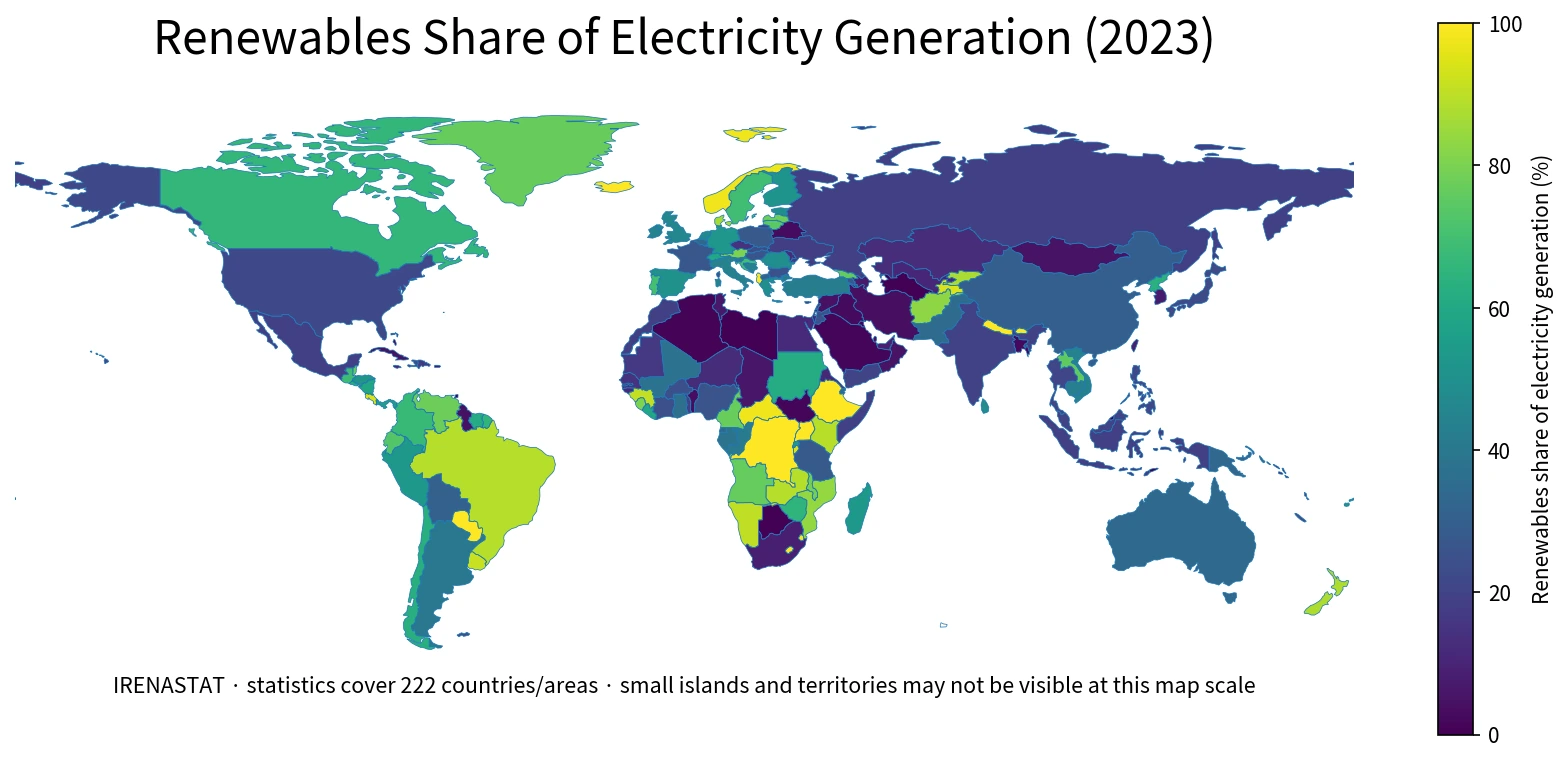
Table of Contents
This indicator asks what share of electricity generation came from renewables
The IRENASTAT indicator is RE share of electricity generation (%). It compares electricity generated from renewable sources with total electricity generation in the same country or area. The renewable side includes technologies such as hydropower, solar, wind, geothermal and bioenergy. It is therefore not a wind-and-solar-only measure, and it is not the renewable share of installed power capacity.
The inclusion of hydropower is especially important. This article is different from a non-hydro renewable electricity measure. A hydro-dominated system can have a very high total renewable generation share even if wind, solar, geothermal and bioenergy excluding hydro account for a much smaller portion. The two indicators answer complementary questions rather than serving as interchangeable versions of the same statistic.
The median is 25.54%, and 70 of 222 observations are at or above 50%
Across the 222 country and area observations, the median is 25.54%. The first quartile is 10.41% and the third quartile is 60.66%, placing the middle half between roughly 10.4% and 60.7%. 70 observations are at or above 50%, 40 are at or above 75%, and 55 are below 10%.
| 2023 renewable generation share | Countries/areas | Share of 222 |
|---|---|---|
| <10% | 55 | 24.8% |
| 10–<25% | 56 | 25.2% |
| 25–<50% | 41 | 18.5% |
| 50–<75% | 30 | 13.5% |
| 75–<90% | 19 | 8.6% |
| 90–100% | 21 | 9.5% |
The distribution spans every major band from below 10% to 90–100%. The unweighted mean of 36.70% is about eleven percentage points above the median because the upper tail contains many systems close to 100%. This mean gives the same statistical weight to a very large power market and a small island system, so it is useful for describing the cross-country distribution but not for describing the composition of world electricity generation.
Six observations report 100% renewable electricity generation
Albania, Bhutan, Ethiopia, Iceland, Nepal and Paraguay each report 100.00% in the 2023 IRENASTAT table. The Democratic Republic of the Congo is 99.95%, Lesotho 99.83%, Uganda 99.72%, Eswatini 98.99%, Norway 97.67%, and the Central African Republic 97.46%. A 100% value describes the composition of that electricity system. It does not mean that the country produced 100% of the world’s renewable electricity.
| Highest country/area observations | 2023 renewable generation share |
|---|---|
| Albania | 100.00% |
| Bhutan | 100.00% |
| Ethiopia | 100.00% |
| Iceland | 100.00% |
| Nepal | 100.00% |
| Paraguay | 100.00% |
| Democratic Republic of the Congo (the) | 99.95% |
| Lesotho | 99.83% |
| Uganda | 99.72% |
| Eswatini | 98.99% |
| South Georgia and the South Sandwich Islands | 98.96% |
| Norway | 97.67% |
| Central African Republic (the) | 97.46% |
| Burundi | 95.62% |
| Costa Rica | 94.96% |
Share and scale must be kept separate. A small electricity system at 100% can produce fewer renewable terawatt-hours than a very large system at 30%. Comparing absolute renewable generation requires total generation volumes or renewable generation in GWh or TWh, which are different variables from the percentage used here.
Korea is 7.76%, ranking 176th among 222 countries and areas
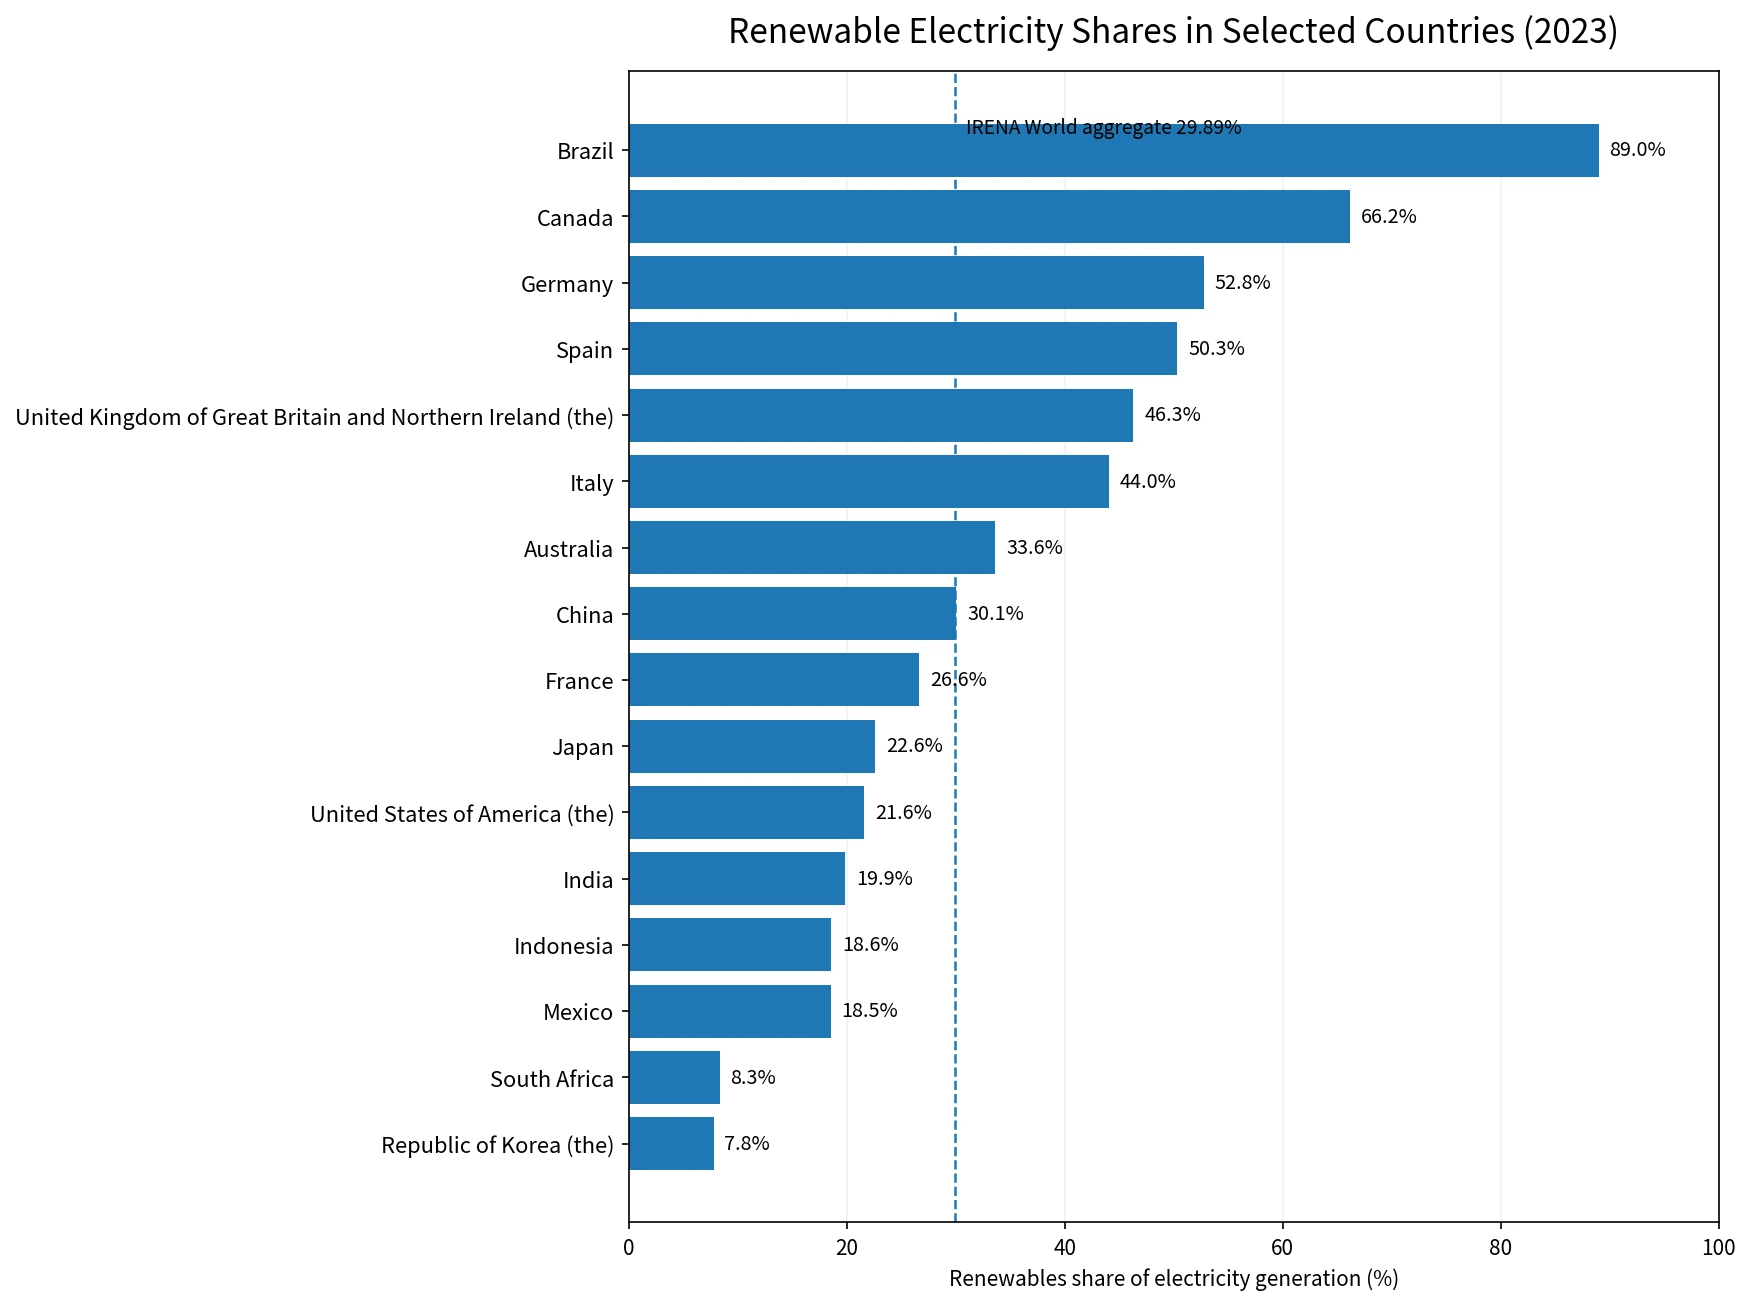
The Republic of Korea records 7.76% in 2023 and ranks 176th when the 222 country and area observations are ordered from highest to lowest. Brazil is 88.99%, Canada 66.17%, Germany 52.77%, Spain 50.30%, the United Kingdom 46.30%, and Italy 44.03%. Australia is 33.60%, China 30.06%, France 26.62%, Japan 22.59%, the United States 21.61%, India 19.86%, Indonesia 18.55%, Mexico 18.52%, and South Africa 8.32%.
| Selected country | 2023 share | Rank of 222 |
|---|---|---|
| Brazil | 88.99% | 24 |
| Canada | 66.17% | 48 |
| Germany | 52.77% | 64 |
| Spain | 50.30% | 69 |
| United Kingdom of Great Britain and Northern Ireland (the) | 46.30% | 77 |
| Italy | 44.03% | 80 |
| Australia | 33.60% | 97 |
| China | 30.06% | 104 |
| France | 26.62% | 108 |
| Japan | 22.59% | 122 |
| United States of America (the) | 21.61% | 124 |
| India | 19.86% | 134 |
| Indonesia | 18.55% | 139 |
| Mexico | 18.52% | 141 |
| South Africa | 8.32% | 174 |
| Republic of Korea (the) | 7.76% | 176 |
Why the IRENA World aggregate is 29.89% while the country mean is 36.70%
The source table includes both country/area rows and official aggregate rows. IRENASTAT reports a 2023 World value of 29.89%. By contrast, taking the 222 country and area observations and giving each one equal weight produces a simple mean of 36.70%. Those numbers answer different questions. The World row is IRENA’s aggregate for global electricity generation, while the simple mean describes the average position of national and territorial percentage observations.
For a statement about the renewable share of world electricity generation, the source-provided World aggregate of 29.89% is the appropriate figure from this table. The 36.70% country mean should not be relabeled as the global generation share because it gives a small power system the same weight as China or the United States. The median of 25.54% is different again: it identifies the midpoint of the country/area distribution.
Generation share and installed-capacity share are different measures
IRENASTAT publishes renewable shares for both electricity generation and installed capacity. This package uses the generation indicator. Installed capacity describes the rated output of power plants and other generating equipment, while generation measures electricity actually produced over the year. Capacity factors, hydrological conditions, maintenance, demand, curtailment and technology mix can all cause the two shares to differ.
A country can therefore have a renewable capacity share of one value and a renewable generation share that is substantially higher or lower without either figure being wrong. Every map, rank and comparison in this article refers to the generation share only.
Renewable electricity share is also different from renewables in total final energy consumption
Electricity is only one part of final energy use. Transport fuels, industrial heat, building heat and other non-electric uses can materially change the renewable share of total final energy consumption. A country with a high renewable electricity share can therefore have a much lower renewable share across all final energy use. The denominator and policy question are different, so the two indicators should not be merged into one ranking.
Data source and calculation method
The data come from the International Renewable Energy Agency’s IRENASTAT renewable energy share table. The observation year in the supplied dataset is 2023. The source contains 232 rows in total. Ten global or regional aggregate rows are separated from the ranking, leaving 222 country and area observations for the map, distribution statistics and ranks. The World row at 29.89% is retained separately as the source-provided global aggregate.
Frequently Asked Questions
What share of world electricity generation came from renewables in 2023?
IRENASTAT reports a World aggregate of 29.89% for 2023. This is different from the 36.70% unweighted mean across 222 country and area observations.
What was Korea’s renewable electricity generation share in 2023?
The Republic of Korea records 7.76% and ranks 176th among the 222 country and area observations after aggregate rows are excluded.
Does the indicator include hydropower?
Yes. It is the total renewable share of electricity generation, including hydropower as well as renewable technologies such as wind, solar, geothermal and bioenergy.
Is renewable generation share the same as renewable capacity share?
No. Generation share measures electricity actually produced, while capacity share measures installed generating capacity. Capacity factors and operating conditions can make the two percentages differ.
Related Articles
- Global Hydroelectricity Share Map | 2021 Country Comparison
- Fossil-Fuel Electricity Share by Country | 2021 Map
- Natural Gas Electricity Share Map | 2021 Country Comparison
Green Map creates custom-edited map images using open geographic data sources such as geoBoundaries, Natural Earth, OpenStreetMap, and government open data.
These maps are edited visual materials, not raw data files, and are provided for education, documents, presentations, and graphic reference.