Secondary education is not organized around the same balance of general and vocational programmes in every country. Some systems keep most students in general education, while others place a much larger share in technical and vocational pathways. World Bank indicator SE.SEC.ENRL.VO.ZS measures the share of all students enrolled in secondary education who are enrolled in vocational programmes.
The full latest-observation table contains 208 countries and separately reported areas, but observation years range from 1971 to 2020. To avoid treating decades-old values as current, the main map and comparisons use only the 125 observations dated 2018–2020. The median in this recent subset is 11.4% and the unweighted mean is 15.5%.
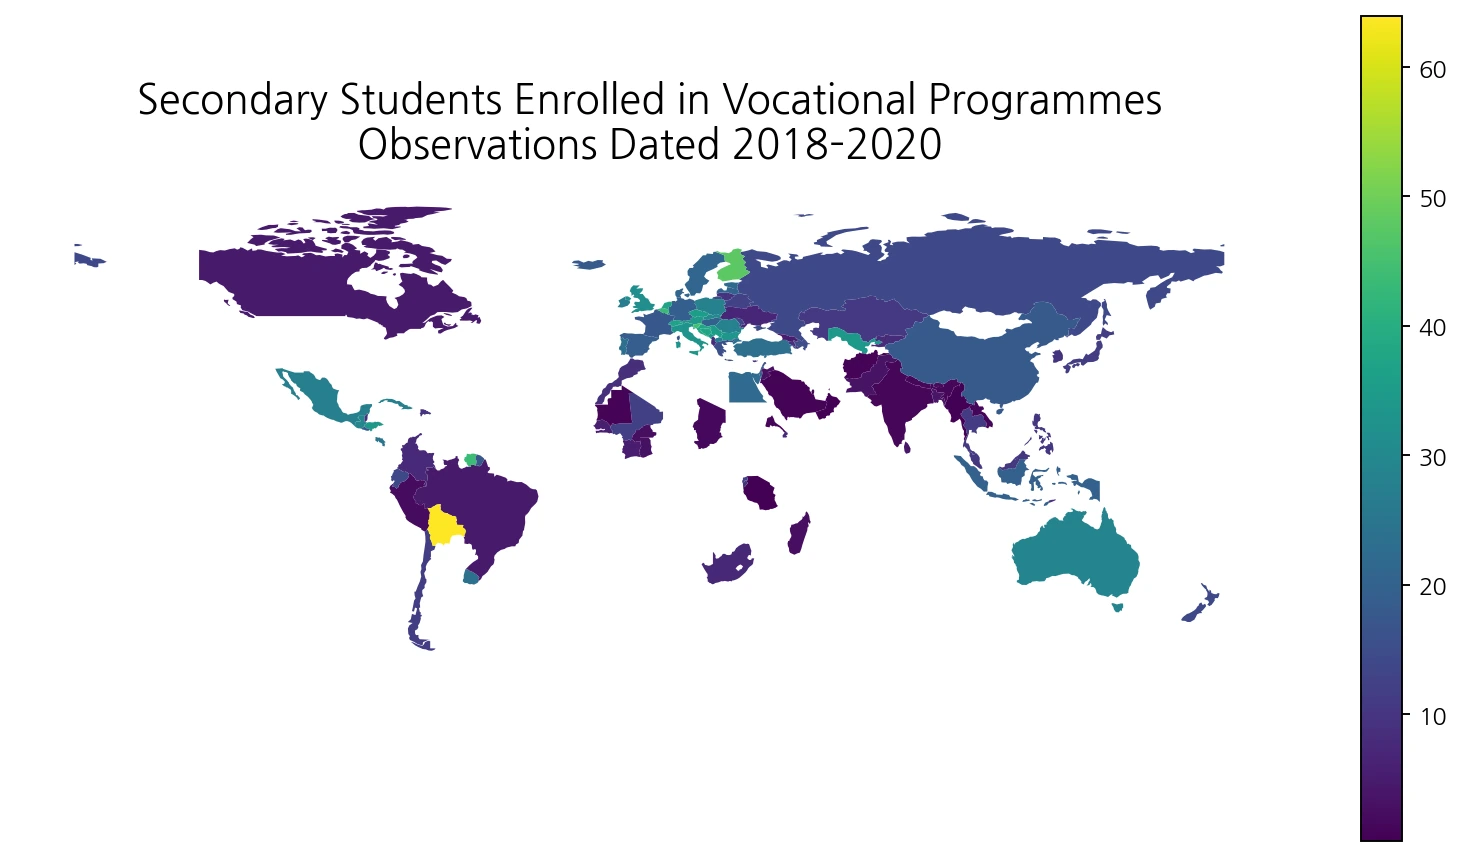
Table of Contents
The indicator measures vocational enrolment as a share of all secondary students
The numerator is the number of students enrolled in vocational programmes at the secondary level. The denominator is total secondary enrolment across vocational and general programmes. A value of 20% therefore means roughly one in five secondary students is enrolled in a vocational programme. It does not mean 20% of the entire youth population is in vocational education, and it is not a measure of adult job training.
UNESCO describes vocational education as education designed to give learners knowledge, skills, and competencies for particular occupations or trades. Programmes may include work-based components such as apprenticeships, and successful completion can lead to qualifications recognized as occupationally oriented by national authorities or the labour market. National programme names differ, so the international category should not be reduced to one specific school type in any single country.
The median across 125 recent observations is 11.4%
Across the 125 observations dated 2018–2020, the median is 11.4% and the unweighted mean is 15.5%. The middle half lies between about 4.4% and 23.9%. There are 39 observations at or above 20%, 21 at or above 30%, and 5 at or above 40%.
| 2018–2020 vocational-enrolment share | Countries/areas | Share of 125 |
|---|---|---|
| Below 1% | 11 | 8.8% |
| 1% to <5% | 22 | 17.6% |
| 5% to <10% | 23 | 18.4% |
| 10% to <20% | 30 | 24.0% |
| 20% to <30% | 18 | 14.4% |
| 30% to <40% | 16 | 12.8% |
| 40% or more | 5 | 4.0% |
The 15.5% mean is not a student-weighted global rate. India and Finland each contribute one country observation despite having very different numbers of secondary students. A global share of all secondary students would require weighting each country by secondary enrolment. The mean and median here are used only to describe how the country-level observations are distributed.
Bolivia is highest at 63.9%, while Finland and Slovenia exceed 40%
Bolivia has the highest observation in the 2018–2020 subset at 63.9% in 2018. Finland is 47.8%, Slovenia 44.6%, Suriname 43.5%, and Belgium 43.3%, all in 2018. Croatia is 38.4%, Bosnia and Herzegovina 37.8%, the Netherlands 37.4%, Switzerland 36.9%, and Czechia 35.5%.
| Country/area | Observation year | Vocational share of secondary enrolment |
|---|---|---|
| Bolivia | 2018 | 63.9% |
| Finland | 2018 | 47.8% |
| Slovenia | 2018 | 44.6% |
| Suriname | 2018 | 43.5% |
| Belgium | 2018 | 43.3% |
| Croatia | 2018 | 38.4% |
| Bosnia and Herzegovina | 2019 | 37.8% |
| Netherlands | 2018 | 37.4% |
| Switzerland | 2018 | 36.9% |
| Czechia | 2018 | 35.5% |
| Serbia | 2019 | 35.5% |
| Austria | 2018 | 34.5% |
| Uzbekistan | 2019 | 34.2% |
| Honduras | 2019 | 34.1% |
| Montenegro | 2019 | 33.8% |
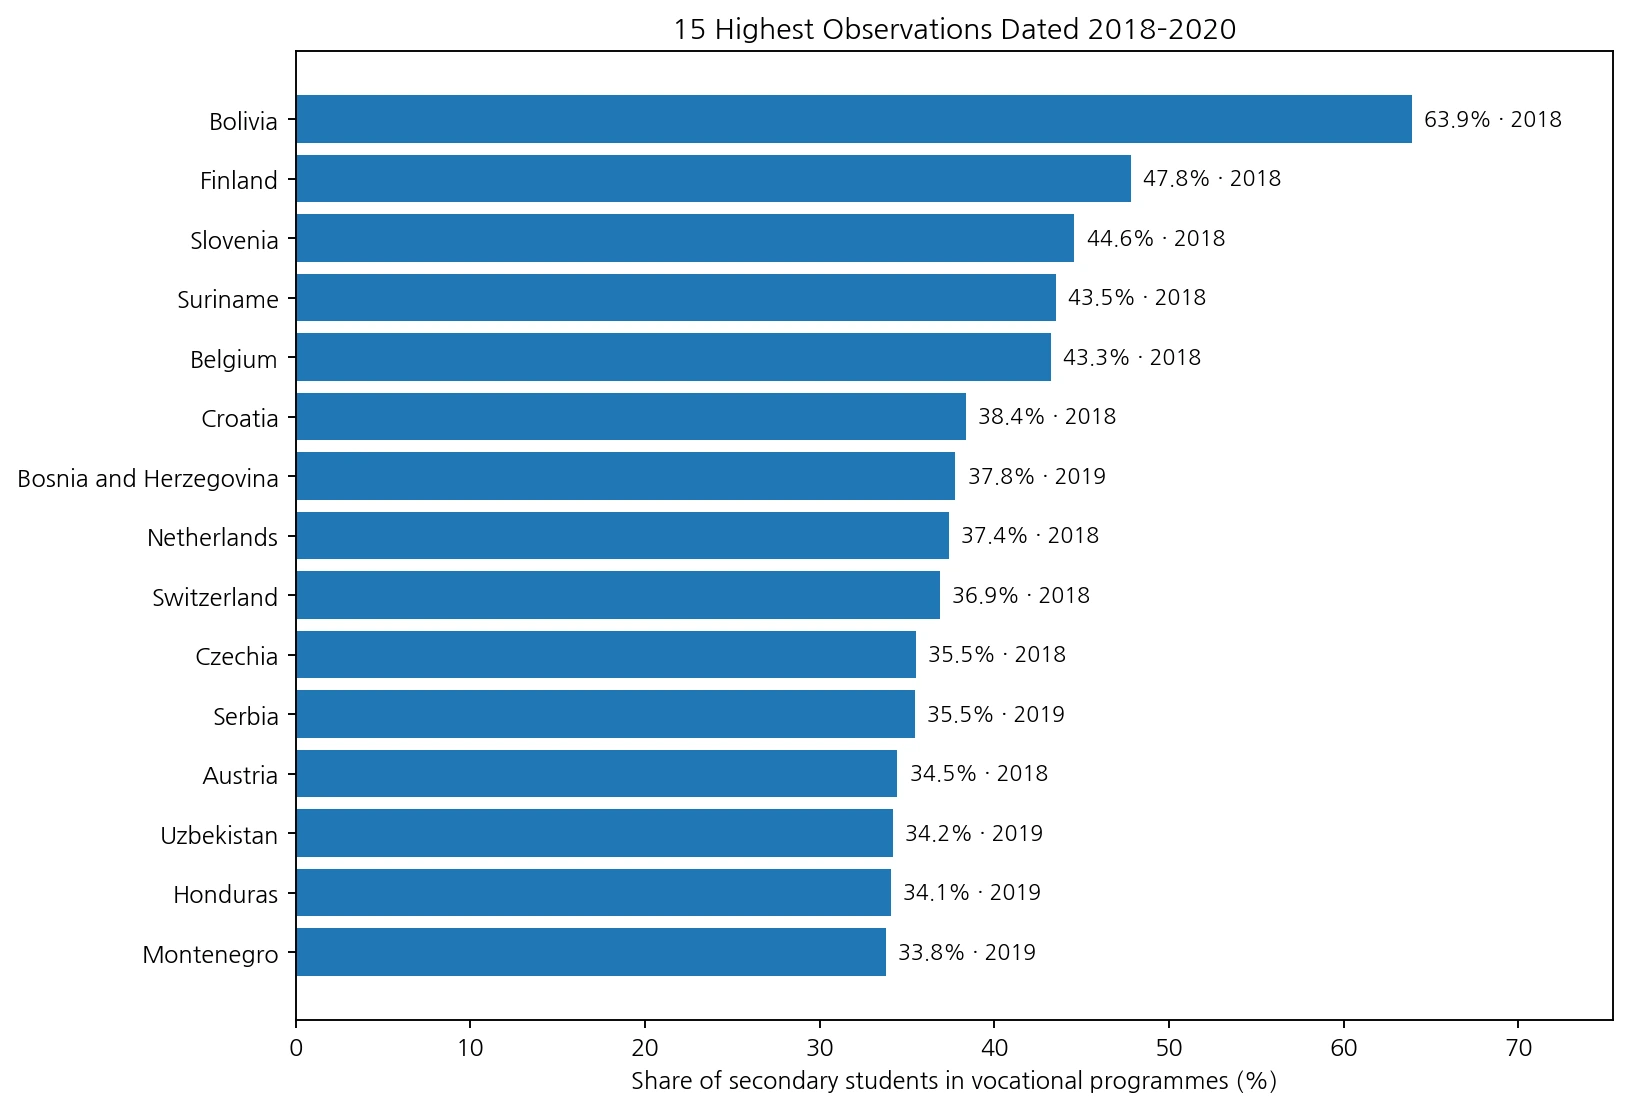
European countries appear frequently near the top, but the highest value belongs to Bolivia in South America. Suriname and Honduras also have relatively high shares. The pattern therefore should not be summarized as a purely European model. National education structures differ substantially even within the same region.
Korea is 9.4%, Japan 11.4%, China 18.1%, and India 1.3%
Among selected large economies, Korea is 9.4% in 2018, Japan 11.4% in 2018, China 18.1% in 2019, India 1.3% in 2019, and Indonesia 19.7% in 2018. Germany is 19.2%, France 17.6%, the United Kingdom 31.8%, Canada 4.6%, and Australia 28.9%. Brazil is 4.4%, while Mexico is 27.7%.
| Country | Observation year | Vocational share of secondary enrolment |
|---|---|---|
| Korea, Rep. | 2018 | 9.4% |
| Japan | 2018 | 11.4% |
| China | 2019 | 18.1% |
| India | 2019 | 1.3% |
| Indonesia | 2018 | 19.7% |
| Germany | 2018 | 19.2% |
| France | 2018 | 17.6% |
| United Kingdom | 2018 | 31.8% |
| Canada | 2018 | 4.6% |
| Australia | 2018 | 28.9% |
| Brazil | 2018 | 4.4% |
| Mexico | 2018 | 27.7% |
| Finland | 2018 | 47.8% |
| Belgium | 2018 | 43.3% |
| Netherlands | 2018 | 37.4% |
| Austria | 2018 | 34.5% |
| Switzerland | 2018 | 36.9% |
| Poland | 2018 | 28.1% |
| Czechia | 2018 | 35.5% |
| Thailand | 2019 | 11.2% |
These values are not a ranking of education quality. A high vocational share mainly indicates that a larger portion of secondary students is placed in programmes classified as vocational or technical. Countries differ in when tracking begins, how easily students can move between general and vocational routes, how apprenticeships are organized, and whether vocational qualifications provide access to tertiary education.
A very low share does not prove that vocational education is absent
Among positive recent observations, Myanmar is 0.18% in 2018, Oman 0.38% in 2019, Tanzania 0.38% in 2019, Afghanistan 0.71% in 2018, and Mauritania 0.73% in 2019. Saudi Arabia is 0.76%, Qatar 0.87%, West Bank and Gaza 0.92%, and Lao PDR 0.95%. Comoros in 2018 and Dominica in 2019 are reported at 0.0%.
| Country/area | Observation year | Vocational-enrolment share |
|---|---|---|
| Myanmar | 2018 | 0.2% |
| Oman | 2019 | 0.4% |
| Tanzania | 2019 | 0.4% |
| Afghanistan | 2018 | 0.7% |
| Mauritania | 2019 | 0.7% |
| Saudi Arabia | 2019 | 0.8% |
| Qatar | 2019 | 0.9% |
| West Bank and Gaza | 2019 | 0.9% |
| Lao PDR | 2019 | 0.9% |
| Eritrea | 2018 | 1.1% |
| Nepal | 2019 | 1.2% |
| India | 2019 | 1.3% |
A zero or near-zero value should not automatically be interpreted as proof that the country has no vocational education system. The indicator covers vocational programmes classified at the secondary level. Adult training, company-based training, post-secondary vocational programmes, and other skill-development routes may fall outside this measure. National reporting and programme classification also matter.
Even the 2018–2020 subset is not a single-year comparison
The recent subset contains 64 observations from 2018, 59 from 2019, and only two from 2020. The 2020 values are Djibouti at 7.9% and Monaco at 11.4%. Calling this a “2020 world ranking” would therefore be misleading.
Restricting the analysis to 2018–2020 still improves comparability relative to mixing in observations from the 1970s, 1980s, or 1990s. Even so, education systems can change over a few years. Large cross-country differences are more informative than fine rankings based on one or two percentage points.
Forty percent of the 208 latest observations are from 2017 or earlier
Of the 208 latest observations in the source table, 125 are dated 2018–2020, or 60.1%. The remaining 83 are from 2017 or earlier. Twenty-three are from 1971–1999, 17 from 2000–2009, and 43 from 2010–2017. The oldest retained observation is the Faroe Islands in 1971. The United States has a 1996 value of 0.0%, and Viet Nam has a 1990 value of 5.8%.
| Latest observation period | Countries/areas | Share of 208 |
|---|---|---|
| 1971–1999 | 23 | 11.1% |
| 2000–2009 | 17 | 8.2% |
| 2010–2017 | 43 | 20.7% |
| 2018–2020 | 125 | 60.1% |
That is why the United States and Viet Nam are not inserted into the recent country table. Their retained values are useful historical observations, but they are too old to represent current secondary-education structures. An old observation is not necessarily incorrect; it is simply less suitable for a present-day cross-country comparison.
A higher vocational share does not automatically mean better employment outcomes
Vocational education is intended to build labour-market-relevant skills, but enrolment share alone cannot tell us whether graduates find good jobs. Programme quality, employer participation, work-based learning, local industry demand, economic conditions, and recognition of qualifications all matter. A country can have a high vocational share and still face youth unemployment or NEET challenges, while another country may use different training routes outside secondary school.
The map is therefore best used as a first view of how national secondary systems divide students between general and vocational pathways. To evaluate outcomes, it should be paired with completion rates, learning results, youth employment, NEET rates, and evidence on the labour-market outcomes of vocational graduates.
Differences in school systems limit fine-grained country rankings
Secondary education broadly covers lower- and upper-secondary levels under the International Standard Classification of Education, but national school structures and the age at which vocational pathways begin are not identical. In some systems, vocational education is concentrated in upper secondary; in others, it may begin earlier or move into post-secondary institutions.
More detailed indicators, such as the vocational share specifically within upper-secondary education, can help isolate one stage. SE.SEC.ENRL.VO.ZS, however, covers the overall secondary level. For that reason, the figures on this page should not be rewritten as the share of students in one specific national high-school category.
Data source and calculation method
The statistical source is World Bank World Development Indicators series SE.SEC.ENRL.VO.ZS. It measures the number of secondary students enrolled in vocational programmes as a percentage of total secondary enrolment in vocational and general programmes. The underlying source is the UNESCO Institute for Statistics (UIS). UNESCO describes vocational education as programmes oriented toward occupation-specific knowledge, skills, and competencies, sometimes including work-based components.
The main comparison uses the 125 observations dated 2018–2020. The mean and median are unweighted across countries and areas. ISO-3 codes are joined to a Natural Earth low-resolution world layer, producing 105 directly matched polygons. Small islands and separately reported areas may have a statistical value without a visible polygon at this map scale.
The observation set used here extends only through 2020. World Bank and UNESCO UIS education databases can add or revise later years, so readers who need the latest available value for a specific country should check the source pages directly.
- World Bank – Vocational and Technical enrolment (% of total secondary enrolment)
- World Bank Gender Data Portal – Vocational and Technical enrolment
- UNESCO Institute for Statistics – Bulk Data Download Service
Frequently Asked Questions
What does this indicator measure?
It measures the share of all secondary students who are enrolled in vocational or technical programmes.
Does a higher vocational-enrolment share mean a better education system?
No. It describes the balance between vocational and general programmes, not education quality, learning outcomes, or employment success.
Why does the main comparison use 125 observations from 2018–2020 instead of all 208 latest values?
The full latest-value table spans 1971–2020. Restricting the main analysis to 2018–2020 reduces the risk of comparing decades-old education structures as if they were current.
Is the 2018–2020 map a 2020 country ranking?
No. It contains 64 observations from 2018, 59 from 2019, and two from 2020, so it is a recent-period comparison rather than a single-year ranking.
Related Articles
Vocational-enrolment share describes the programme pathway of current secondary students. Adult attainment and the share of youth outside education, employment, and training answer different questions, so the related pages below provide useful context without treating them as the same measure.
- Global Upper-Secondary Educational Attainment Map – Latest Values for Adults 25+
- How Many Adults 25+ Completed Education Beyond Upper Secondary? Recent 2020–2024 Map
- How Many Young People Are Outside Education, Employment and Training? 2025 World Map
Green Map creates custom-edited map images using open geographic data sources such as geoBoundaries, Natural Earth, OpenStreetMap, and government open data.
These maps are edited visual materials, not raw data files, and are provided for education, documents, presentations, and graphic reference.