Birth registration is the official recording of a child’s existence by the state. World Bank series SP.REG.BRTH.Q5.ZS does not describe all children. It measures the percentage of children under age five whose births are registered among households in the highest wealth quintile, Q5. The supplied country-level table contains 105 latest non-missing observations dated from 2006 to 2021.
Across those 105 observations, the median is 95.2% and the unweighted mean is 84.9%. Even within the highest household-wealth group, nine observations are below 50%, while seven are reported at 100%. That wide spread makes the indicator useful for identifying places where birth registration remained incomplete even among relatively advantaged households.
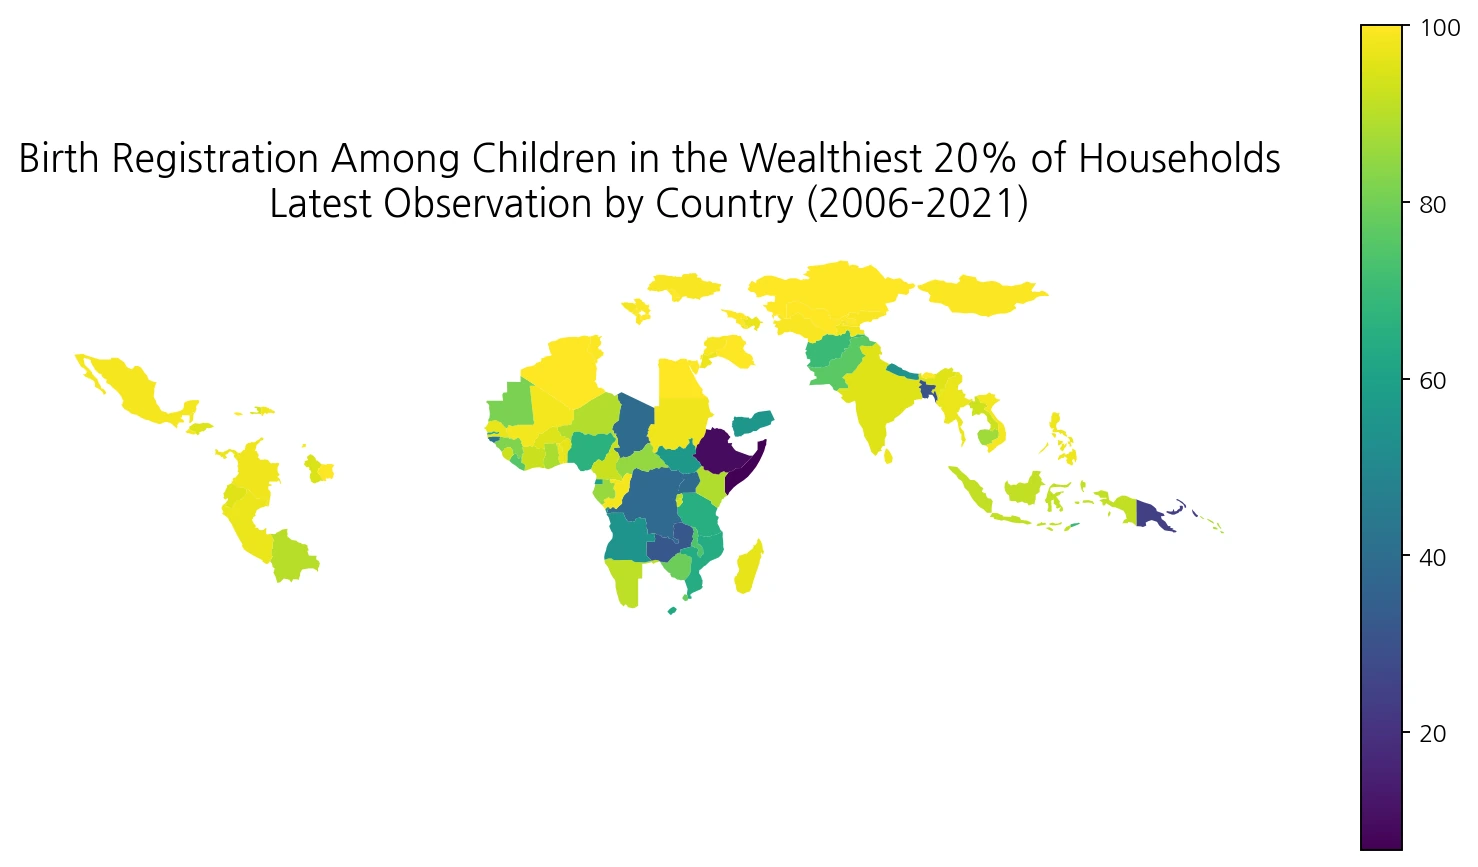
Table of Contents
Q5 means the highest household wealth quintile
Q5 is the fifth and highest group when households are divided into five wealth groups. In DHS and MICS-style household data, wealth quintiles are commonly based on a household wealth index rather than a single reported income figure. The most accurate interpretation is therefore “children in households in the highest wealth quintile,” not “the richest children in the world.”
The quintile is relative within each country. A Q5 household in one country does not necessarily have the same absolute income or assets as a Q5 household in another. The indicator compares birth-registration coverage within each country’s relatively highest household-wealth group.
The measure includes reported registration, not only certificates seen
The World Bank’s general definition of completeness of birth registration is the percentage of children under age five whose births were registered at the time of the survey. The numerator includes children whose birth certificate was seen by the interviewer and children whose mother or caretaker said that the birth had been registered.
This distinction means the indicator is not simply the percentage of children whose caregivers could physically show a birth certificate during an interview. It is a broader registration measure. It also does not by itself prove access to education, health care, social protection, or every other service that may depend on legal identity.
The median latest observation is 95.2%
Giving each country/economy observation equal weight, the median is 95.2% and the mean is 84.9%. Fifty-four observations are at least 95%, and 67 are at least 90%. At the lower end, 23 are below 75% and nine are below 50%.
| Birth-registration rate | Countries/economies | Share of 105 |
|---|---|---|
| Below 50% | 9 | 8.6% |
| 50% to <75% | 14 | 13.3% |
| 75% to <90% | 15 | 14.3% |
| 90% to <95% | 13 | 12.4% |
| 95% to <99% | 31 | 29.5% |
| 99% to <100% | 16 | 15.2% |
| 100% | 7 | 6.7% |
The 84.9% mean is not a population-weighted global registration rate for children in Q5 households. A small country and a very populous country each contribute one observation to this simple average. It is used only to summarize the distribution of country-level values.
The lowest latest observations are Somalia, Ethiopia, and Papua New Guinea
The lowest latest values are Somalia at 6.6% in 2006, Ethiopia at 9.5% in 2016, and Papua New Guinea at 24.2% in 2018. Bangladesh is 30.5% in 2018, Zambia 31.8% in 2018, the Democratic Republic of the Congo 38.4% in 2014, Uganda 38.8% in 2016, and Chad 39.1% in 2015.
| Country/economy | Observation year | Q5 birth registration |
|---|---|---|
| Somalia, Fed. Rep. | 2006 | 6.6% |
| Ethiopia | 2016 | 9.5% |
| Papua New Guinea | 2018 | 24.2% |
| Bangladesh | 2018 | 30.5% |
| Zambia | 2018 | 31.8% |
| Congo, Dem. Rep. | 2014 | 38.4% |
| Uganda | 2016 | 38.8% |
| Chad | 2015 | 39.1% |
| Guinea-Bissau | 2014 | 42.6% |
| Nepal | 2016 | 54.1% |
| Angola | 2016 | 54.9% |
| Yemen, Rep. | 2013 | 55.7% |
| South Sudan | 2010 | 56.5% |
| Equatorial Guinea | 2011 | 60.1% |
| Gambia, The | 2020 | 61.6% |
These rows should not be treated as a current ranking because the observation years differ substantially. A 2006 observation and a 2018 observation describe different points in time. The broad map is best read as a latest-available-observation map, not as a synchronized global snapshot.
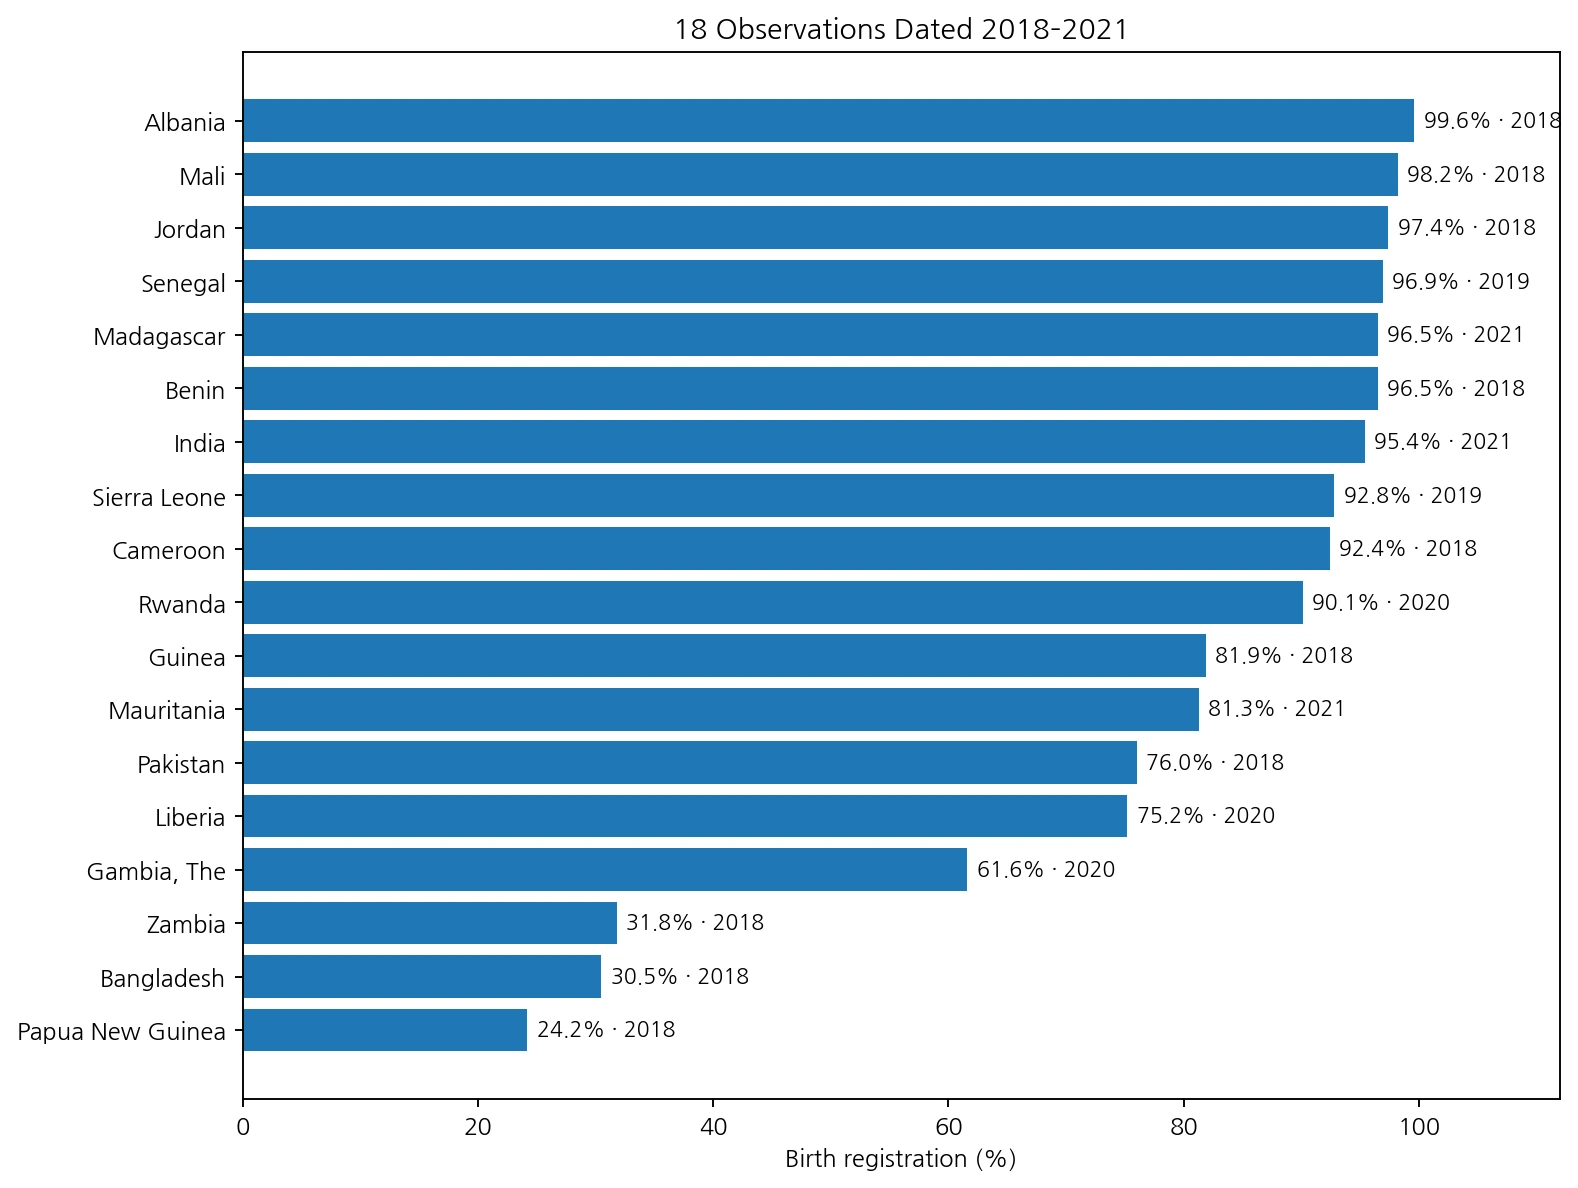
Among observations dated 2018–2021, Papua New Guinea, Bangladesh, and Zambia are lowest
Restricting the table to observations dated 2018–2021 leaves 18 countries. The median in this subset is 91.2% and the unweighted mean is 78.8%. Papua New Guinea is 24.2%, Bangladesh 30.5%, and Zambia 31.8%, all in 2018. The Gambia is 61.6% in 2020, Liberia 75.2% in 2020, and Pakistan 76.0% in 2018.
| Country/economy | Observation year | Birth registration |
|---|---|---|
| Papua New Guinea | 2018 | 24.2% |
| Bangladesh | 2018 | 30.5% |
| Zambia | 2018 | 31.8% |
| Gambia, The | 2020 | 61.6% |
| Liberia | 2020 | 75.2% |
| Pakistan | 2018 | 76.0% |
| Mauritania | 2021 | 81.3% |
| Guinea | 2018 | 81.9% |
| Rwanda | 2020 | 90.1% |
| Cameroon | 2018 | 92.4% |
| Sierra Leone | 2019 | 92.8% |
| India | 2021 | 95.4% |
| Benin | 2018 | 96.5% |
| Madagascar | 2021 | 96.5% |
| Senegal | 2019 | 96.9% |
| Jordan | 2018 | 97.4% |
| Mali | 2018 | 98.2% |
| Albania | 2018 | 99.6% |
At the upper end of the recent subset, India is 95.4% in 2021, Madagascar 96.5% in 2021, Senegal 96.9% in 2019, Jordan 97.4% in 2018, Mali 98.2% in 2018, and Albania 99.6% in 2018. The narrower period improves recency but reduces coverage to only 18 countries, so it should not be labeled a recent global ranking.
A low Q5 value does not identify the cause
It may seem surprising to find low registration coverage in the highest wealth quintile, but the indicator alone cannot explain why. Administrative access, registration procedures, conflict, mobility, legal rules, distance to offices, awareness, and survey methods can all matter. Those explanatory variables are not present in this one series, so causal claims require additional country-specific evidence.
The Q5 label also does not mean that the group has the same absolute wealth everywhere. Wealth quintiles are constructed within countries, which makes the measure useful for within-country socioeconomic stratification but limits simplistic cross-country statements about absolute household resources.
The 2006–2021 spread in observation years is a major limitation
The observation dates are widely distributed. There are 19 observations from 2014, 14 from 2012, ten each from 2015 and 2016, and ten from 2018. Only two are dated 2019 and three each are dated 2020 and 2021. A dataset label that mentions 2021 therefore should not be interpreted as meaning all 105 countries were measured in 2021.
For that reason, this article does not use a title such as “2021 global birth-registration ranking.” The world map is explicitly a latest-observation map, and the more recent 2018–2021 observations are separated into their own chart. A current global comparison would require a newer harmonized source or a sufficiently large common-year subset.
Missing countries are not zero
Only 105 countries and separately reported economies appear in this wealth-quintile series. Countries such as the United States, Korea, Japan, and Germany are not present in the retained table and must not be assigned a value of zero. This is a wealth-disaggregated household-survey indicator, so coverage differs from the general birth-registration series.
Gray areas on the map therefore mean no matched observation in this particular statistical table or no visible low-resolution polygon, not zero birth registration. Keeping missing values separate from measured zero is essential for a map like this.
Data source and interpretation
The statistical source is World Bank SP.REG.BRTH.Q5.ZS, Completeness of birth registration (%): Q5 (highest). The general birth-registration definition covers children under age five whose births were registered at the time of the survey, including cases where a certificate was seen or a mother/caretaker reported registration. The underlying source is UNICEF global databases based on DHS, MICS, other national household surveys, censuses, and vital registration systems.
All summary statistics and rankings are calculated from the 105 latest non-missing country/economy observations dated 2006–2021. ISO-3 codes are joined to a Natural Earth low-resolution world layer, with 95 polygons directly matched. Small islands and separately reported areas can remain in the statistical table without a distinct visible polygon at this scale.
- World Bank – Completeness of birth registration (%): Q5 (highest)
- World Bank Health – Available Indicators
Frequently Asked Questions
What does Q5 (highest) mean?
It is the highest 20% group when households are divided into five wealth quintiles.
Does this indicator cover all children under five?
No. It covers children under five living in households in the highest wealth quintile.
Are only children with a birth certificate seen by the interviewer counted?
No. The measure also includes children whose mother or caretaker says that the birth has been registered.
Can the 105 values be treated as a 2021 country ranking?
No. Observation years range from 2006 to 2021, so the map represents the latest retained observation for each country or economy.
Related Articles
- Tanzania 2022 Demographic and Health Survey Guide
- Global Population Growth Map – 2025 Country Comparison
- Global Population Density Map – 2023 Country Comparison
Green Map creates custom-edited map images using open geographic data sources such as geoBoundaries, Natural Earth, OpenStreetMap, and government open data.
These maps are edited visual materials, not raw data files, and are provided for education, documents, presentations, and graphic reference.