The share of adults who have completed at least primary education varies sharply across countries. World Bank World Development Indicators series SE.PRM.CUAT.ZS measures the percentage of the population age 25 and older that has attained or completed primary education. It is a cumulative educational-attainment measure: adults who went on to lower secondary, upper secondary, vocational, college, or university education are also counted because they have crossed the primary-education threshold.
The latest non-empty observation for each reporting economy produces 199 country and separately reported area rows, but the reference years range from 1980 to 2025. Mexico is the only row dated 2025. 171 observations, or 85.9% of the set, are dated 2019 or later, while 150 are dated 2021 or later. The map should therefore be read as a comparison of each economy’s latest available adult-attainment observation, not as a clean 2025 ranking in which every country was measured in the same year.
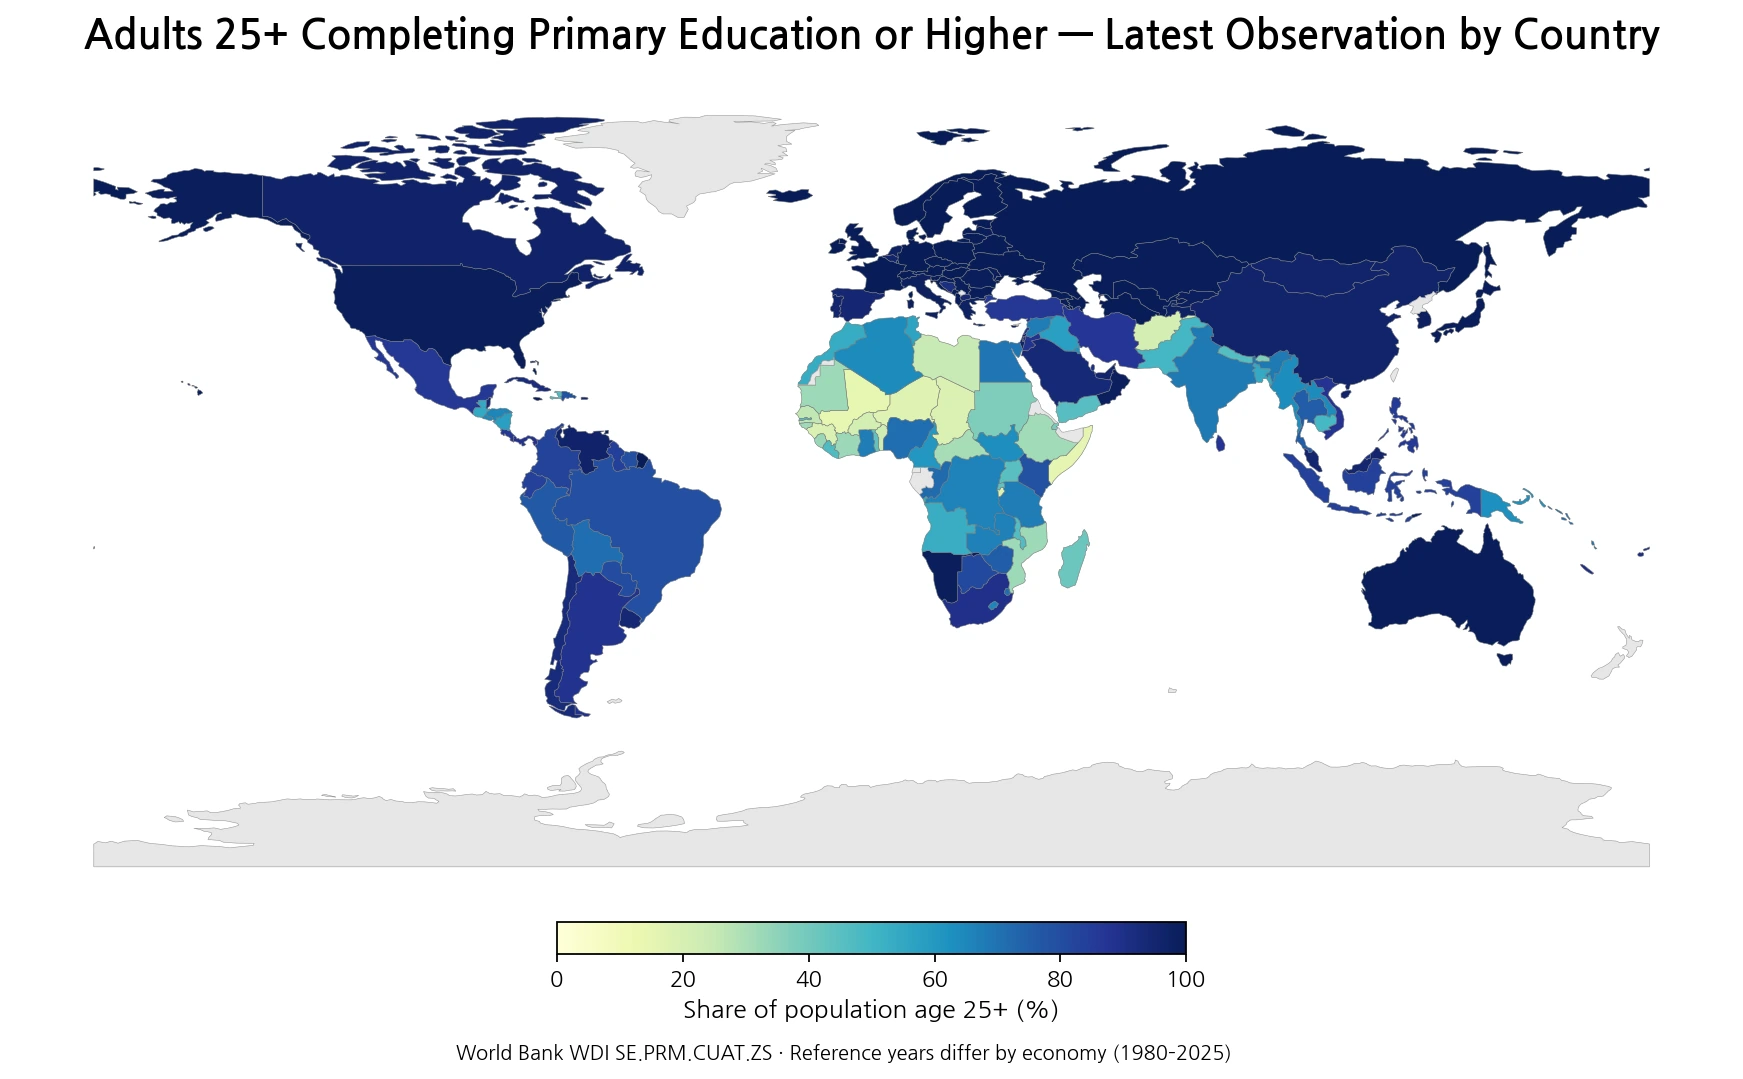
Table of Contents
The indicator measures accumulated adult attainment, not the current primary-school completion rate
The official indicator name is Educational attainment, at least completed primary, population 25+ years, total (%) (cumulative). World Bank metadata defines it as the percentage of the population age 25 and older that attained or completed primary education. The methodology divides the number of people age 25+ who have reached or completed the primary level by the total population in the same age group and multiplies by 100. The underlying source is the UNESCO Institute for Statistics (UIS).
The phrase “at least” is essential. A person who completed university is included because that person necessarily passed the primary-education threshold. A value of 90% therefore means that roughly nine in ten adults age 25+ have completed primary education or a higher level; it does not mean that nine in ten stopped their education at primary school. This cumulative structure makes the series useful for describing the floor of adult educational attainment rather than the exact final credential distribution.
The denominator also makes the series very different from a current school-flow indicator. It does not measure the share of today’s primary-school students who graduate this year, the percentage of children enrolled in school, or the probability that a child entering first grade will complete primary education. Adults from many generations are combined. Historical barriers to schooling can remain visible in the number for decades even after access improves for younger cohorts, while a recent deterioration in school participation may not immediately produce an equally large change in an age-25+ stock measure.
The median across 199 latest observations is 89.8%, but that is not a world-population rate
Across the 199 country and area rows, the median latest observation is 89.8% and the simple unweighted mean is 78.8%. 99 observations are at or above 90%, 77 are at or above 95%, and 35 are below 50%. The distribution has a large high-attainment group and a substantial lower tail, which is why the mean sits well below the median.
| Latest-observation range | Countries/areas | Share of 199 |
|---|---|---|
| Below 25% | 10 | 5.0% |
| 25–<50% | 25 | 12.6% |
| 50–<75% | 31 | 15.6% |
| 75–<90% | 34 | 17.1% |
| 90–<95% | 22 | 11.1% |
| 95–100% | 77 | 38.7% |
These summary statistics describe country rows, not the share of the world’s adult population at each level. A country with hundreds of millions of adults and a small island economy each contribute one row to the unweighted average. The 78.8% mean must therefore not be rewritten as “78.8% of adults in the world completed primary education.” A population-weighted global estimate would require appropriate population weights or an official aggregate designed for that purpose.
Restricting the comparison to 2019 or later still leaves a very wide gap
One way to reduce the influence of very old observations is to examine only values dated 2019 or later. That leaves 171 rows. Their median is 92.5% and their simple mean is 80.6%. Even within this more recent subset, values range from the mid-teens to 100%, so the broad international gap does not disappear when most older observations are removed.
Among observations dated 2019 or later, Mali is at 14.5% in 2022, Somalia at 15.5% in 2022, Niger at 17.5% in 2022, Chad at 18.6% in 2019, Afghanistan at 21.0% in 2022, Burkina Faso at 21.3% in 2024, and Benin at 22.6% in 2022. Senegal is at 25.8% in 2023, the Central African Republic at 30.8% in 2019, and Ethiopia at 31.3% in 2022. These are not same-year league-table positions, because the reference year shown beside each value differs.
| Country | Reference year | Adults 25+ completing primary or higher |
|---|---|---|
| Mali | 2022 | 14.5% |
| Somalia, Fed. Rep. | 2022 | 15.5% |
| Niger | 2022 | 17.5% |
| Chad | 2019 | 18.6% |
| Afghanistan | 2022 | 21.0% |
| Burkina Faso | 2024 | 21.3% |
| Benin | 2022 | 22.6% |
| Senegal | 2023 | 25.8% |
| Central African Republic | 2019 | 30.8% |
| Ethiopia | 2022 | 31.3% |
| Guinea-Bissau | 2022 | 31.7% |
| Mozambique | 2022 | 32.1% |
| Cote d’Ivoire | 2021 | 32.7% |
| Sierra Leone | 2019 | 33.5% |
| Bhutan | 2022 | 37.3% |
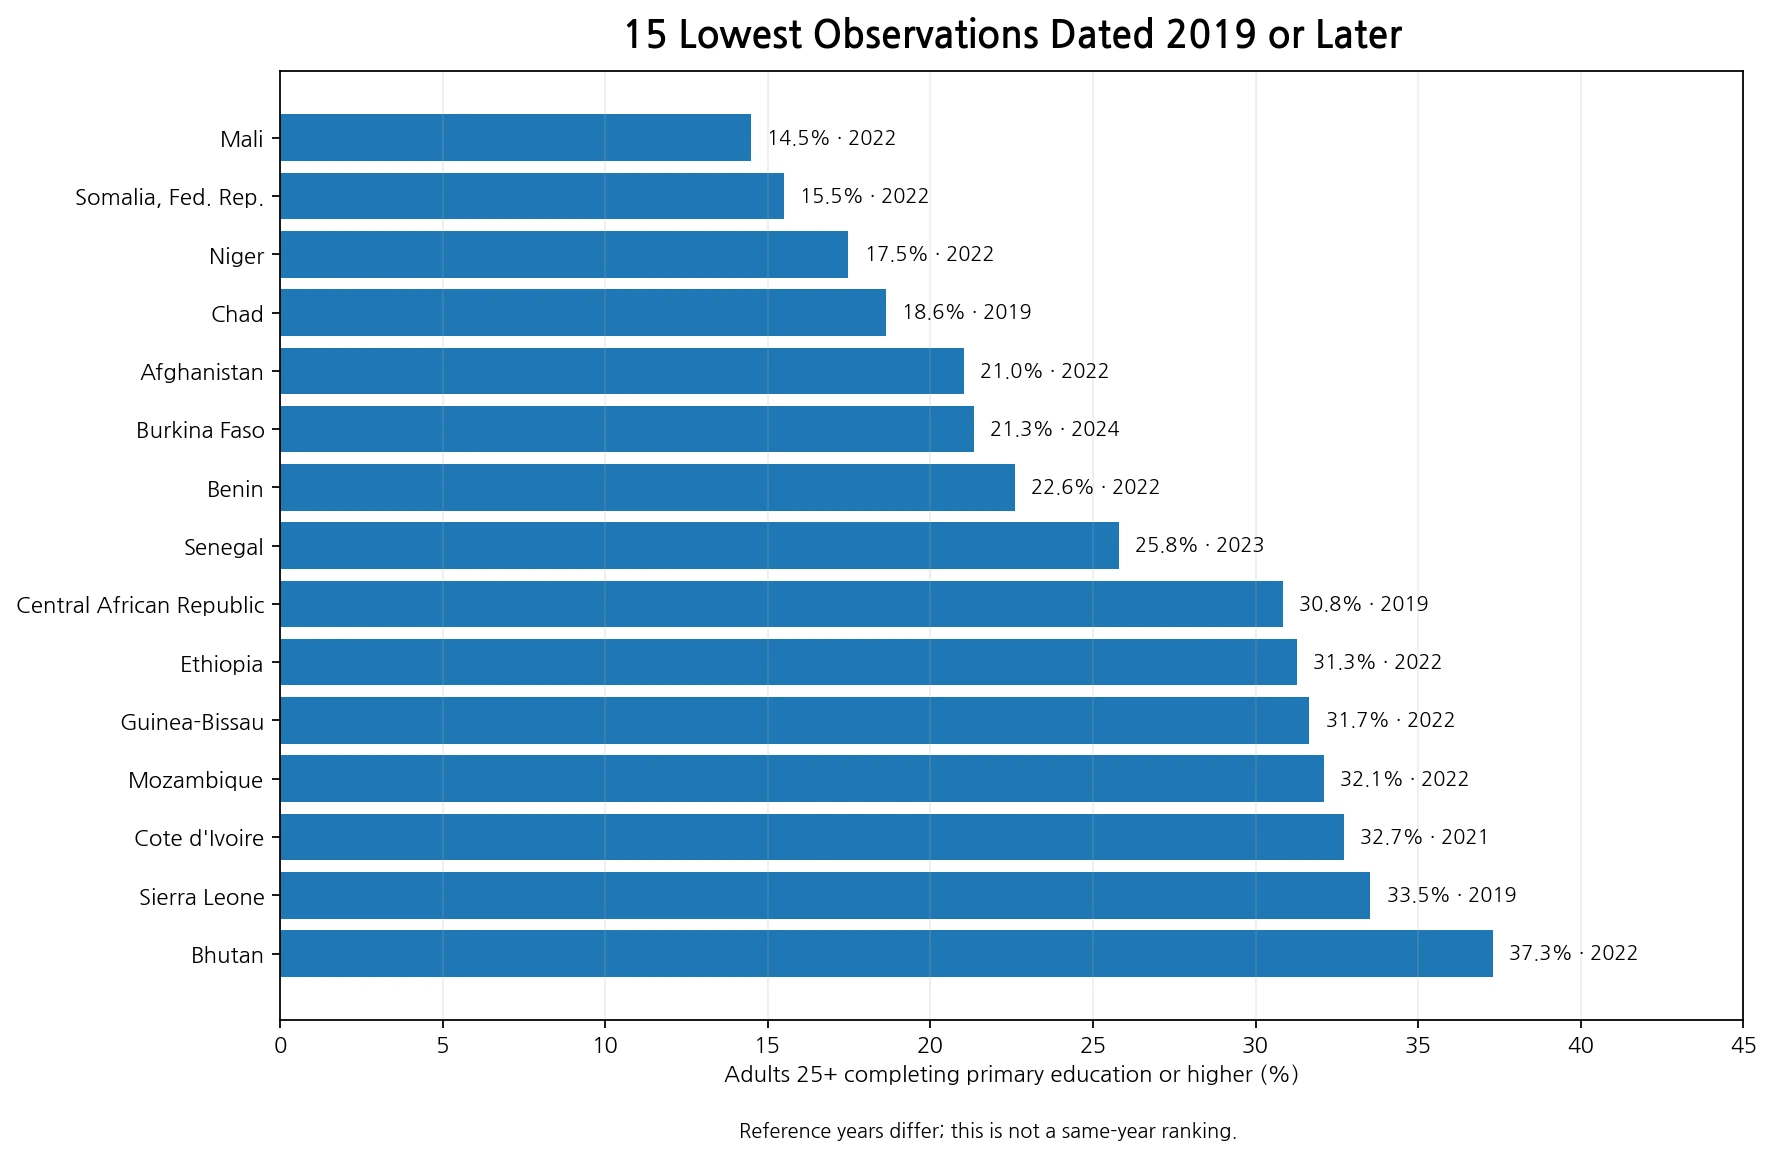
The geographic concentration of low observations is descriptive evidence, not a causal explanation. This indicator contains no direct variables for conflict, household income, rural isolation, school supply, teacher availability, gender inequality, education spending, language, or past policy. Those factors can be investigated with additional country-specific data, but the attainment percentage alone cannot identify why a country has a particular value. A cluster on a map is a question to investigate, not proof of one shared mechanism.
Selected countries show why the percentage and reference year belong in the same table
South Korea is reported at 97.9% in 2024 and the United States at 99.1% in 2024. Japan is at 99.6% in 2020, China at 95.8% in 2020, Germany and France at 100.0% in 2023. India is at 68.1% in 2023, Indonesia at 83.8% in 2023, Brazil at 79.6% in 2024, Nigeria at 71.0% in 2024, and Egypt at 69.2% in 2023. The differences are informative, but they should be read as latest reported adult attainment rather than as a scorecard of present-day school quality.
| Country | Reference year | Adults 25+ completing primary or higher |
|---|---|---|
| Korea, Rep. | 2024 | 97.9% |
| United States | 2024 | 99.1% |
| China | 2020 | 95.8% |
| Japan | 2020 | 99.6% |
| India | 2023 | 68.1% |
| Indonesia | 2023 | 83.8% |
| Brazil | 2024 | 79.6% |
| Mexico | 2025 | 86.3% |
| Germany | 2023 | 100.0% |
| France | 2023 | 100.0% |
| South Africa | 2024 | 89.3% |
| Nigeria | 2024 | 71.0% |
| Egypt, Arab Rep. | 2023 | 69.2% |
A value near 100% does not imply that every education outcome is equally strong. It says that the primary-education threshold is nearly universal among adults age 25+ under this series. It does not measure literacy proficiency, mathematics performance, years of schooling, completion of lower secondary or upper secondary education, tertiary qualifications, or the quality and equity of schooling. Likewise, a value of 70% does not mean that 30% of current primary pupils fail to graduate; the population base and time concept are different.
Reference years span 1980–2025, so older rows require special caution
The latest-value approach maximizes coverage, but it creates a mixed-vintage dataset. There are 46 observations dated 2024, 63 dated 2023, and 31 dated 2022. Yet Libya’s latest retained value is 24.9% from 1984, American Samoa’s is 81.3% from 1990, and St. Kitts and Nevis and Guam have 1980 observations. Treating those values as if they describe conditions in 2025 would be misleading.
When a country appears unusually high or low on the map, the reference year should therefore be checked before drawing a current comparison. Limiting the analysis to recent years improves time comparability but reduces geographic coverage. Keeping every latest observation improves coverage but mixes different historical periods. Neither choice is automatically correct; the right choice depends on whether the question is about broad geographic coverage or a tighter time window. This article keeps all latest observations on the main map, while separately highlighting the 2019-or-later subset for a more recent view.
The map shows the geography of adult basic attainment, not education quality
A broad spatial pattern is visible: many European, North American, and East Asian economies are close to the top of the scale, while a number of Sub-Saharan African countries and some South Asian economies have much lower latest observations. That pattern can help identify where adult basic educational attainment differs sharply. It cannot establish that neighboring countries have the same education history, the same policy environment, or the same reason for their values. Mixed reference years also contribute to what the map looks like.
Primary-or-higher attainment is also a low educational threshold in countries where basic schooling has been nearly universal for generations. Once most observations are above 95%, the series has limited power to distinguish among those high-attainment countries. To study differences inside that ceiling group, higher thresholds such as lower-secondary, upper-secondary, post-secondary, or tertiary attainment are more informative, and learning assessments can answer a different question about skills rather than credentials.
Comparing higher attainment thresholds reveals where the education ladder narrows
This primary-or-higher series can be viewed as the first rung in a set of cumulative adult-attainment indicators. A lower-secondary-or-higher indicator uses a higher threshold, so its percentage will generally be no greater than the primary-or-higher percentage for the same population and reference year. Upper-secondary-or-higher and tertiary thresholds narrow the eligible group further. Looking across those levels can reveal whether a country’s largest educational drop-off occurs after primary school, after lower secondary, or at later stages.
However, subtracting two latest-value articles is not automatically a valid dropout or transition-rate calculation. One indicator may use a 2024 observation while the related indicator for the same country may use 2021 or another year. Definitions and source coverage can also differ. A rigorous stage-to-stage comparison should align country, year, population basis, and indicator definition before calculating a difference. Latest-value maps are best used for broad patterns and for identifying cases that deserve a synchronized follow-up analysis.
Values near 100% mean the primary threshold is nearly universal, not that all education problems are solved
Austria, Germany, Denmark, Finland, France, Sweden, and several other economies are reported at 100.0% in their latest observations. At this end of the distribution, ranking 99.8% against 100.0% adds little substantive information. Both values indicate that the primary threshold is effectively universal among adults at the precision of the indicator. A more useful next question is how many adults completed lower secondary, upper secondary, or tertiary education, or how strong learning outcomes are.
At the lower end, the same indicator remains highly informative because a value below 50% means that a large share of adults age 25+ did not cross the primary-education threshold under the reported measure. The series therefore has different analytical value at different points on the scale: it separates broad historical access gaps well at the bottom and middle, but it becomes less discriminating among countries already near universal basic attainment.
Data source and calculation method
The values come from World Bank World Development Indicators series SE.PRM.CUAT.ZS. The World Bank WDI metadata defines the indicator as the percentage of the population age 25 and older that attained or completed primary education and identifies the UNESCO Institute for Statistics as the underlying data source. The unit is percent of the total population age 25+, and the series is annual.
For the country comparison, one latest non-empty observation is retained for each reporting economy. The mean, median, distribution bands, 2019-or-later subset, and bottom-15 comparison are calculated directly from those values. Missing data are not converted to zero, and an older observation is not relabeled as a 2025 value. The world map joins ISO-3 country codes to low-resolution country polygons, so some small islands and separately reported areas can be present in the statistics without appearing as distinct visible polygons at this map scale.
What questions is this map best suited to answer?
This dataset is well suited to questions such as: Which countries have low latest adult primary-or-higher attainment? How wide is the gap among countries with relatively recent observations? Where are the largest geographic contrasts? Which countries have very old latest values that signal a data-timeliness limitation? It is also a useful starting point for comparing progressively higher education thresholds for the same adult population.
It is not sufficient by itself for questions about this year’s primary-school graduation rate, current enrollment, school quality, learning proficiency, or the causal impact of a specific policy. Those questions require indicators with the correct age group, time basis, and outcome definition, and often additional contextual data. Keeping the measurement concept narrow prevents a descriptive world map from being turned into a claim the source cannot support.
Frequently Asked Questions
Does this indicator measure the current primary-school completion rate?
No. It measures the cumulative share of the population age 25 and older that has completed primary education or a higher level.
Are all 199 observations from 2025?
No. The dataset keeps each economy's latest non-empty observation, so reference years range from 1980 to 2025. Mexico is the only observation dated 2025.
Which country has the lowest recent observation?
Among observations dated 2019 or later, Mali is lowest at 14.5% in 2022, followed by Somalia at 15.5% and Niger at 17.5%, both from 2022.
Does a value of 100% mean the country has the world’s best education system?
No. It means the primary-education threshold is reported as universal among adults age 25+ under this indicator. It does not measure higher-level attainment, learning outcomes, quality, or equity.
Related Articles
Related attainment maps for the same age-25+ population use higher education thresholds and help show how the adult education ladder changes across countries.
- Global Lower-Secondary-or-Higher Attainment Map – Latest Values for Adults 25+
- Global Upper-Secondary Educational Attainment Map – Latest Values for Adults 25+
- Global Short-Cycle Tertiary Attainment Map – Latest Values for Adults 25+
Green Map creates custom-edited map images using open geographic data sources such as geoBoundaries, Natural Earth, OpenStreetMap, and government open data.
These maps are edited visual materials, not raw data files, and are provided for education, documents, presentations, and graphic reference.