What share of adults have reached at least the bachelor’s level of education? The answer varies widely across countries. This article uses World Bank World Development Indicators series SE.TER.CUAT.BA.ZS, “Educational attainment, at least Bachelor's or equivalent, population 25+, total (%) (cumulative),” to compare the latest available observation for each reporting economy. The measure includes bachelor’s degrees and equivalent education levels, as well as people who continued to master’s, doctoral, or other higher levels.
The most important limitation is the date attached to each row. The validated CSV contains 188 country or area observations, but their reference years run from 2000 through 2024. Only 41 rows are dated 2024; 61 are from 2023 and 33 from 2022. The map is therefore a latest-value snapshot, not a synchronized 2024 world ranking. Any comparison should keep the reported year beside the percentage.
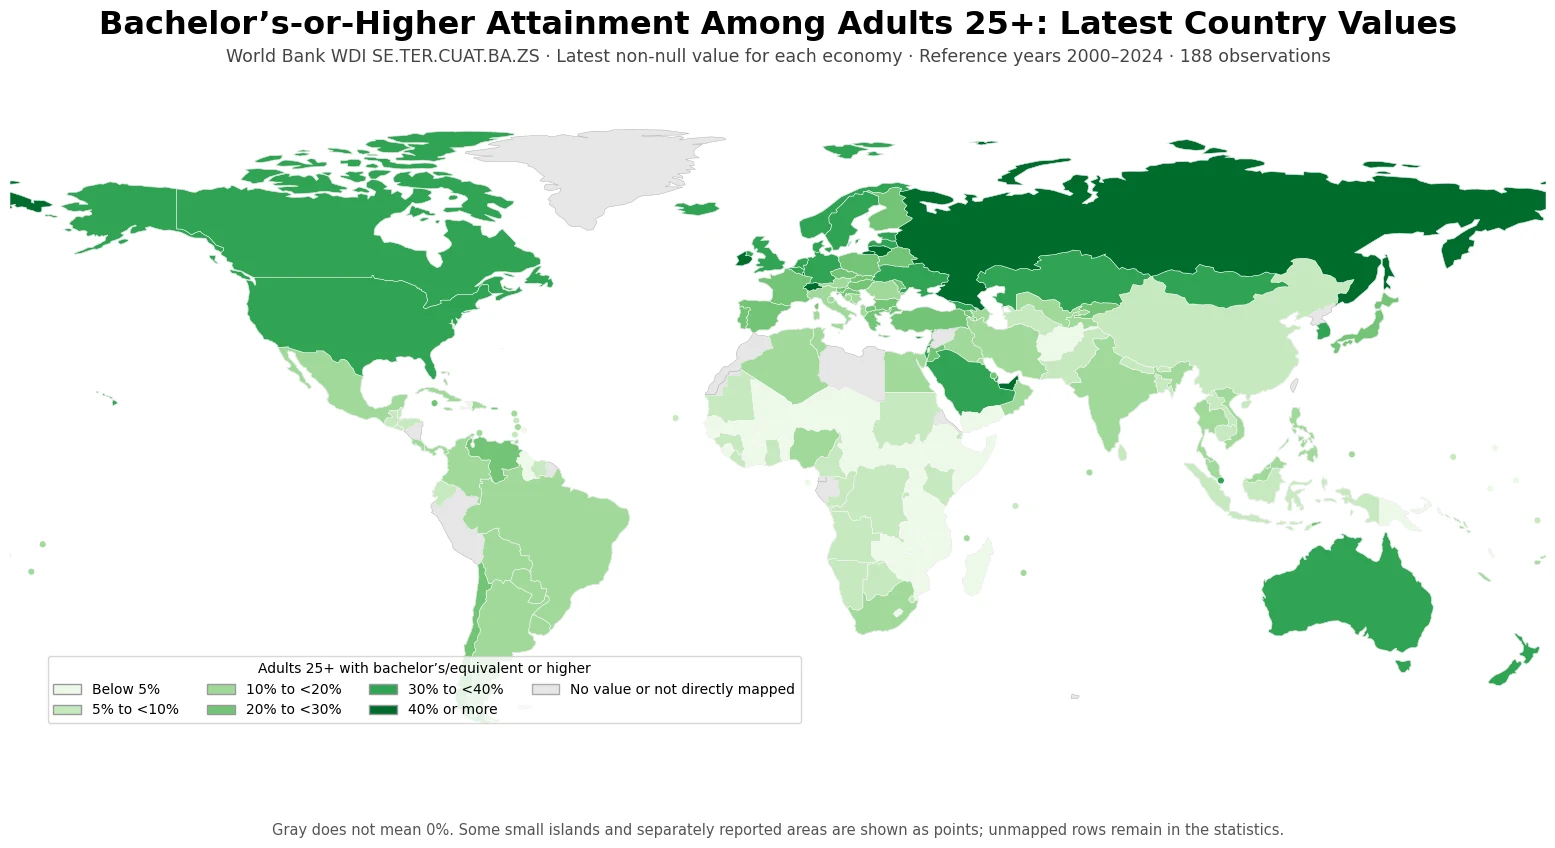
Table of Contents
This is an adult attainment measure, not a current college enrollment rate
World Bank metadata defines SE.TER.CUAT.BA.ZS as the percentage of the population age 25 and older that attained or completed bachelor’s or equivalent education. The methodology divides the number of people age 25+ who have reached that level by the total population of the same age group and multiplies by 100. The underlying source identified by the World Bank is the UNESCO Institute for Statistics (UIS).
The words at least and cumulative matter. Someone with a master’s or doctorate is still counted because that person has passed the bachelor’s-or-equivalent threshold. The indicator also pools adult generations rather than describing only people graduating this year. It is a stock of accumulated educational attainment in the adult population.
A value of 35% therefore does not mean that 35% of this year’s students graduated from university, nor does it measure the percentage currently enrolled in tertiary education. It also does not directly measure learning quality, literacy, university research strength, or labor-market outcomes. Those questions require different indicators.
The median across 188 latest observations is 14.6%
Treating each of the 188 rows as one equally weighted observation gives a simple median of 14.6% and a simple mean of 16.4%. These are statistics of the country-and-area distribution, not a population-weighted estimate for all adults in the world. A very populous country and a small island economy each contribute one row to this calculation.
| Latest-value band | Number of observations |
|---|---|
| Below 5% | 35 |
| 5% to below 10% | 38 |
| 10% to below 20% | 53 |
| 20% to below 30% | 30 |
| 30% to below 40% | 26 |
| 40% or more | 6 |
The largest band is 10% to below 20%, with 53 observations. Another 73 rows are below 10%, while only 6 latest observations reach 40% or more. The spread is large enough that a single average hides much of the cross-country variation. At the same time, small differences should not be turned into a precise league table because the observation dates are not synchronized.
Most rows are recent, but the vintage mix still matters
Of the 188 observations, 169, or 89.9%, are dated 2019 or later. The distribution is 41 rows in 2024, 61 in 2023, 33 in 2022, 11 in 2021, 8 in 2020, and 15 in 2019. The remaining 19 rows are from 2018 or earlier. Barbados has the oldest latest observation in the file, from 2000; South Sudan is from 2008, while Yemen and the Federated States of Micronesia are from 2014.
| Reference year | Rows |
|---|---|
| 2024 | 41 |
| 2023 | 61 |
| 2022 | 33 |
| 2021 | 11 |
| 2020 | 8 |
| 2019 | 15 |
| 2018 or earlier | 19 |
If the sample is restricted to the 169 observations from 2019 onward, the simple median is 15.2% and the simple mean is 17.2%. Those figures are close to the full-sample statistics, but that does not make an old row current. For a country-level comparison, the year remains part of the value and should not be dropped from tables or interpretation.
The highest latest observations extend above 40%
| Country or area | Reference year | Bachelor’s/equivalent or higher |
|---|---|---|
| United Arab Emirates | 2024 | 52.7% |
| Ireland | 2023 | 41.9% |
| Luxembourg | 2023 | 41.9% |
| Switzerland | 2024 | 41.6% |
| Lithuania | 2023 | 41.3% |
| Russian Federation | 2021 | 41.2% |
| United Kingdom | 2021 | 39.6% |
| United States | 2024 | 39.1% |
| Israel | 2023 | 38.3% |
| Belgium | 2023 | 37.4% |
The United Arab Emirates has the largest latest observation at 52.7%. Ireland and Luxembourg are both about 41.9%, followed by Switzerland at 41.6% and Lithuania at 41.3%. These entries are useful for seeing the upper end of the latest reported distribution, but they are not a same-year top-ten ranking. Russia and the United Kingdom refer to 2021, Ireland and Luxembourg to 2023, and the United States and Switzerland to 2024.
The percentage also should not be confused with the number of adults holding degrees. It is normalized by the age-25+ population. A smaller country can have a high attainment share with far fewer degree holders in absolute terms than a larger country. Questions about graduate counts, university capacity, or research workforces need separate population and education data.
A same-year 2024 subset contains 41 observations
For readers who prefer a synchronized comparison, the file contains 41 observations dated 2024. Within this limited subset, the simple median is 18.8% and the simple mean is 20.4%. The common reference year makes comparisons inside this subset cleaner, but the 41 countries and areas do not constitute a complete world sample.
| 2024 observation | Share |
|---|---|
| United Arab Emirates | 52.7% |
| Switzerland | 41.6% |
| United States | 39.1% |
| Australia | 36.8% |
| Korea, Rep. | 36.5% |
| Saudi Arabia | 36.0% |
| Mongolia | 35.5% |
| Canada | 34.7% |
| Georgia | 33.7% |
| Kazakhstan | 33.0% |
Among those 41 rows, the United Arab Emirates is highest at 52.7%, Switzerland is 41.6%, and the United States is 39.1%. Australia is 36.8%, Korea 36.5%, and Canada 34.7%. A higher attainment share does not, by itself, establish better education quality, stronger productivity, or better labor-market outcomes. The dataset measures one dimension: the level of formal education accumulated by adults.
Selected major economies show why year and value belong together
| Country | Latest year | Share |
|---|---|---|
| Korea, Rep. | 2024 | 36.5% |
| United States | 2024 | 39.1% |
| Australia | 2024 | 36.8% |
| Canada | 2024 | 34.7% |
| Germany | 2023 | 30.5% |
| France | 2023 | 24.4% |
| India | 2023 | 14.9% |
| Brazil | 2024 | 17.2% |
| South Africa | 2024 | 14.4% |
| Japan | 2020 | 25.5% |
| China | 2020 | 7.7% |
| United Kingdom | 2021 | 39.6% |
Korea’s latest value is 36.5% in 2024. The United States, Australia, and Canada also have 2024 observations, so those rows share a reference year. Germany and France are dated 2023, the United Kingdom 2021, and Japan and China 2020. Keeping the year visible avoids presenting a mixed-vintage table as if all percentages described the same moment.
Adult attainment usually changes more gradually than a monthly economic indicator, but it can still move over time as younger cohorts enter the 25+ population, older cohorts exit, migration changes the adult population, and access to higher education expands. A several-year-old observation may therefore understate or overstate the present level. For policy analysis, the latest national statistics and detailed UIS series should be checked alongside this broad cross-country snapshot.
Low recent observations do not summarize an entire education system
| Country or area | Reference year | Share |
|---|---|---|
| Niger | 2022 | 1.0% |
| Zimbabwe | 2023 | 1.1% |
| Malawi | 2020 | 1.3% |
| Chad | 2019 | 1.8% |
| Central African Republic | 2019 | 1.8% |
| Kiribati | 2024 | 1.9% |
| Sierra Leone | 2019 | 2.0% |
| Nauru | 2023 | 2.1% |
| Tanzania | 2022 | 2.3% |
| Mali | 2022 | 2.3% |
Among observations dated 2019 or later, Niger is 1.0%, Zimbabwe 1.1%, and Malawi 1.3%, with several other rows near 2%. These values indicate a small share of adults reaching the bachelor’s-or-equivalent threshold. They do not tell us, by themselves, whether primary or secondary completion is low, whether literacy is low, or whether vocational pathways are common. A country can have very different patterns at lower education thresholds.
The spatial pattern is descriptive, not a causal result
The map shows many higher bands across North America and Europe, along with Australia, Korea, and parts of Western and Central Asia. Many lower bands appear across Sub-Saharan Africa, while Latin America and Asia contain a broad mix. That is a geographic pattern in the reported attainment data, not evidence that one regional policy, income level, or cultural factor caused the outcome.
The supplied file contains no variables on tuition, university capacity, migration, age structure, household income, gender gaps, urban-rural access, labor-market returns, or education quality. Adult attainment also reflects decades of history because the denominator includes all people age 25 and older. Explaining why an individual country is high or low requires additional country-specific evidence rather than inference from map color alone.
Comparing education thresholds can add useful context
Bachelor’s-or-higher attainment is only one threshold in the education ladder. Related World Bank and UNESCO series measure adults who have completed at least lower secondary, upper secondary, or short-cycle tertiary education. Looking across thresholds can help show how the share of the adult population narrows as the required level rises, which is more informative than treating the bachelor’s percentage as a complete description of educational attainment.
However, “latest” observations for different indicators may be reported in different years even for the same country. A precise gap between upper-secondary, short-cycle tertiary, and bachelor’s attainment should therefore be calculated only after matching the country and reference year. This article computes only the SE.TER.CUAT.BA.ZS series and does not invent cross-series differences from mismatched vintages.
Data source and calculation method
The statistical source is World Bank WDI SE.TER.CUAT.BA.ZS. The World Bank metadata glossary defines the measure as the percentage of the population age 25 and older that attained or completed bachelor’s or equivalent education and identifies the UNESCO Institute for Statistics as the underlying data provider. The unit is percent of the total population age 25+.
The validated cleaned CSV retains one latest non-null observation for each of 188 real country or area rows and excludes regional and income-group aggregates. Every mean, median, band count, and table value above was calculated directly from that file. The visualization matches ISO3 codes to a low-resolution world boundary layer, filling 157 country polygons; 25 additional small or separately reported areas are shown as points when coordinates are available. Rows that cannot be drawn directly remain in the statistics, so an unfilled map area must not be interpreted as a zero.
Frequently Asked Questions
Is this the current university enrollment rate or this year’s graduation rate?
No. It is the cumulative share of people age 25 and older who have attained bachelor’s or equivalent education or a higher level. Current enrollment and annual graduation rates answer different questions.
Can this map be read as a 2024 country ranking?
No. The 188 latest observations span 2000–2024, and only 41 rows are dated 2024. The percentage should be interpreted together with each country’s reference year.
Does the 14.6% median mean 14.6% of all adults in the world have a bachelor’s degree or higher?
No. It is an unweighted median across 188 country or area rows. A population-weighted global share would require age-25+ population weights or an appropriate published aggregate.
Does a higher bachelor’s-or-higher share prove that education quality is better?
No. The indicator measures accumulated formal educational attainment. It does not directly measure learning outcomes, teaching quality, research strength, or labor-market performance.
Related Articles
- Global Short-Cycle Tertiary Attainment Map – Latest Values for Adults 25+
- Global Upper-Secondary Educational Attainment Map – Latest Values for Adults 25+
- Global Lower-Secondary-or-Higher Attainment Map – Latest Values for Adults 25+
Green Map creates custom-edited map images using open geographic data sources such as geoBoundaries, Natural Earth, OpenStreetMap, and government open data.
These maps are edited visual materials, not raw data files, and are provided for education, documents, presentations, and graphic reference.