The share of young people who are simultaneously outside education, employment and training varies widely across countries. Restricting World Bank indicator SL.UEM.NEET.ME.ZS to the 182 observations dated 2025 gives a median of 17.4% and an unweighted mean of 19.5%. Afghanistan is at 55.7%, São Tomé and Príncipe 50.4%, and Djibouti almost 50%, while Japan is 3.1% and the Netherlands 3.6%.
This is the NEET rate: the share of youth who are not in education, employment or training. The World Bank series uses ages 15–24 for this indicator and relies on modeled ILO estimates for international comparison. The measure is broader than youth unemployment because it can include young people outside the labor force when they are also outside education and training.
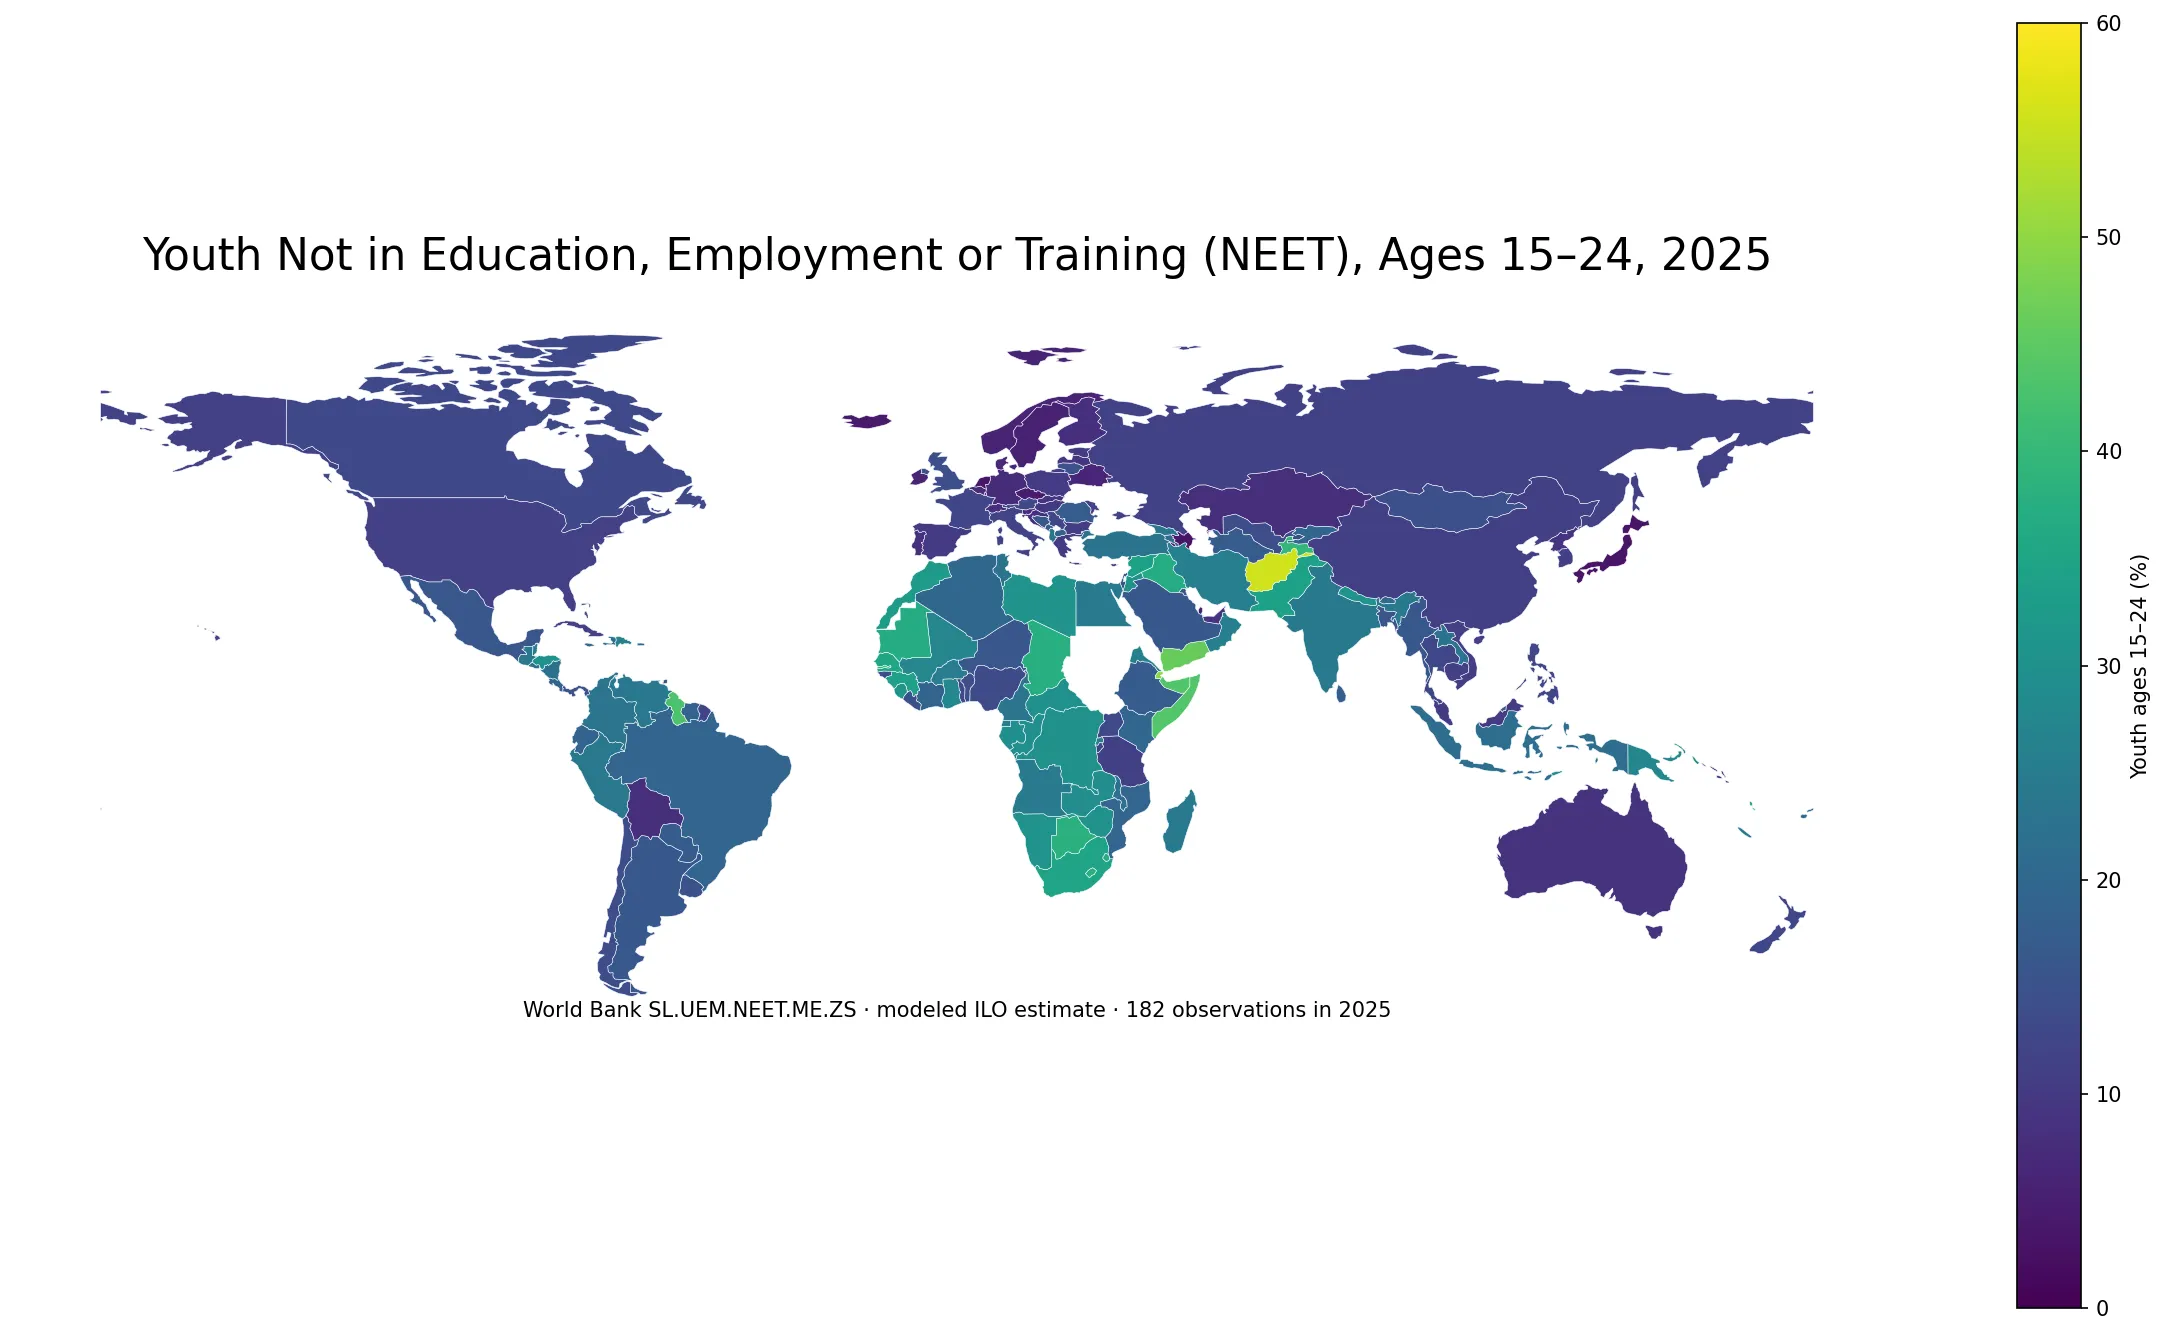
Table of Contents
The NEET rate is broader than the youth unemployment rate
The World Bank metadata defines the NEET rate as the proportion of youth who are not in education, employment or training. For this series, youth means ages 15–24. Education participation includes relevant formal and non-formal education under the statistical framework, while employment follows international labor-statistics concepts.
The denominator is the entire youth population in the age group, not only the labor force. A young person who is not working, is not studying or training, and is outside the labor force can therefore be counted as NEET without being counted as unemployed. Likewise, a non-employed student is not NEET because the person is participating in education.
That distinction is why NEET and youth unemployment should not be substituted for one another. The measures overlap for some job-seeking young people, but they answer different questions about the transition from education into work.
Afghanistan and São Tomé and Príncipe exceed 50% in the 2025 modeled estimates
Only 2 of the 182 same-year observations are at 50% or above, and 6 are at 40% or above. Afghanistan is highest at 55.7%, followed by São Tomé and Príncipe at 50.4%. Djibouti is 49.96%, Yemen 46.0%, Somalia 43.6%, and Guyana 43.0%.
| Country or economy | Youth NEET rate, 2025 |
|---|---|
| Afghanistan | 55.7% |
| Sao Tome and Principe | 50.4% |
| Djibouti | 50.0% |
| Yemen, Rep. | 46.0% |
| Somalia, Fed. Rep. | 43.6% |
| Guyana | 43.0% |
| Gambia, The | 39.8% |
| Tajikistan | 39.6% |
| Botswana | 38.1% |
| Lesotho | 38.1% |
| Chad | 37.7% |
| Iraq | 36.9% |
The high values are geographically dispersed, but some neighboring patterns stand out. Djibouti and Somalia are both high in the Horn of Africa. Botswana, Lesotho and Eswatini are all in the upper 30s in southern Africa. The Gambia, Mauritania and Senegal are relatively high in West Africa, while Yemen, Iraq, Afghanistan and Pakistan stand out across parts of West and South Asia.
The map identifies where the outcome is high or low; it does not isolate causes. School access, labor demand, gender gaps, household resources, conflict, migration and training systems can all matter, but causal attribution requires separate evidence.
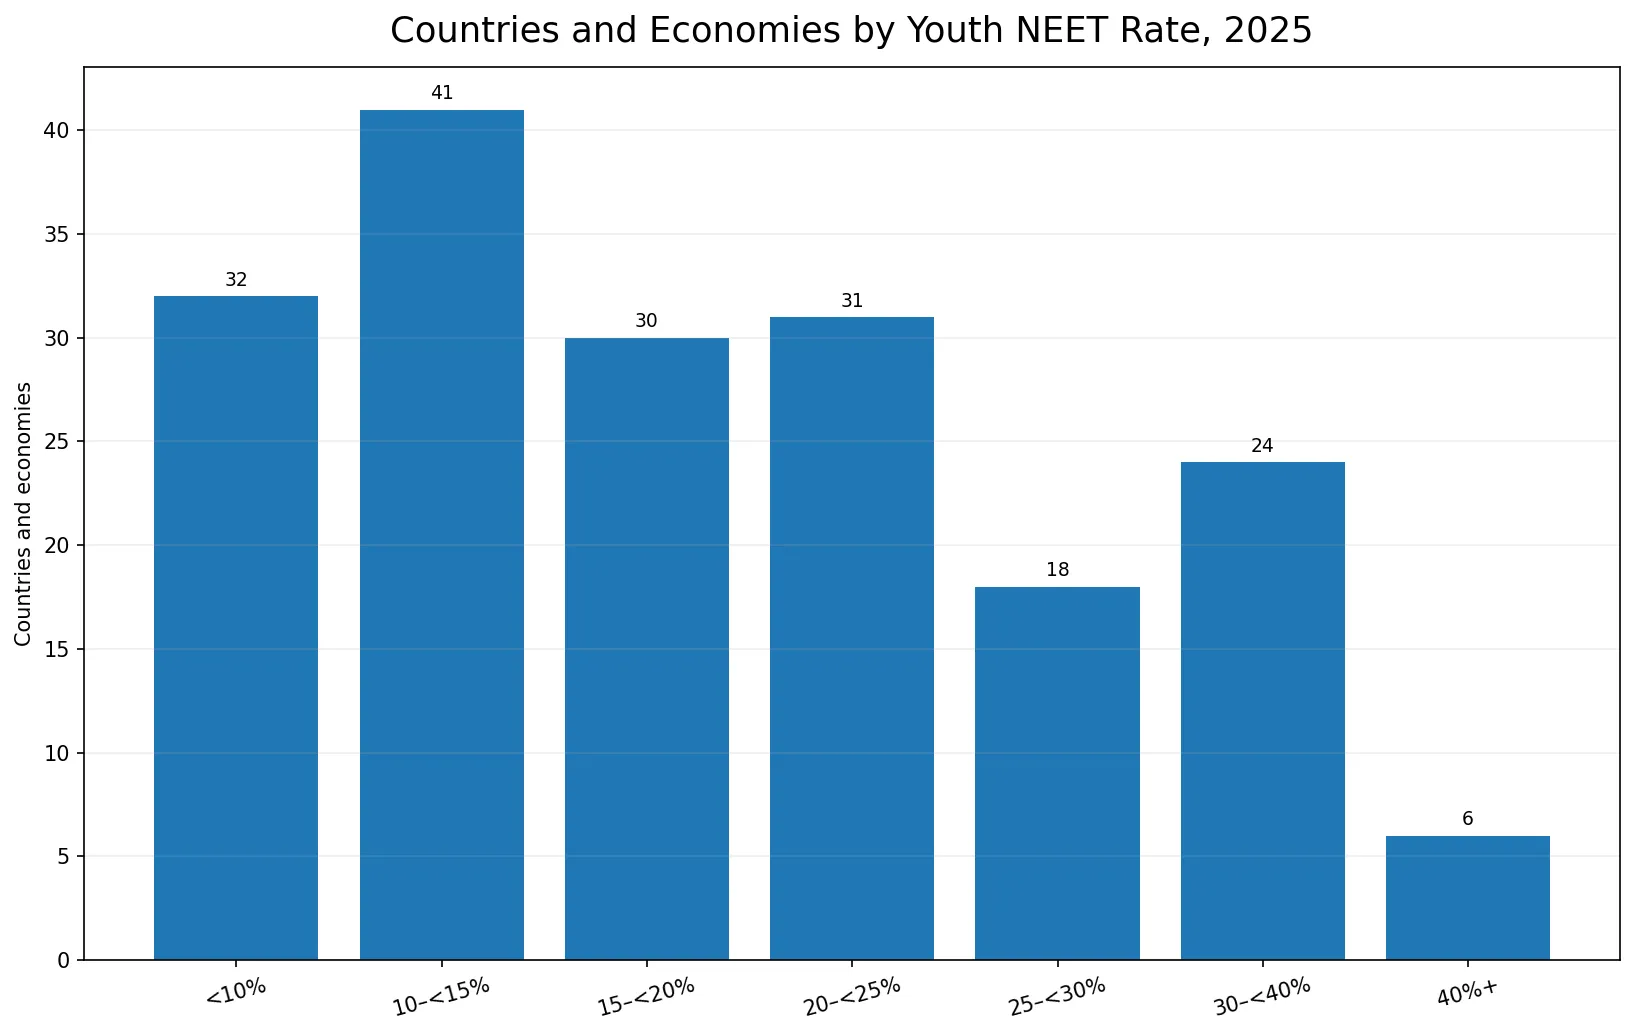
79 observations are at 20% or above, while 32 are below 10%
Among the 182 2025 observations, 79 are at least 20%, 48 at least 25%, and 30 at least 30%. At the other end, 32 are below 10%. The middle 50% of country/economy rows falls between about 11.3% and 25.7%.
| Youth NEET rate | Countries/economies | Share of 182 |
|---|---|---|
| <10% | 32 | 17.6% |
| 10–<15% | 41 | 22.5% |
| 15–<20% | 30 | 16.5% |
| 20–<25% | 31 | 17.0% |
| 25–<30% | 18 | 9.9% |
| 30–<40% | 24 | 13.2% |
| 40%+ | 6 | 3.3% |
The mean and median are unweighted across reporting economies. They do not estimate the share of all young people in the world who are NEET because countries with very different youth populations contribute one row each.
Japan, Germany and Australia are below 10%; Korea and the United States are around 11%
Japan is the lowest 2025 observation at 3.1%, followed by Azerbaijan at 3.3%, the Netherlands at 3.6%, Iceland at 4.0%, and Czechia at 4.7%. Germany is 7.5%, Australia 8.6%, and the United Arab Emirates 9.0%. Korea is 11.0%, China 11.2%, the United States 11.7%, France 12.6%, and Canada 13.0%.
| Country or economy | Youth NEET rate, 2025 |
|---|---|
| Japan | 3.1% |
| Azerbaijan | 3.3% |
| Netherlands | 3.6% |
| Macao SAR, China | 3.7% |
| Iceland | 4.0% |
| Czechia | 4.7% |
| Sweden | 5.6% |
| Qatar | 5.6% |
| Hong Kong SAR, China | 5.7% |
| Ireland | 5.8% |
| Norway | 6.0% |
| Singapore | 6.0% |
India and Indonesia are above 20%, while Pakistan and South Africa are in the mid-30s
Among selected large economies, India is at 24.3%, Indonesia 21.5%, Brazil 19.4%, and Mexico 16.0%. Pakistan is 34.4% and South Africa 34.7%. Saudi Arabia is 16.2% and the United Arab Emirates 9.0%.
| Country | Youth NEET rate, 2025 |
|---|---|
| Afghanistan | 55.7% |
| Pakistan | 34.4% |
| India | 24.3% |
| Indonesia | 21.5% |
| South Africa | 34.7% |
| Brazil | 19.4% |
| Mexico | 16.0% |
| Saudi Arabia | 16.2% |
| United Arab Emirates | 9.0% |
| China | 11.2% |
| Korea, Rep. | 11.0% |
| United States | 11.7% |
| Canada | 13.0% |
| Australia | 8.6% |
| United Kingdom | 14.3% |
| France | 12.6% |
| Germany | 7.5% |
| Spain | 10.2% |
| Italy | 12.1% |
| Japan | 3.1% |
These values are not composite scores of education quality or job quality. A low NEET rate can coexist with low pay or unstable employment, while a high NEET rate can contain very different mixes of unemployed youth and young people outside the labor force.
Five latest-value rows are excluded because they are not from 2025
The source package contains 187 latest non-null rows, but only 182 are dated 2025. Lebanon and South Sudan are dated 2023, West Bank and Gaza and Sudan are dated 2022, and Ukraine is dated 2021. Those five rows are retained in the source package but excluded from the synchronized 2025 map, ranking and distribution.
| Country or economy | Latest reference year | Latest NEET rate |
|---|---|---|
| Lebanon | 2023 | 23.8% |
| West Bank and Gaza | 2022 | 25.4% |
| Sudan | 2022 | 46.5% |
| South Sudan | 2023 | 34.1% |
| Ukraine | 2021 | 17.4% |
Removing five rows slightly reduces geographic coverage, but it avoids combining a 2021 labor-market observation with 2025 modeled values in one same-year ranking. Reference-year consistency matters because the NEET rate responds to both labor-market and education participation conditions.
Modeled ILO estimates are useful for broad international comparisons, not tiny rank differences
SL.UEM.NEET.ME.ZS is a modeled ILO estimate. The modeled framework supports wider same-year international coverage and can use statistical modeling when country observations are incomplete. As a result, the values do not have to match a national statistical office headline series exactly.
Broad bands and large differences are more defensible than precise rankings based on one or two percentage points. For country policy analysis or trend analysis, the next step should be ILOSTAT time-series data and the relevant national labor-force or education statistics.
Unemployment and employment-to-population ratios help explain why NEET is a separate indicator
The unemployment rate focuses on unemployed people within the labor force. The employment-to-population ratio asks how much of a defined population is employed. NEET adds a third dimension by separating young people who are also outside education and training.
That is why countries do not necessarily rank the same on all three maps. A non-employed student is outside employment but not NEET. A young person outside both work and education who is not actively seeking work can be NEET without being classified as unemployed.
Data source and mapping method
The statistical source is World Bank World Development Indicators SL.UEM.NEET.ME.ZS. The World Bank defines the series for youth ages 15–24 and identifies the ILO Modelled Estimates database as the underlying source. Definitions were checked against the World Bank metadata and ILOSTAT youth labor-market concepts.
The source package contains 187 latest non-null country/economy rows. The map, rankings and distribution use only the 182 rows dated 2025. The same-year unweighted mean is 19.48% and the median 17.45%. ISO-3 codes are joined to a simplified world boundary layer, with 164 polygons directly matched to 2025 values. Small islands and special statistical areas can have valid rows without a distinct visible polygon at global scale.
Frequently Asked Questions
What does the youth NEET rate measure?
It is the share of youth ages 15–24 who are not in education, employment or training. NEET stands for Not in Education, Employment or Training.
Is the NEET rate the same as the youth unemployment rate?
No. NEET uses the full youth population as the denominator and can include young people outside the labor force when they are also outside education and training. Unemployment is measured within the labor force.
Are all observations on the map from 2025?
Yes. The map, ranking and distribution use the 182 observations dated 2025. Five older latest-value rows are excluded from the synchronized comparison.
Does a lower NEET rate automatically mean a better youth labor market?
No. The indicator does not directly measure wages, job stability, working hours, education quality or other dimensions of labor-market and education outcomes.
Related Articles
These Green Map labor-market pages help distinguish NEET from unemployment and the employment-to-population ratio.
- Global Unemployment Rate Map – Country Patterns in 2025
- Global Employment-to-Population Ratio Map – Ages 15+ in 2025
- Global Employment-to-Population Ratio Map – Latest National Estimates
Green Map creates custom-edited map images using open geographic data sources such as geoBoundaries, Natural Earth, OpenStreetMap, and government open data.
These maps are edited visual materials, not raw data files, and are provided for education, documents, presentations, and graphic reference.