Agricultural land can be compared as an economic asset as well as by physical area. In the World Bank’s 2020 data, agricultural-land natural capital per person ranges from about $82 to $38,914 across 150 countries and separately reported economies. New Zealand is highest at about $38,914 per person, followed by Lao PDR at $20,670 and Australia at $18,740. The median is about $2,897.
The indicator is World Bank NW.NCA.AGRI.PC.CD, formally titled Renewable natural capital per capita, agricultural land (current US$). It is a wealth-accounting measure, not a map of farmland sale prices or hectares per person. Agricultural land is treated as a productive natural asset, and the per-capita series divides the estimated national asset value by population.
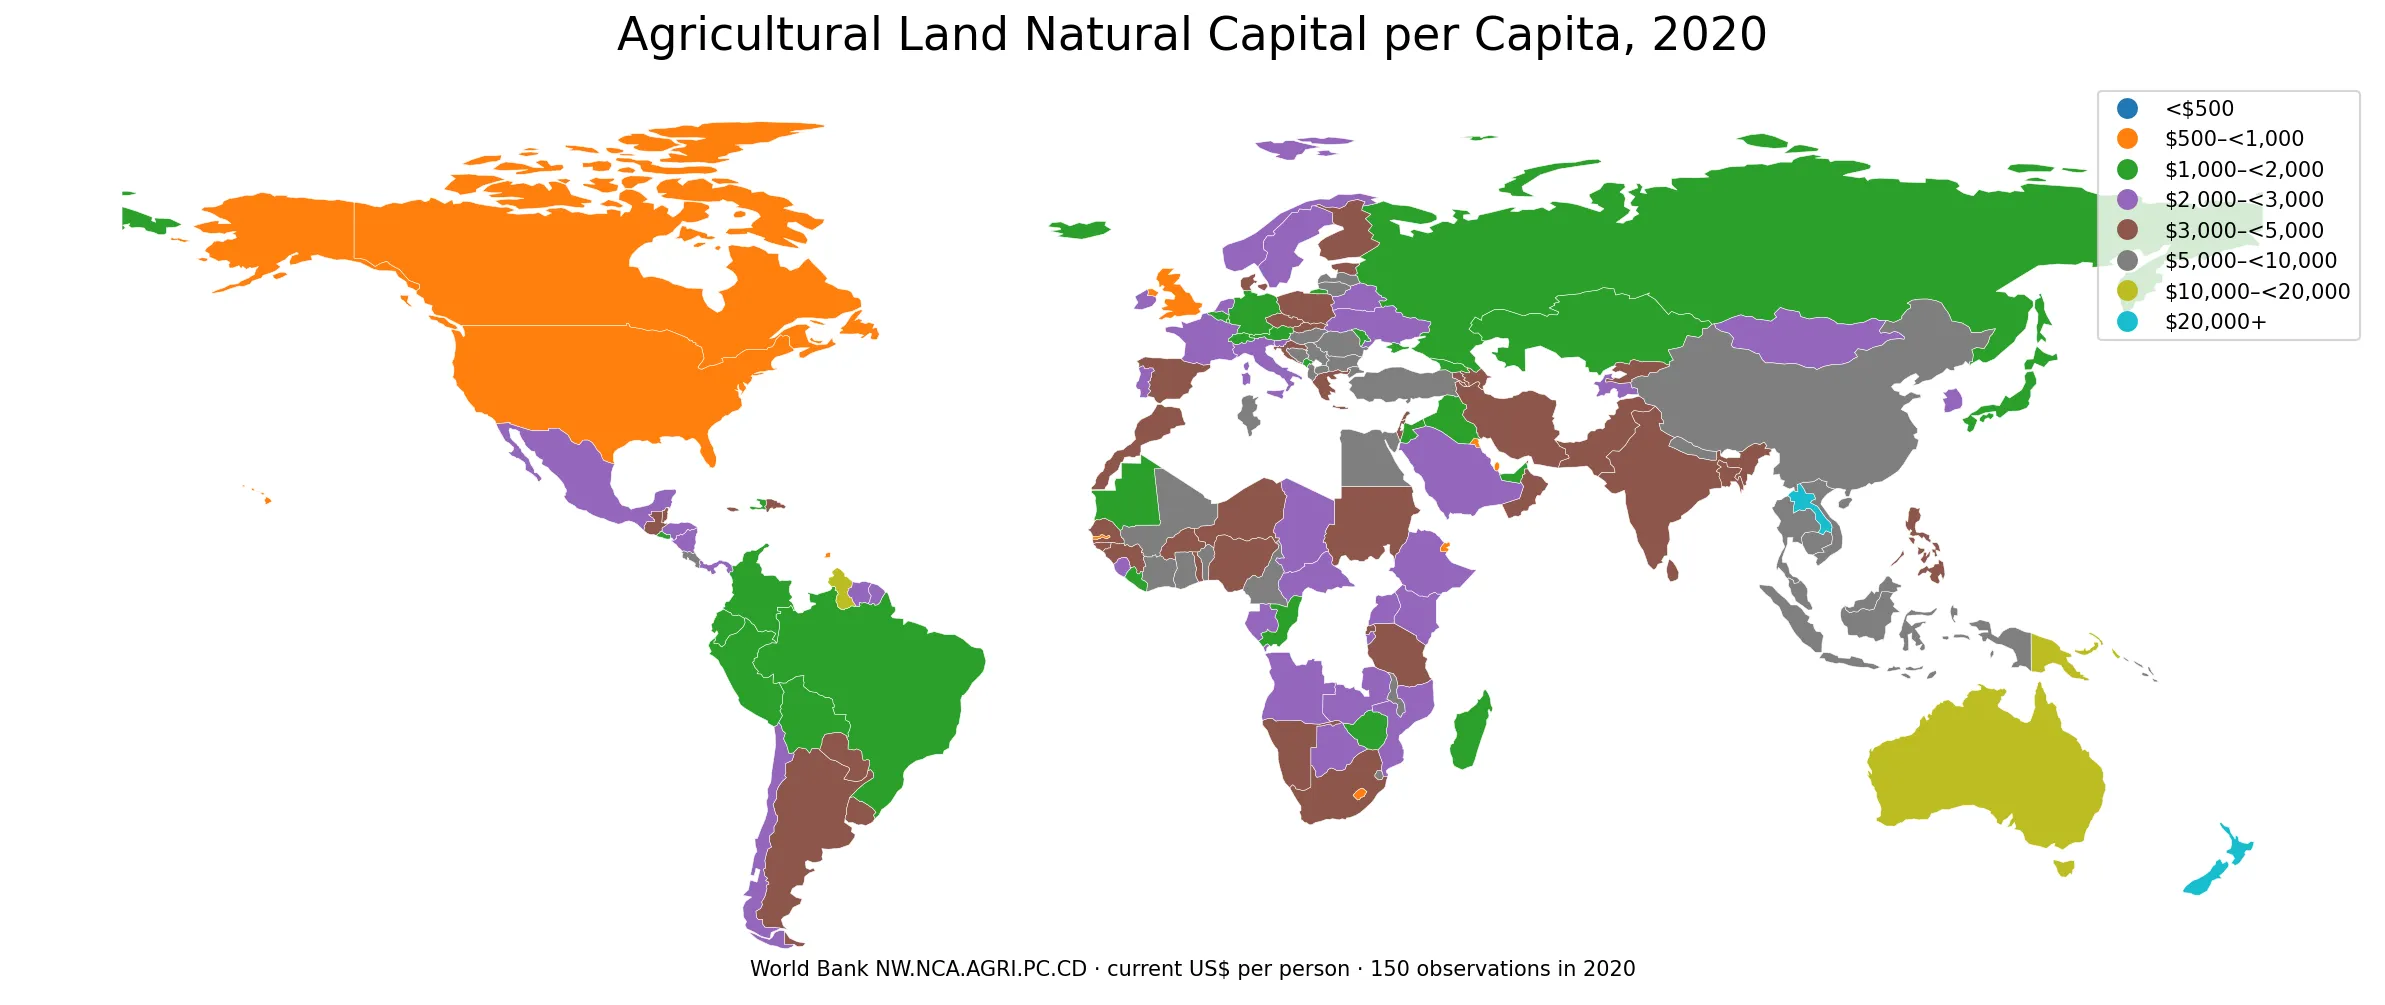
Table of Contents
All 150 observations use the same 2020 reference year
The dataset contains 150 numeric country/economy observations and every row is dated 2020. The unweighted mean is $3,979, the median $2,897, the first quartile $1,918, and the third quartile $4,857. Because a few observations are very large, the mean sits well above the median.
The unit is current U.S. dollars per person. These are nominal values for the observation year, not constant-dollar values and not purchasing-power-parity adjustments. That makes the series useful for a same-year cross-section, while long-run real change requires a different price-consistent approach.
This is an asset-value estimate, not a farmland market-price map
The Changing Wealth of Nations framework treats agricultural land as part of renewable natural capital. Agricultural land is divided into cropland and pastureland. The wealth concept is based on the present value of future resource-rent flows associated with the land rather than a simple sum of observed land transaction prices.
The indicator therefore should not be substituted for farm income, agricultural value added, land prices, crop output, pasture area, or hectares of farmland per person. It asks a narrower balance-sheet question: how large is the estimated agricultural-land asset value when expressed per resident?
New Zealand is the clear high outlier, followed by Lao PDR and Australia
New Zealand stands far above the rest of the 2020 distribution. Lao PDR and Australia are also above $18,000 per person, while Papua New Guinea and Guyana exceed $10,000. Solomon Islands, Lithuania, Viet Nam, China and Costa Rica also rank near the top. Country size alone clearly does not determine the result.
| Country or economy | 2020 value per person |
|---|---|
| New Zealand | $38,914 |
| Lao PDR | $20,670 |
| Australia | $18,740 |
| Papua New Guinea | $13,097 |
| Guyana | $10,108 |
| Solomon Islands | $9,698 |
| Lithuania | $9,475 |
| Viet Nam | $8,956 |
| China | $8,756 |
| Costa Rica | $8,402 |
Singapore, Bahrain and Malta are at the bottom, with the United States and Canada also low
Singapore is the lowest observation at about $82 per person, followed by Bahrain at about $421 and Malta at $466. The United States is about $550 and Canada about $614. A large agricultural sector in absolute terms does not automatically translate into a high per-capita natural-capital value under this accounting measure.
| Country or economy | 2020 value per person |
|---|---|
| Singapore | $82 |
| Bahrain | $421 |
| Malta | $466 |
| United States | $550 |
| Maldives | $556 |
| Djibouti | $604 |
| Canada | $614 |
| Qatar | $656 |
| Gambia, The | $683 |
| Kuwait | $733 |
Most observations are below $5,000, but the upper tail is long
13 observations are below $1,000 and 40 are below $2,000. At the higher end, 74 are at $3,000 or above, 33 reach $5,000, and only 5 reach $10,000 or more. Just 2 observations exceed $20,000. The long right tail is why the median is more representative of the center than the mean alone.
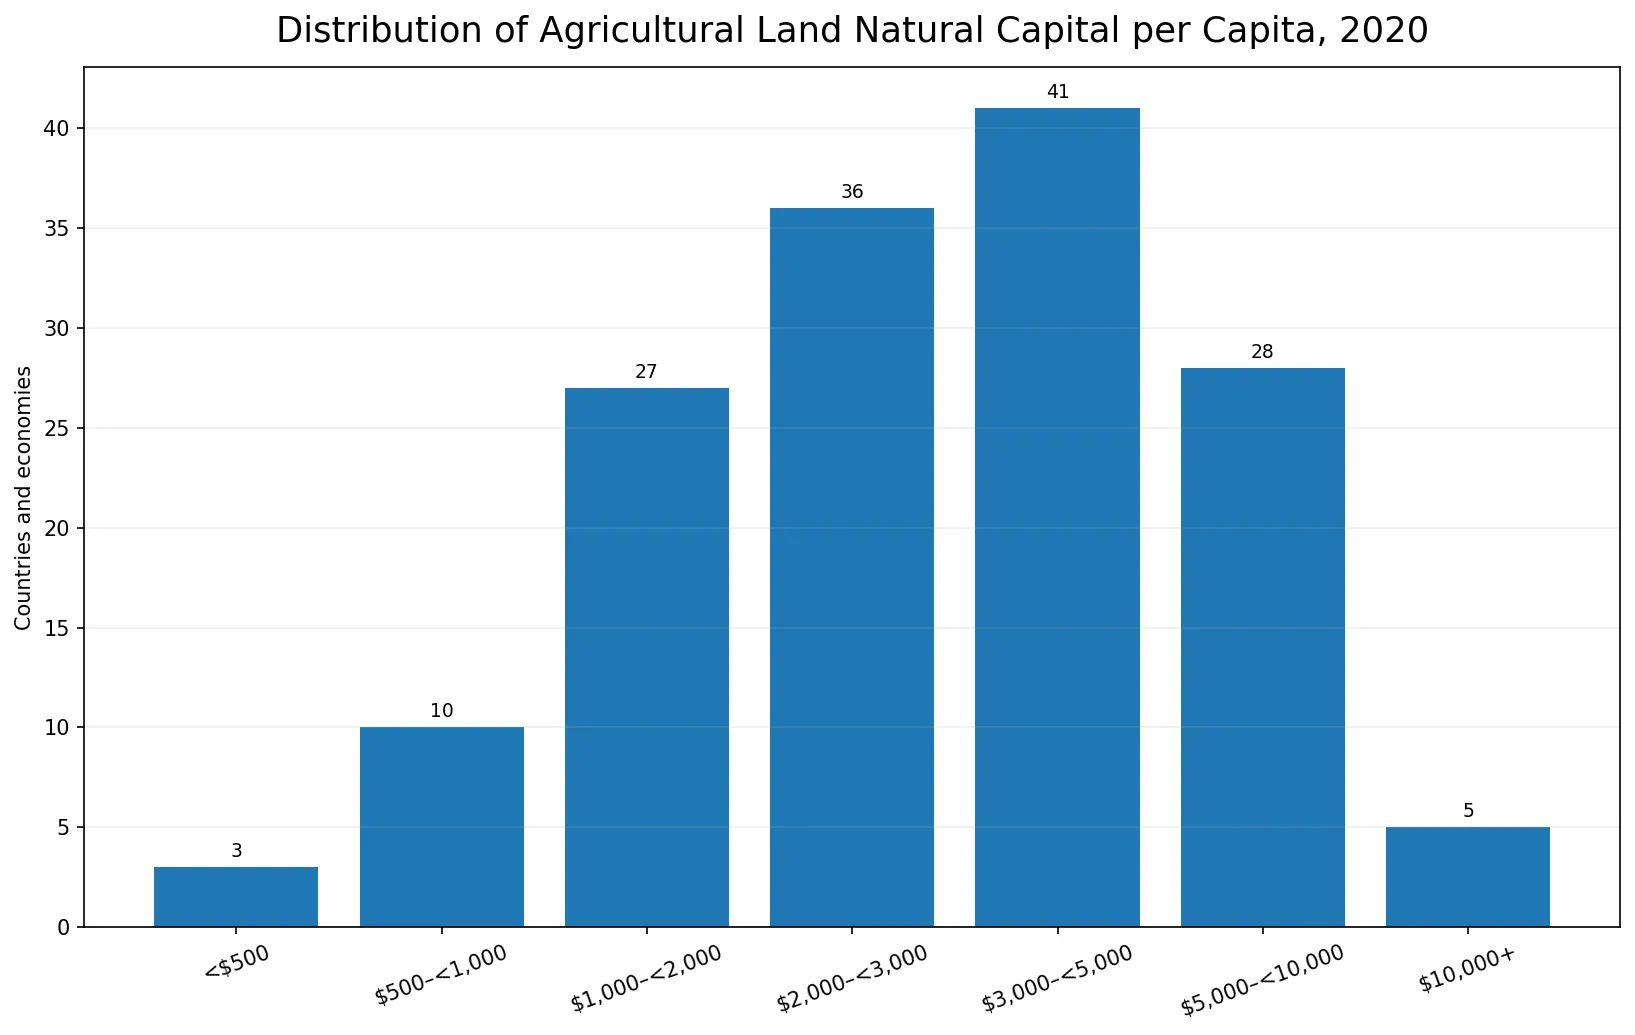
| Per-capita range | Countries/economies | Share of 150 |
|---|---|---|
| <$500 | 3 | 2.0% |
| $500–<1,000 | 10 | 6.7% |
| $1,000–<2,000 | 27 | 18.0% |
| $2,000–<3,000 | 36 | 24.0% |
| $3,000–<5,000 | 41 | 27.3% |
| $5,000–<10,000 | 28 | 18.7% |
| $10,000+ | 5 | 3.3% |
Oceania and parts of East and Southeast Asia stand out on the map
New Zealand, Australia and Papua New Guinea place Oceania prominently in the high-value bands. Lao PDR, Viet Nam and China are also high, while Japan and Korea are much lower within the broader East Asian neighborhood. Europe is similarly mixed: Lithuania is above $9,000, whereas Germany is around $1,429 and the United Kingdom below $900.
North America shows another contrast. The United States and Canada are near the low end of this per-capita series, while Mexico is about $2,851. These regional differences should not be assigned to a single cause from this indicator alone. Population, agricultural asset valuation and the composition of cropland and pastureland all matter.
Cropland and pastureland explain the scope of the total agricultural-land series
The World Bank natural-capital framework defines agricultural land as cropland plus pastureland. NW.NCA.AGRI.PC.CD is the combined agricultural-land measure, while NW.NCA.CROP.PC.CD and NW.NCA.PAST.PC.CD isolate the two components. The three series answer related but different questions and should not be treated as duplicate indicators.
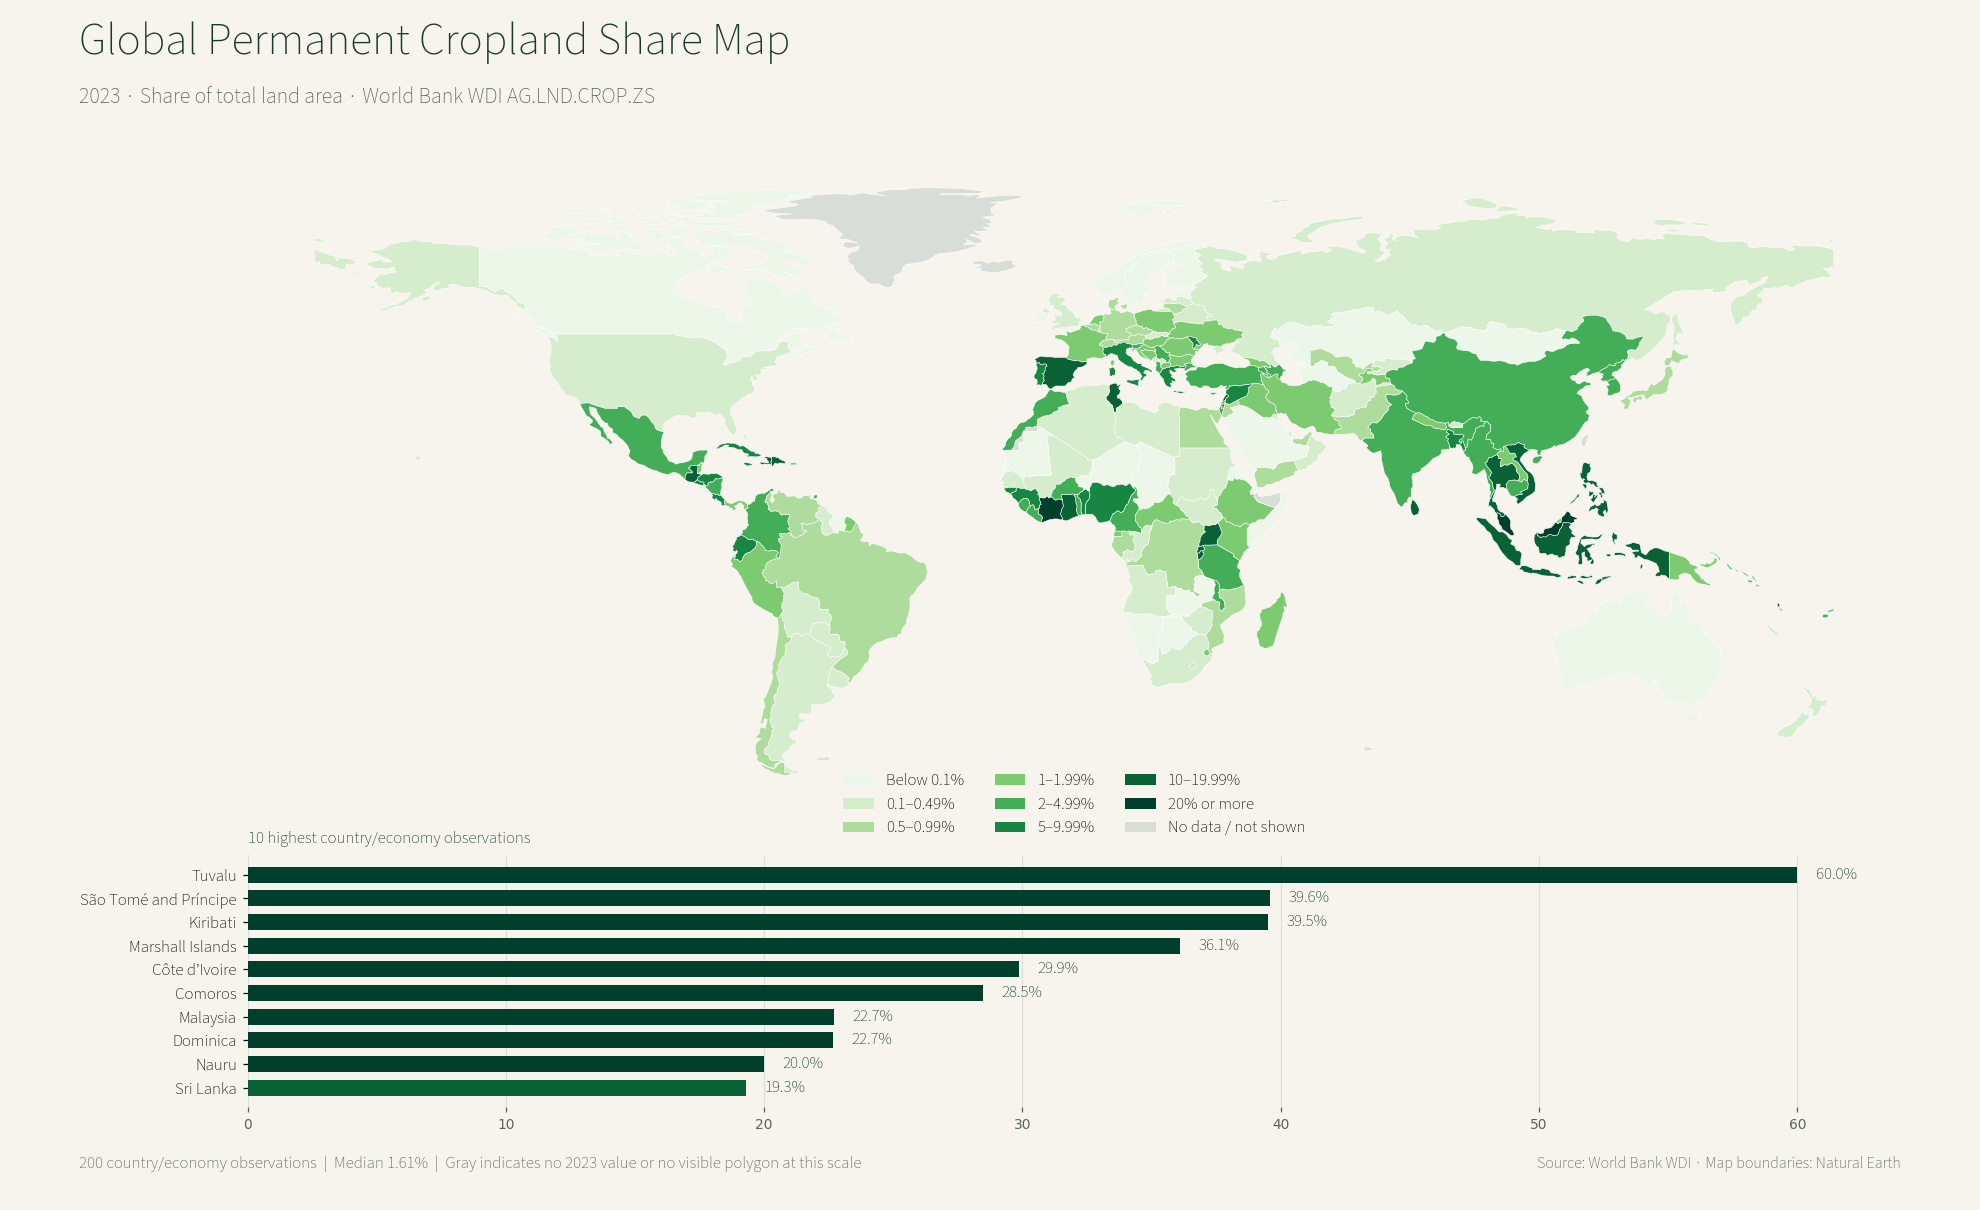
A physical agricultural-land share map is different again. It measures how much of national land area is classified as agricultural, not the monetary asset value assigned to that land per resident. A country can rank high on one measure and much lower on the other.
Selected economies on the same 2020 basis
| Country | Agricultural land value per person |
|---|---|
| New Zealand | $38,914 |
| Australia | $18,740 |
| Lao PDR | $20,670 |
| China | $8,756 |
| Viet Nam | $8,956 |
| India | $4,963 |
| Indonesia | $5,023 |
| Nigeria | $4,882 |
| Argentina | $3,709 |
| South Africa | $3,223 |
| Mexico | $2,851 |
| France | $2,448 |
| Korea, Rep. | $2,080 |
| Brazil | $1,896 |
| Germany | $1,429 |
| Russian Federation | $1,364 |
| Japan | $1,338 |
| United Kingdom | $873 |
| Canada | $614 |
| United States | $550 |
China is about $8,756 per person, Indonesia $5,023, India $4,963, Korea $2,080, Brazil $1,896, Germany $1,429, Japan $1,338, the United States $550 and Canada $614. These are wealth-accounting values for agricultural land, not agricultural GDP, household farm earnings or observed land-sale prices.
A high value is not automatically a sustainability score
A high agricultural-land natural-capital value means the estimated productive asset value is large relative to population under the World Bank methodology. It does not by itself establish stronger soil health, biodiversity, water management, food security, farm-income distribution or sustainable land-use practices.
A low value likewise does not mean agriculture is economically unimportant. Agriculture can matter through output, employment, exports and food supply even when this particular per-capita asset measure is modest. The indicator is best used as one balance-sheet view of agricultural land within a broader set of economic and environmental measures.
Data source and mapping method
The statistical source is World Bank NW.NCA.AGRI.PC.CD. The verified dataset contains 150 country/economy observations, all dated 2020, after aggregate groups are excluded. Every mean, median, quartile, band count and table value on this page is calculated directly from those rows.
ISO-3 codes are joined to a simplified Natural Earth world boundary layer for the map. The statistical sample contains 150 observations and 142 low-resolution polygons are directly matched to values. Small islands and separately reported territories can remain in the statistics without a distinct visible polygon at global scale.
Frequently Asked Questions
What does agricultural land natural capital per capita measure?
It is the World Bank's estimated agricultural-land asset value divided by population. It is not farmland sale price, farm income, agricultural output or hectares per person.
Does agricultural land include both cropland and pastureland?
Yes. In the World Bank Changing Wealth of Nations framework, agricultural land is composed of cropland and pastureland, which are also available as separate wealth indicators.
Which economy has the highest 2020 value?
New Zealand is highest at about $38,914 per person, followed by Lao PDR at about $20,670 and Australia at about $18,740.
Does a high value mean agriculture is more productive or sustainable?
Not necessarily. The indicator is a per-capita wealth-accounting measure and does not directly measure yields, farm income, food security, soil health or sustainability.
Related Articles
The related articles separate the cropland and pastureland components and compare the physical share of land used for agriculture.
- Global Agricultural Land Share Map – 2023 Country Comparison
- Global Agriculture, Forestry and Fishing Value Added Map – 2024 Country Comparison
- Global Forest Area Share Map – Country Comparison for 2023
Green Map creates custom-edited map images using open geographic data sources such as geoBoundaries, Natural Earth, OpenStreetMap, and government open data.
These maps are edited visual materials, not raw data files, and are provided for education, documents, presentations, and graphic reference.