The share of adults age 25 and older who have completed at least lower-secondary education varies widely across countries. World Bank World Development Indicators series SE.SEC.CUAT.LO.ZS measures cumulative educational attainment rather than current school enrollment or the graduation rate of today’s students. The verified package contains 203 country/economy observations, with the latest available values ranging from 8.4% to 100.0%.
The most important caveat is time. This is not a clean “2024 ranking.” The package retrieves the most recent non-empty observation for each economy, so reference years range from 1975 to 2024. A total of 169 observations, or 83.3% of the set, are from 2019–2024. The map is therefore useful for seeing broad global differences in adult attainment, but it should not be used as if every country were measured in the same year.
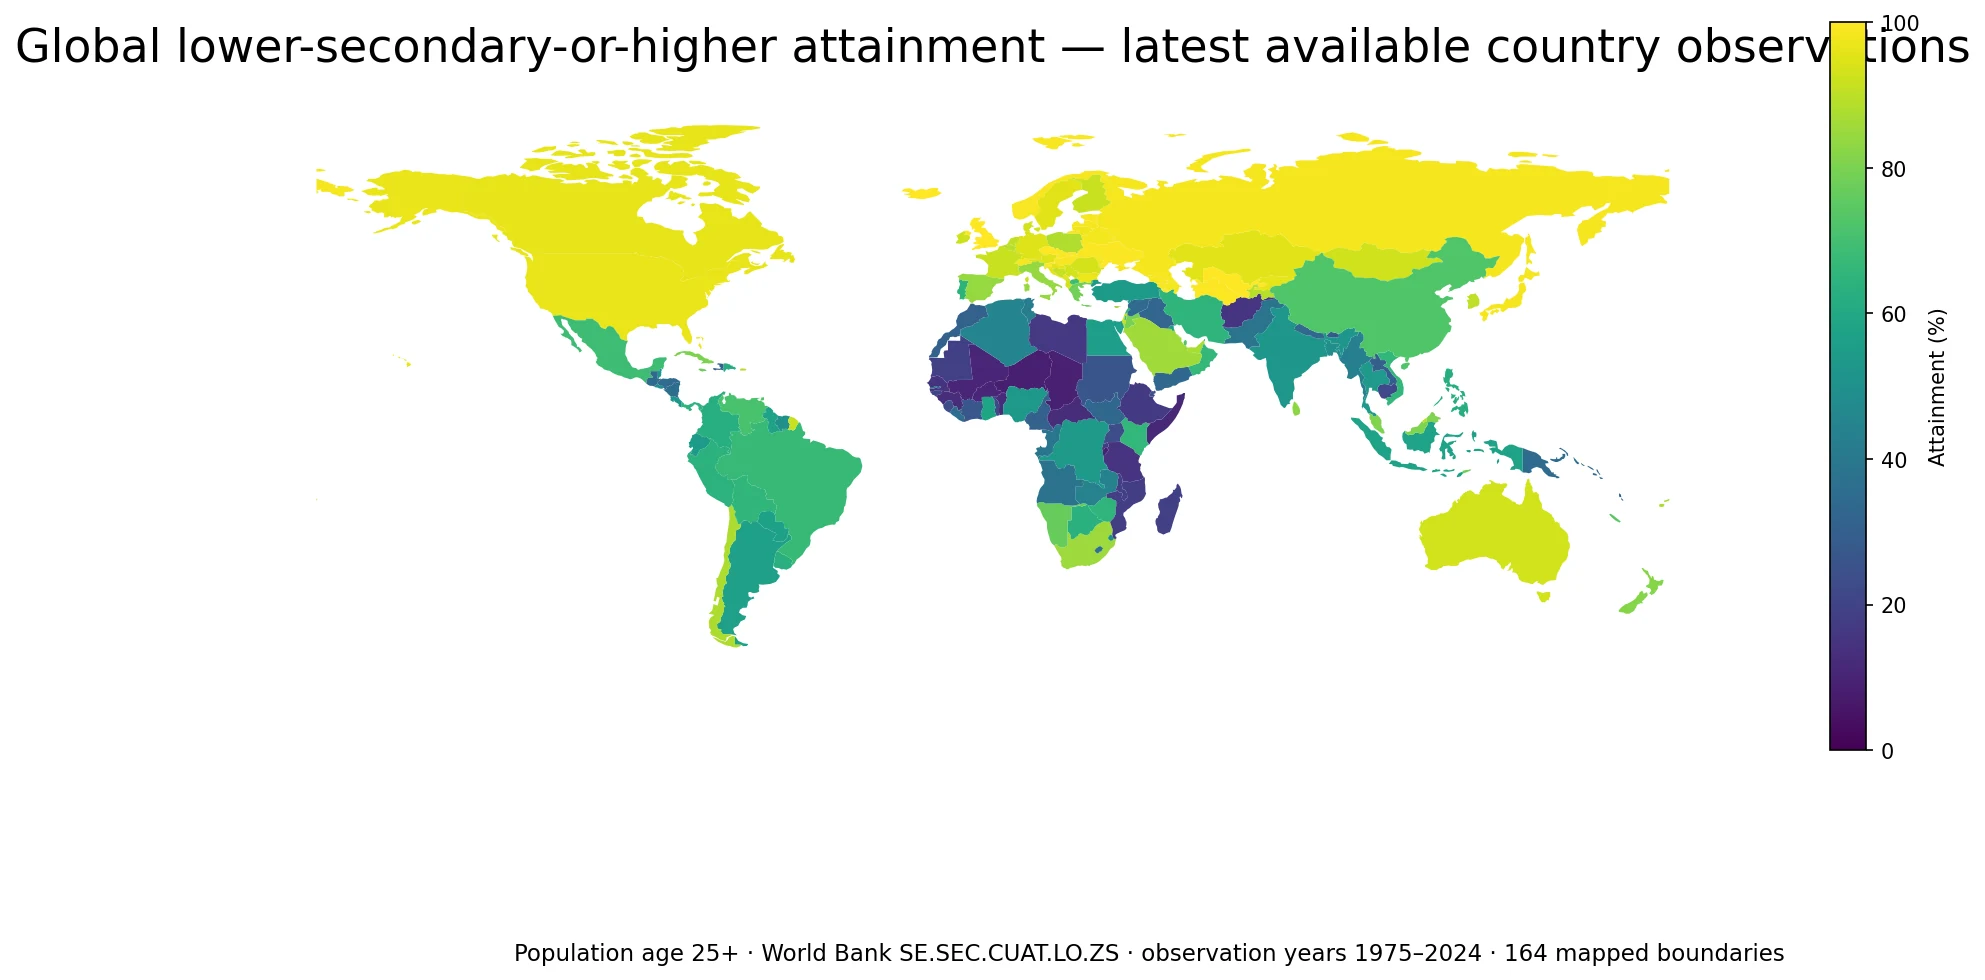
Table of Contents
What this educational-attainment indicator measures
The official series name is “Educational attainment, at least completed lower secondary, population 25+, total (%) (cumulative).” In practical terms, it asks what share of the adult population has completed at least the lower-secondary stage of schooling. School systems are not identical across countries, so lower secondary should be understood as an internationally comparable education level rather than a claim that every country has the same grade structure.
The denominator is the population age 25 and older. That makes this a stock measure of accumulated education in the adult population. It is not the share of children currently enrolled in lower-secondary school, not the completion rate of a current student cohort, and not a test-score measure. Older and younger adult generations are combined, so historical access to schooling continues to influence the number long after a reform has been introduced.
“At least completed lower secondary” also includes people who went on to upper-secondary, technical, college, or university education. A value of 90% therefore means roughly nine in ten adults age 25+ have completed lower secondary or a higher level. It does not mean 90% stopped at that level, and it does not assign a 90-point score to the quality of the national education system.
How wide is the distribution across the latest observations?
Across all 203 latest available observations, the simple median is 69.0% and the unweighted mean is 64.5%. These are descriptive country/economy statistics; they are not population-weighted global attainment rates. There are 54 observations at 90% or above, 28 between 80% and 89.9%, and 38 between 60% and 79.9%. At the other end, 53 observations are below 40%.
If the comparison is limited to observations from 2019 onward, 169 economies remain. Their median is 73.7% and their simple mean is 67.1%. This recent subset is more useful for broad comparison than the full latest-value set, but it is still not a same-year panel: some rows are from 2019, others from 2020–2024.
High and low recent observations
Within the 2019–2024 subset, the highest observations include Uzbekistan, Czechia, the United Kingdom, Iceland, Turkmenistan, the Slovak Republic, Ukraine, Slovenia, Armenia, and Hungary. The upper end is heavily represented by Europe and Central Asia. Differences of a few tenths of a percentage point at this level should not be treated as meaningful rankings of education quality, because the metric records attainment status, not learning outcomes.
| Country/economy | Reference year | Adults 25+ with at least lower secondary |
|---|---|---|
| Uzbekistan | 2022 | 100.0% |
| Czechia | 2023 | 99.9% |
| United Kingdom | 2021 | 99.8% |
| Iceland | 2023 | 99.6% |
| Turkmenistan | 2022 | 99.6% |
| Slovak Republic | 2023 | 99.4% |
| Ukraine | 2019 | 99.3% |
| Slovenia | 2023 | 99.3% |
| Armenia | 2023 | 99.1% |
| Hungary | 2023 | 98.9% |
The lowest recent observations include Niger, Chad, Burkina Faso, Mali, Somalia, Benin, the Central African Republic, Senegal, Tanzania, and Afghanistan. Several Sub-Saharan African economies appear near the lower end. That geographic pattern is visible in the data, but the dataset by itself does not establish the cause. Access to schooling, conflict, income, gender gaps, rural isolation, demographic history, and education policy would require separate evidence.
| Country/economy | Reference year | Adults 25+ with at least lower secondary |
|---|---|---|
| Niger | 2022 | 8.4% |
| Chad | 2019 | 8.8% |
| Burkina Faso | 2024 | 10.2% |
| Mali | 2022 | 10.2% |
| Somalia, Fed. Rep. | 2022 | 11.1% |
| Benin | 2022 | 12.3% |
| Central African Republic | 2019 | 12.5% |
| Senegal | 2023 | 14.7% |
| Tanzania | 2022 | 15.1% |
| Afghanistan | 2022 | 15.3% |
How several major economies compare
A selected-country table shows why the indicator should not be reduced to a simple income ranking. The United Kingdom, Japan, the United States, Canada, and Germany are all above 90% in their latest observations. Korea is 89.95% in 2024, South Africa 85.43% in 2024, China 72.40% in 2020, Mexico 69.05% in 2024, and Brazil 67.20% in 2023. Indonesia, Nigeria, and India are in the 50% range, while Ethiopia is 16.60% in 2022.
The reference-year column is as important as the percentage. The United Kingdom’s value is from 2021; Japan and China are from 2020; the United States, Canada, Korea, South Africa, Mexico, and several others have 2024 observations. Ignoring those dates and sorting only the percentages would create a false sense of precision. Broad bands and clear year labels are more defensible than an exact global league table.
| Country/economy | Reference year | Attainment |
|---|---|---|
| United Kingdom | 2021 | 99.8% |
| Japan | 2020 | 98.6% |
| United States | 2024 | 96.6% |
| Canada | 2024 | 96.4% |
| Germany | 2023 | 94.8% |
| Australia | 2024 | 93.2% |
| France | 2023 | 91.6% |
| Korea, Rep. | 2024 | 90.0% |
| South Africa | 2024 | 85.4% |
| China | 2020 | 72.4% |
| Mexico | 2024 | 69.0% |
| Brazil | 2023 | 67.2% |
| Indonesia | 2023 | 56.7% |
| Nigeria | 2024 | 53.4% |
| India | 2023 | 52.7% |
| Ethiopia | 2022 | 16.6% |
Why the observation-year mix matters
Of the latest observations in this package, 40 are from 2024, 57 from 2023, and 35 from 2022. Another 13 are from 2021, 8 from 2020, and 16 from 2019. Together, that gives 169 observations from 2019–2024. The remaining 34 observations are from 2018 or earlier, and a small number reach much further back.
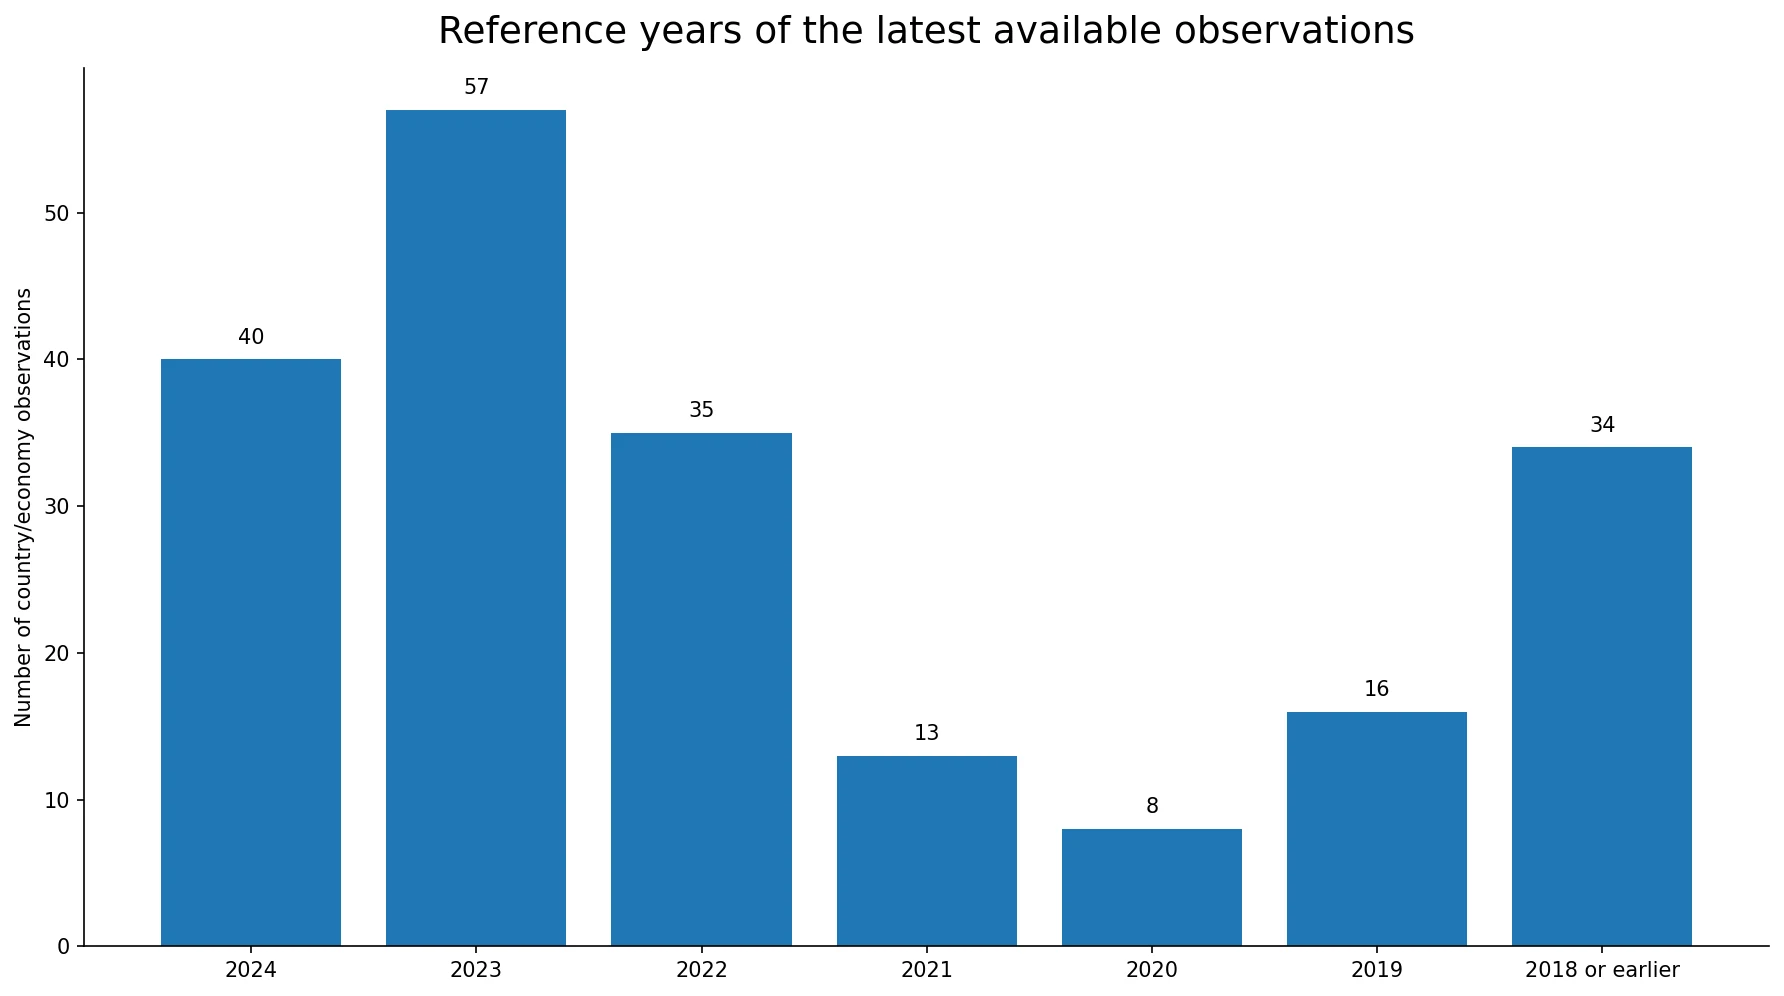
This timing difference changes how the map should be interpreted. A dark or light polygon is not automatically a 2024 condition. Some countries are represented by 2024 surveys while others are represented by older observations. Adult educational attainment usually changes more slowly than a monthly or annual economic indicator, but very old observations can still be poor descriptions of the current population. Any claim about recent reform, convergence, or progress should use matched years or country-specific time series rather than this latest-value snapshot alone.
What the spatial pattern can and cannot tell us
The map shows many high-attainment observations across Europe and parts of Central Asia, as well as high values in North America, Australia, Japan, and Korea. Lower observations are prominent in the Sahel and in several other Sub-Saharan African countries. South and Southeast Asia display a wider spread. Those patterns are useful for identifying where adult completion of at least lower-secondary education is reported at relatively high or low levels.
The map does not explain why those patterns exist. Adult attainment can reflect decades of school construction, compulsory-education policy, conflict, migration, gender inequality, rural access, age structure, and household resources. None of those explanatory variables is contained in the packaged table. Spatial clustering is evidence of geographic difference, not proof of a single cause or a policy effect.
What this indicator can—and cannot—answer
The indicator can answer a straightforward question: what share of adults age 25+ in each reporting economy have completed at least lower-secondary education? It can reveal large cross-country gaps and, with additional time-series data, it can help track long-run changes in the stock of adult education. Because the metric is a percentage, it also allows countries of very different population sizes to be compared on a common scale.
It cannot measure learning quality, test performance, literacy, university participation, present-day school completion, or the distribution of attainment within the adult population. A national value can hide large differences by sex, age, region, ethnicity, income, or urban/rural location. Small cross-country gaps should also be interpreted cautiously because survey design, reporting schedules, and statistical uncertainty can differ.
Data source and calculation method
The statistical source is World Bank World Development Indicators series SE.SEC.CUAT.LO.ZS. The cleaned package retains one latest non-empty observation for each country/economy row and excludes regional and income-group aggregates. The unit is percent of the population age 25 and older. All means, medians, threshold counts, and table values in this article were calculated directly from the verified CSV supplied with the writing package.
The statistical analysis uses all 203 numeric rows. The map joins ISO3 codes to a low-resolution Natural Earth boundary layer and fills 164 country polygons. Small islands, separately reported territories, and economies without a matching low-resolution polygon can remain in the statistics without appearing as a filled shape. An unfilled map area should therefore not be read as a zero value. The official series page is World Bank SE.SEC.CUAT.LO.ZS.
Frequently Asked Questions
Is this a 2024 country ranking of educational attainment?
No. The package uses each country/economy’s latest non-empty observation, so reference years differ. Most are from 2019–2024, but some are older.
Is this the current lower-secondary school completion rate for students?
No. It measures the cumulative share of the population age 25+ that has completed at least lower-secondary education. Current enrollment and cohort completion are separate indicators.
Does a 90% value mean the education system scores 90 out of 100?
No. It means about 90% of adults age 25+ have completed at least lower-secondary education. It does not measure learning quality or test performance.
Does an unfilled country on the map mean the attainment rate is zero?
No. Some small economies and territories do not have a matching polygon in the low-resolution boundary layer, even when the statistical row has a value.
Related Articles
- Global Internet Use Map – 2024 Country Comparison
- Global GDP Growth Map – Country Patterns in 2025
- World Bank Data Catalog Licensing Guide
Green Map creates custom-edited map images using open geographic data sources such as geoBoundaries, Natural Earth, OpenStreetMap, and government open data.
These maps are edited visual materials, not raw data files, and are provided for education, documents, presentations, and graphic reference.