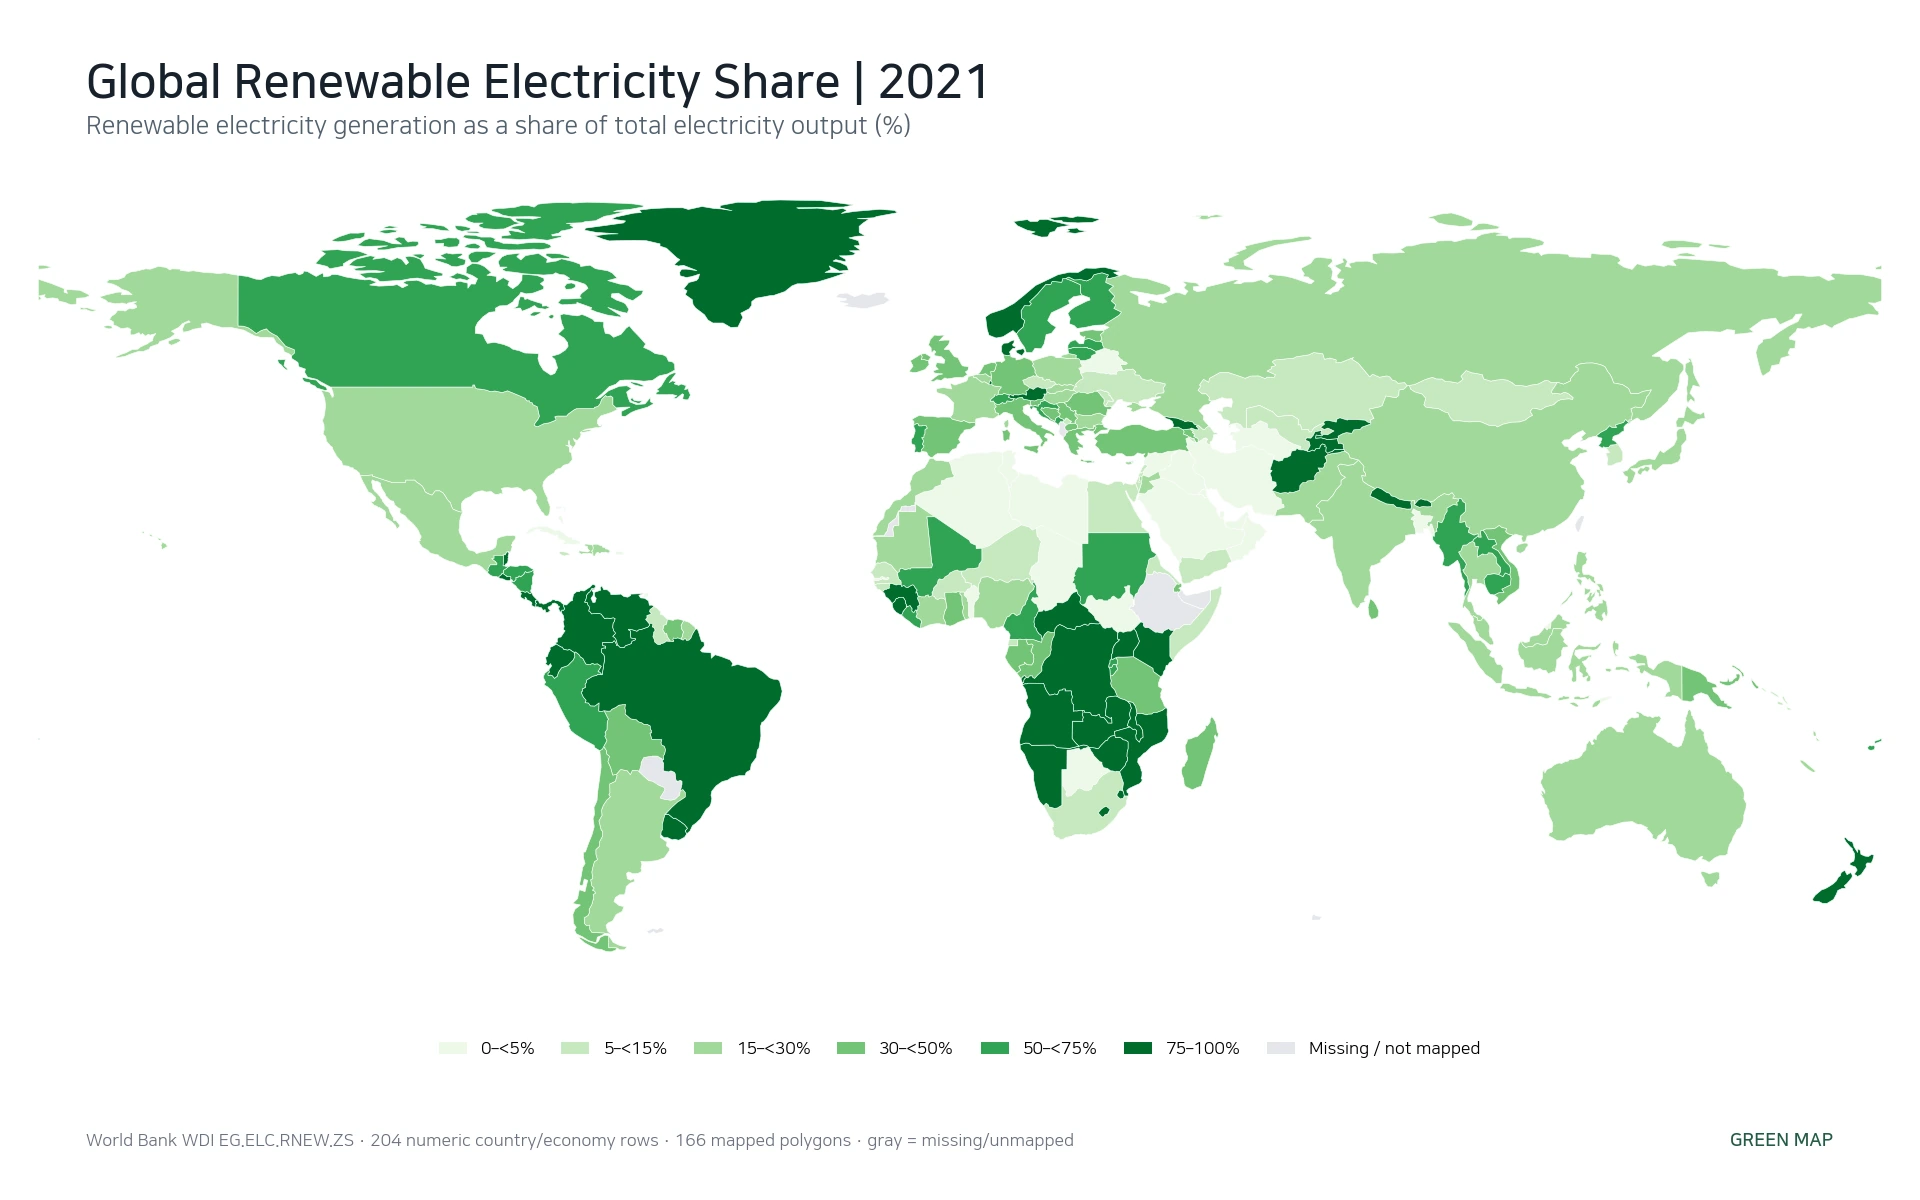
The World Bank Monthly food price inflation estimates by country dataset provides monthly country-level estimates designed to help track food price movements when conventional price statistics may arrive late or offer only a broad national picture. It is not a complete “all countries” global inflation map. The current World Bank Microdata Library record covers 37 countries, spans January 2008 through August 2026, and lists version 2026-08-24. The series can support country comparisons, charts, and thematic maps, but it should not be treated as identical to an official national Consumer Price Index (CPI).
The safest way to use this source is to treat it as a monthly country-level food price inflation estimate dataset: useful for comparison and mapping, but distinct from a finished map service and distinct from official CPI series.
What the dataset actually provides
The World Bank Data Catalog explains that food price inflation is important for economic policy, while traditional consumer-price sources can be delayed during crises and may be available only at an aggregate level. The dataset is intended to extend the view of price developments by using ongoing subnational price information and machine-learning methods to impute missing observations. This makes it especially relevant where localized price shocks matter and conventional information is incomplete.
The linked Microdata Library record identifies the geographic unit for the country-level series as Country. That distinction matters. The broader Real Time Food Prices product family also contains market-level estimates at geo-referenced market locations, but those are not the same table as the country inflation series covered here. If the goal is a country comparison map, use the country-level inflation data; if the goal is local market analysis, verify that you have selected the separate market-level product.
| Item | What the current official record shows |
|---|---|
| Dataset | Monthly food price inflation estimates by country |
| Geography | 37 countries; geographic unit: Country |
| Time coverage | January 2008 to August 2026 |
| Current version | 2026-08-24 |
| Update behavior | A live dataset in which historical and current estimates may be revised as more price information becomes available |
| Access route | Read metadata in the Data Catalog, then follow the Microdata Library link for data and documentation |
Start by checking the 37-country coverage
“By country” does not mean that every economy in the world is included. The current Microdata Library record lists Afghanistan, Armenia, Bangladesh, Burkina Faso, Burundi, Cameroon, Central African Republic, Chad, Democratic Republic of the Congo, Republic of the Congo, Ethiopia, The Gambia, Guatemala, Guinea, Guinea-Bissau, Haiti, Indonesia, Iraq, Kenya, Lao PDR, Lebanon, Liberia, Libya, Madagascar, Malawi, Mali, Mauritania, Mozambique, Myanmar, Niger, Nigeria, Senegal, Somalia, South Sudan, Sri Lanka, Sudan, and Uganda.
This coverage should be visible in any map or chart you create. A title such as “global food inflation in 2026” would overstate what the source contains. Countries outside the dataset should remain “no data,” not be assigned a value of zero. A blank country on a map means that this specific dataset does not provide a comparable value there; it does not mean food prices were unchanged.
A practical way to access the data
- Open the World Bank Data Catalog dataset page. Check the description, geographical coverage, temporal coverage, access classification, and license before working with the values.
- Use the “Visit the Microdata Library to access data and documentation” link shown on the catalog page. This is the official path from the dataset landing page to the downloadable material.
- On the Microdata Library record, verify the country list, date range, version, and reference ID before downloading.
- Choose Get Microdata and review the terms and conditions. When reusing the data, follow the attribution instructions included with the metadata.
- Before making a country comparison, verify that the selected observations refer to the same month and the same country-level inflation series.
- For later updates, return to the official record and check Version Date and Last modified. Do not assume that a previously downloaded file remains the latest version.
Why these estimates are not the same as official CPI
The Microdata Library describes Real Time Prices as a live World Bank dataset compiled from a combination of direct price measurement and machine-learning estimation of missing price data. The underlying price information includes sources such as the World Food Programme, FAO, and selected national statistical offices. Missing observations can be predicted using exchange rates and price information from other market locations or related items. That means the series contains modeled information as well as directly observed inputs.
The official documentation explicitly cautions that these estimates can be used as proxies for subnational price inflation or as substitutes for national CPI indicators when complete information is unavailable, but they may differ from other official sources, including inflation series in the World Development Indicators. For that reason, the dataset is best used as a real-time or near-real-time estimate product rather than labeled as the definitive official CPI for each country.
How to use the data in a map without overstating it
The dataset page is not a GIS boundary-download service and it does not provide a finished world choropleth as the main product. Its value for mapping comes from the country-level values and country codes. You can join those values to an appropriate country boundary layer in a GIS or mapping workflow and produce a thematic map for one specific month.
- Coverage: make clear that the current dataset contains 37 countries rather than the whole world.
- Reference month: use one common month for a cross-country map.
- Missing data: preserve missing countries as no-data areas instead of converting them to zero.
- Version: record the dataset version because the live series can be revised.
- Method: disclose that estimates can include machine-learning imputation, not only direct observations.
- Comparison: do not label these values as the same series as national CPI or another World Bank inflation indicator without checking definitions.
Do not confuse the update date with the observation month
The current record runs through August 2026, but that does not automatically guarantee that every country has a complete observation for every field at the same point in time. When creating a cross-country map, filter the actual data to one reference month and confirm that each included country has a value for that month. Mixing observations from different months can make time differences look like geographic differences.
The “Last modified” and “Version Date” fields describe maintenance of the dataset record. They are not substitutes for the observation date attached to each value. A reproducible map should therefore record both the month represented by the data and the version of the dataset that was downloaded.
Country-level and market-level products are different
The Microdata Library lists both country-level inflation and market-level estimates within the Real Time Food Prices family. The country-level series is designed for comparisons across the covered countries. The market-level products contain more detailed item and location information at geo-referenced markets. They answer different spatial questions and should not be merged casually as if they were one indicator.
For a country map, keeping the workflow at the country level makes the legend, period, and spatial unit easier to explain. If a later project asks why prices changed within a particular country, that is the point to examine the separate market-level datasets and their product-specific documentation rather than stretching the country series beyond its intended unit.
Licensing, attribution, and reproducibility
The World Bank Data Catalog classifies the dataset as Public and lists the license as Creative Commons Attribution 4.0. The Microdata Library terms also require attribution in the manner indicated in the metadata. A public chart or map should name the World Bank dataset and record the reference month and dataset version used. That is more informative than a generic “World Bank” source note and makes later updates easier to reproduce.
The official record also notes that the data are provided “as is” and “as available,” with corrections made when errors are discovered and can be addressed. Because this is a live estimate series, values should be rechecked when a map or article is refreshed rather than assumed to be permanently fixed after one download.
When this source is a good fit
- Comparing monthly food price inflation across the 37 currently covered countries
- Tracking food-price movements where conventional price statistics may be delayed or incomplete
- Building a table, chart, or country-level thematic map from an official open dataset
- Keeping a repeatable workflow tied to a documented World Bank version and reference ID
It is not sufficient by itself when you need every country in the world, when only official national CPI releases are acceptable, or when the research question requires local market locations rather than country-level inflation. The dataset is strong precisely because its scope and estimation approach are documented; the most reliable use is to stay within those documented boundaries.
Official sources: World Bank Data Catalog – Monthly food price inflation estimates by country · World Bank Microdata Library – Monthly food price inflation estimates by country
Frequently asked questions
Does this dataset cover every country in the world?
No. The current World Bank Microdata Library record lists 37 countries. Countries outside that coverage should be treated as not available in this dataset, not as having zero food price inflation.
Are these values the same as each country’s official CPI?
No. The series combines direct price information with machine-learning estimation of missing data, and the World Bank notes that the estimates may differ from other official inflation sources.
Can I download a ready-made monthly food inflation world map?
The main product is the dataset and its documentation, not a finished GIS map package. You can download the country-level values and join them to a suitable country boundary layer to create a thematic map for a selected month.
Why should I record the dataset version?
Real Time Prices is a live dataset, so historical and current estimates may be revised when additional information becomes available. Recording both the reference month and the dataset version makes a chart or map reproducible.
Related Articles
Monthly food price inflation does not describe an economy by itself. These related Insight articles provide separate measures of real growth, output per person, and labor-market conditions, which can be compared alongside food-price changes without treating them as the same indicator.
- Global GDP Growth Map – Country Patterns in 2025
- Global GDP per Capita Map – Country Levels in 2025
- Global Unemployment Rate Map – Country Patterns in 2025
Green Map creates custom-edited map images using open geographic data sources such as geoBoundaries, Natural Earth, OpenStreetMap, and government open data.
These maps are edited visual materials, not raw data files, and are provided for education, documents, presentations, and graphic reference.