The Jackson County Indiana Land Cover Map set gives a quick view of how farmland, forest, developed land, wetlands, and water are arranged across the county in 2025. Agriculture covers 50.31% of the county and forest accounts for 32.69%, but the map is not uniform: the large built area around Seymour, extensive woods in the west, and wetland corridors through the agricultural interior create clear local contrasts.
Four map views are included on this page: general land cover, forest and farmland, impervious surface and developed land, and a 1985–2025 classification comparison. After reviewing the WebP maps on screen, readers can download one ZIP containing the four original JPG files for printing, classroom use, presentations, or side-by-side county analysis.
Table of Contents
Jackson County is split between broad farm country and a substantial forested landscape
The 2025 summary lists agriculture at 50.31%, forest at 32.69%, developed land at 10.18%, wetlands at 5.83%, and water at 0.78%. The forest-and-farmland version also reports grassland at 0.11% and shrubland at 0.03%. Those numbers matter, but the spatial pattern is more informative than the countywide totals alone. Cropland dominates much of the middle and northeastern part of the county, while much larger forest blocks occupy the west and southwest.
Seymour forms the most conspicuous developed area in the northeastern half of the map. Smaller built concentrations are visible around Brownstown farther southwest and around settlements toward the southeastern edge. Thin developed traces also follow portions of the road network. These red areas should not be read as municipal boundaries, however. Land-cover classification describes the surface seen by the dataset, not the legal limits of a city, town, zoning district, or parcel.
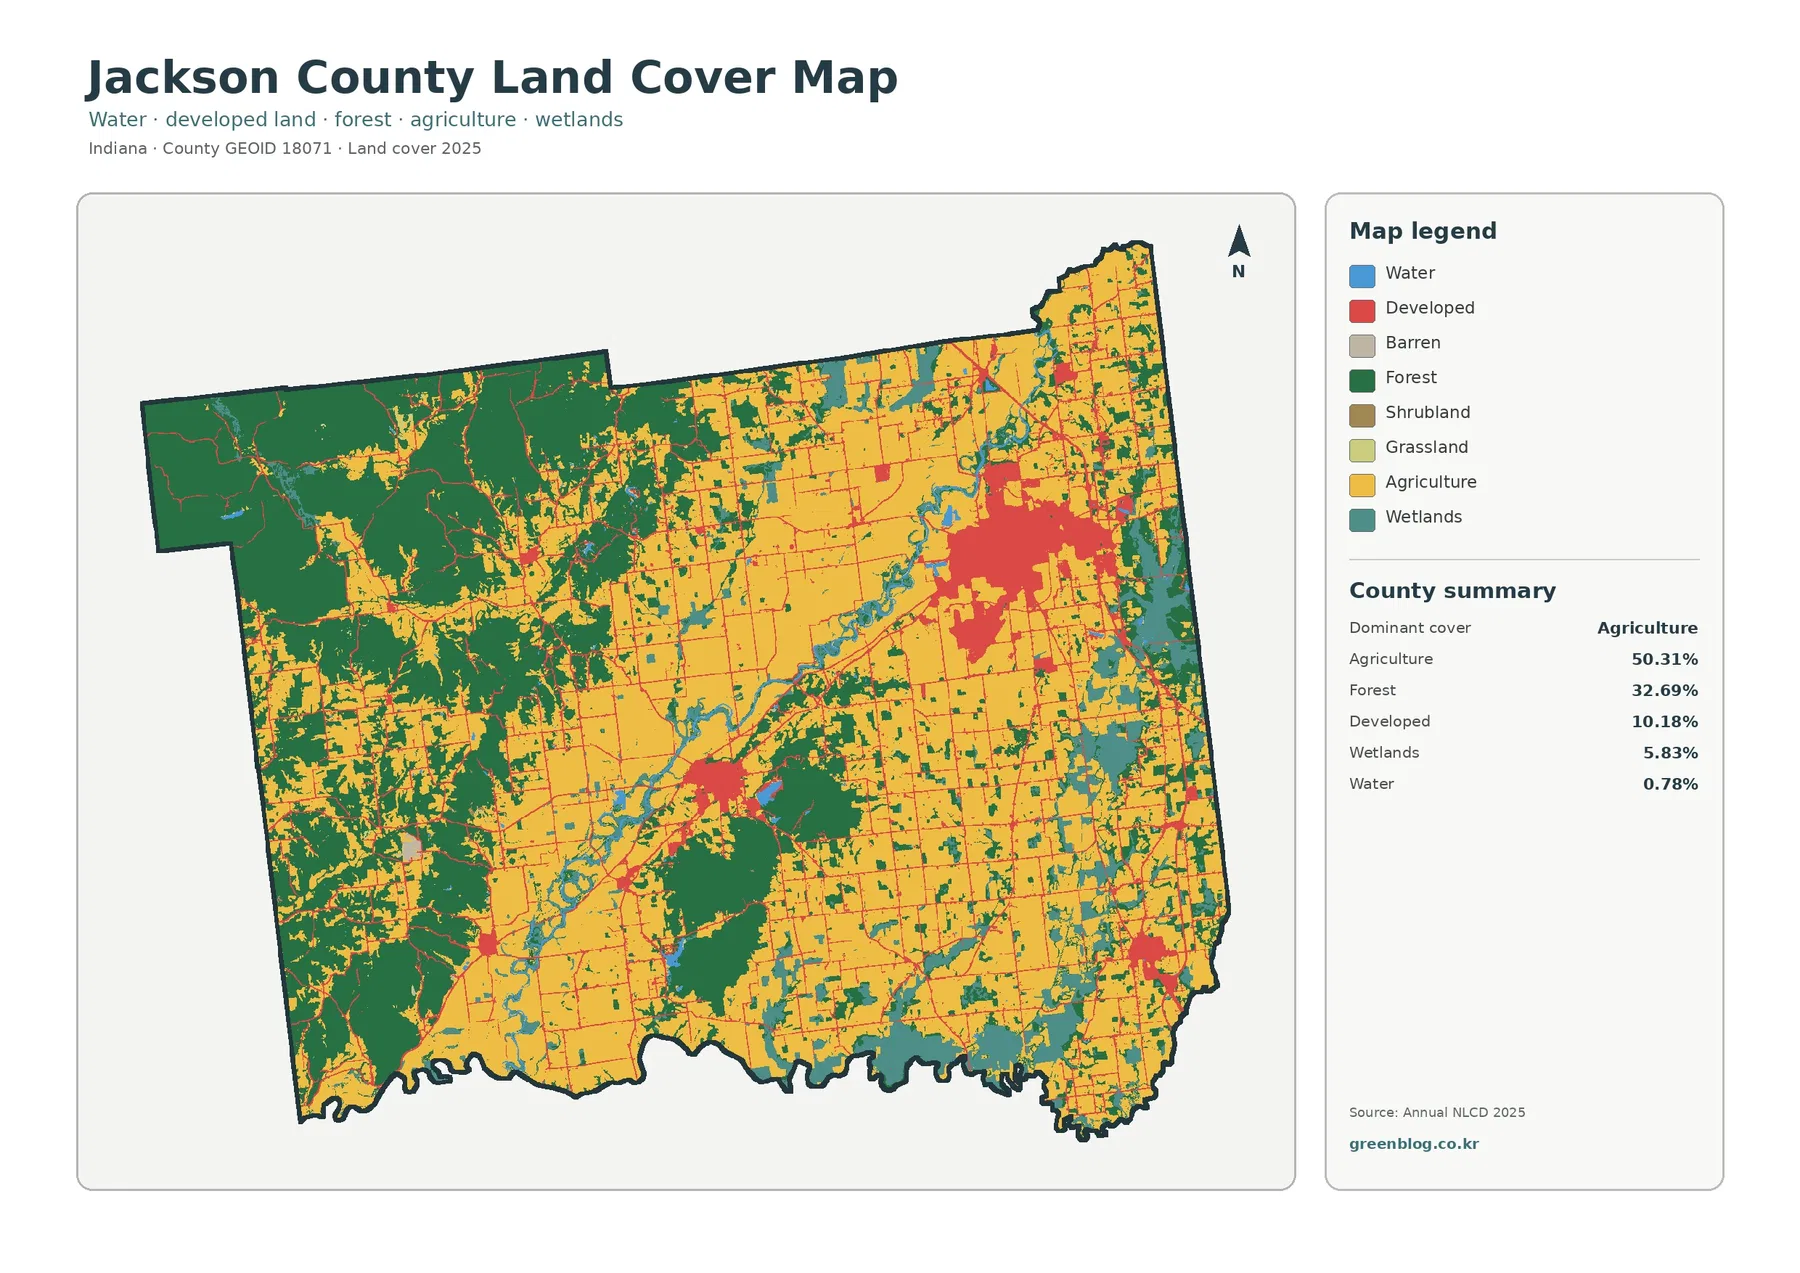
The western side looks distinctly more wooded than the central and eastern agricultural areas. Forest also appears in smaller patches beside fields and along stream corridors away from the main western blocks. Farmland, meanwhile, forms large continuous-looking areas through the county interior and around the smaller forest patches. A viewer who only reads the 50.31% agriculture figure would miss how strongly the western landscape differs from the northeastern half.
Land cover is not the same thing as land use or ownership. Annual NLCD classifies what covers the ground at the scale of raster cells, such as crops, trees, built surfaces, wetlands, or open water. A yellow agricultural cell does not define a farm parcel, and a red developed cell does not establish residential or commercial zoning. Property lines, legal land use, building permissions, and ownership require separate county records.
Impervious cover is concentrated in Seymour and remains light across most farm and forest areas
Impervious surface means pavement, rooftops, parking lots, and other hard surfaces that do not readily absorb water. Jackson County has a mean impervious value of 2.64% in the 2025 summary, and 1.40% of the county is shown in the 50% or greater impervious category. Developed land covers 10.18%. Those figures answer different questions because a developed class can still contain lawns, trees, and other permeable surfaces.
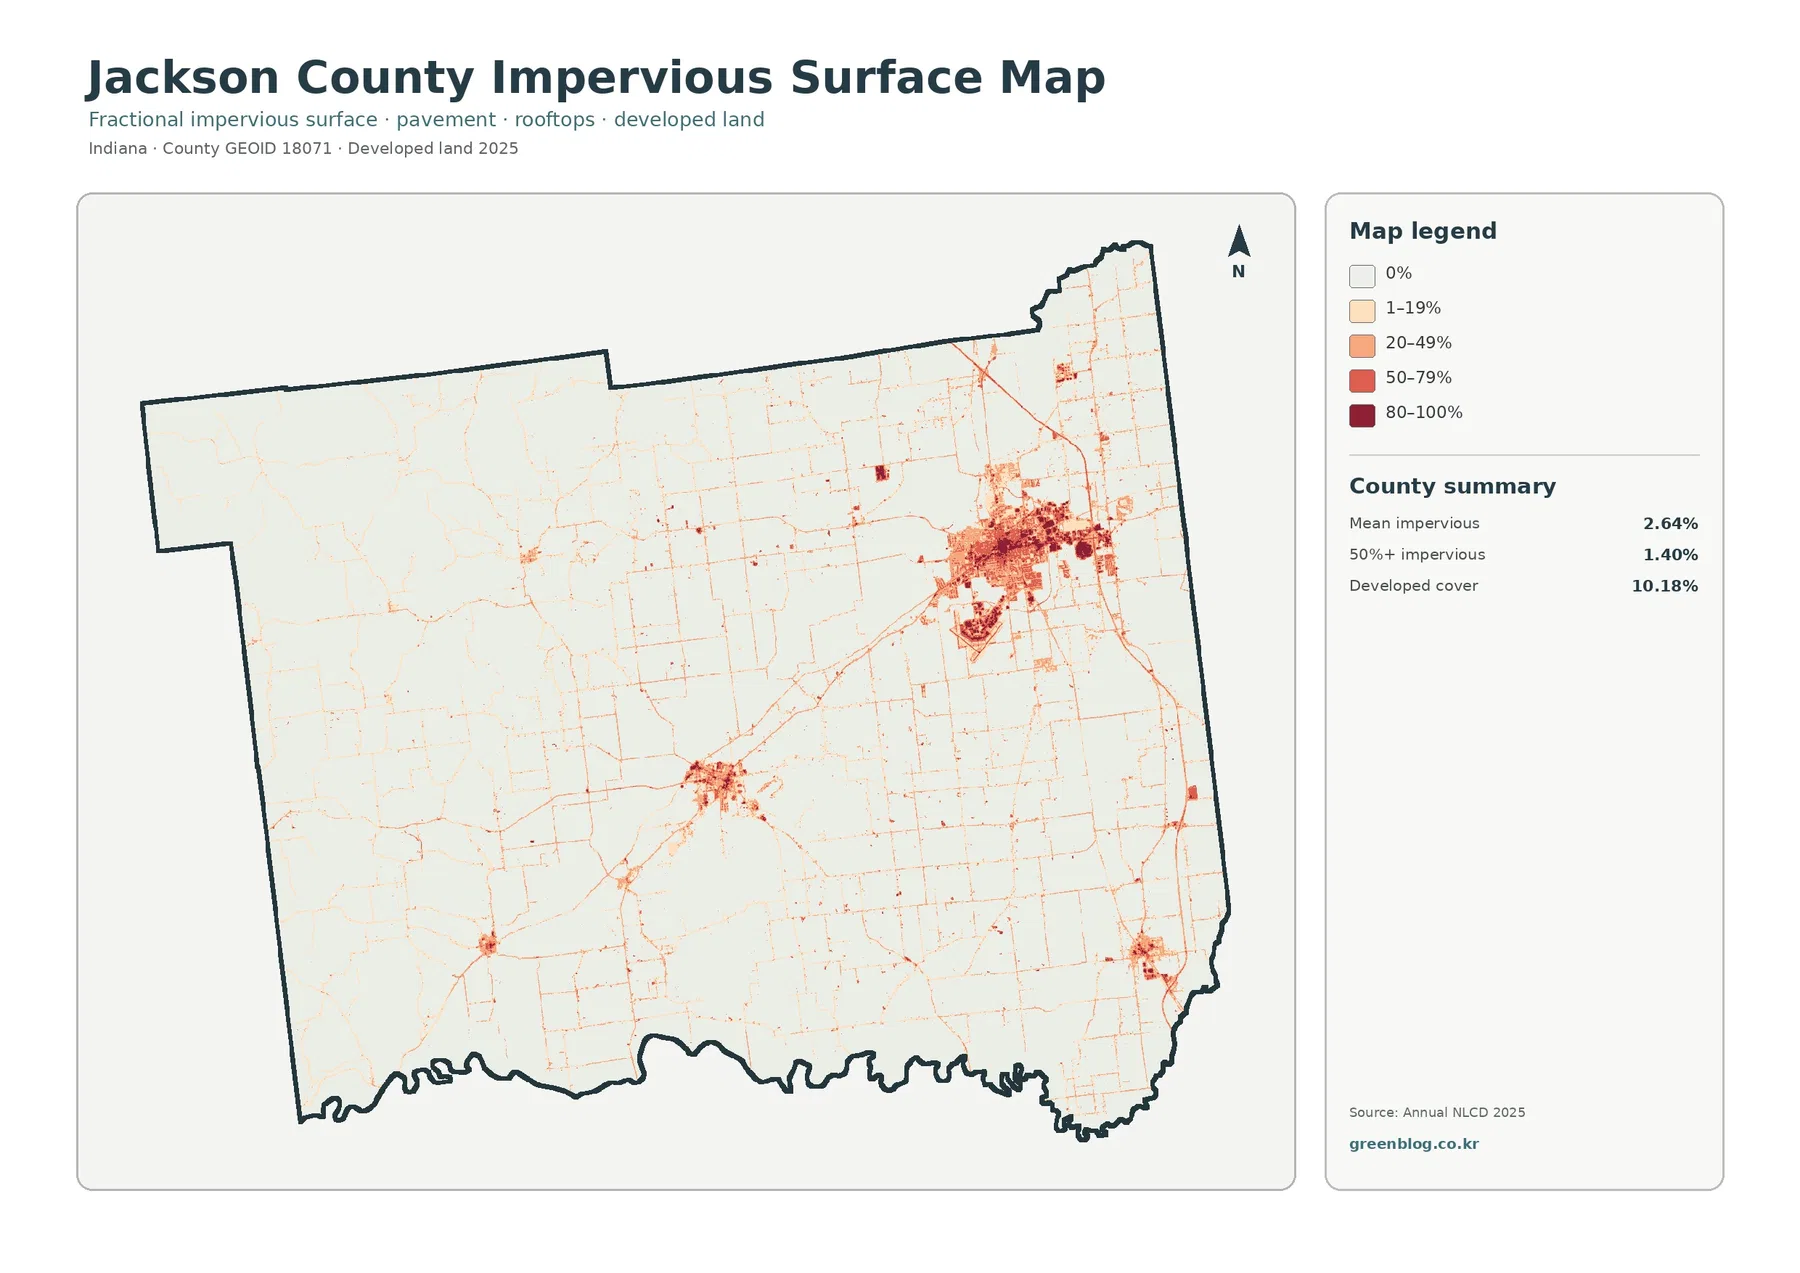
Seymour is the darkest and largest concentration on this map. Brownstown and smaller settlements form more limited clusters, while major road alignments appear as narrow traces crossing otherwise pale areas. Most of the central farm country and western woods remain very light. Comparing this view with the general land-cover map helps separate “developed land” as a land-cover class from the actual concentration of hard surfaces within that developed area.
A countywide mean of 2.64% should not be applied to every neighborhood. The extensive acreage of farmland and forest lowers the overall average, even though built-up parts of Seymour contain much higher local values. This is why impervious data are most useful when the map and the summary number are read together rather than treating the average as a description of every location.
Impervious cover alone is not a flood-risk map. Runoff also depends on topography, soils, storm drainage, stream levels, and rainfall. The map can identify places where pavement and buildings are concentrated, but flood or drainage analysis should use additional hydrologic and local infrastructure information.
Wetlands are a small countywide share compared with farms and forests, but they form visible river corridors
Wetlands account for 5.83% of Jackson County, while open water covers 0.78%. Their importance is easier to see on the map than in the percentages because teal wetland areas often follow long, narrow drainage corridors through the agricultural landscape. Indiana’s Natural Resources Commission lists both the East Fork of White River and the Muscatatuck River for Jackson County. The land-cover map itself does not label individual streams, so official waterway information is useful when identifying the county’s broader river setting.
Open water appears as a much smaller blue class, sometimes next to wetlands or forest. The difference between the 5.83% wetland share and the 0.78% water share is a reminder that a river landscape is not represented by blue water alone. Floodplain vegetation, saturated ground, and other wetland cover may occupy adjacent areas. At the same time, an NLCD wetland class is not automatically a regulatory wetland boundary and should not be used by itself for permitting decisions.
Wooded areas frequently meet the wetland corridors in the map, especially where the drainage network passes through farmland. That visual relationship can help with watershed lessons or broad habitat comparisons. It does not establish water quality, flood frequency, stream condition, or species presence. Those questions require hydrologic records, field surveys, and other environmental sources.
The western forest blocks stand out when developed land is removed from the visual foreground
The forest-and-farmland map simplifies the county by emphasizing woods, cropland, pasture or hay, wetlands, and water. That makes the western forested portion especially easy to recognize. Indiana DNR describes Jackson-Washington State Forest as a large state forest spanning Jackson and Washington counties, with its main forest and office area southeast of Brownstown. The land-cover map does not draw the management boundary of that state forest, but the DNR information provides useful context for the extensive wooded landscape visible in this part of the county.
Fields are more dominant across the central part of Jackson County and continue toward the northeast. Near the western woods, agricultural areas become more broken up, with fields appearing between wooded slopes and other natural cover. Because the map does not identify crop species, it cannot tell a reader whether a specific field contains corn, soybeans, hay, or another crop. Crop type, acreage, and production need agricultural statistics or field-level data.
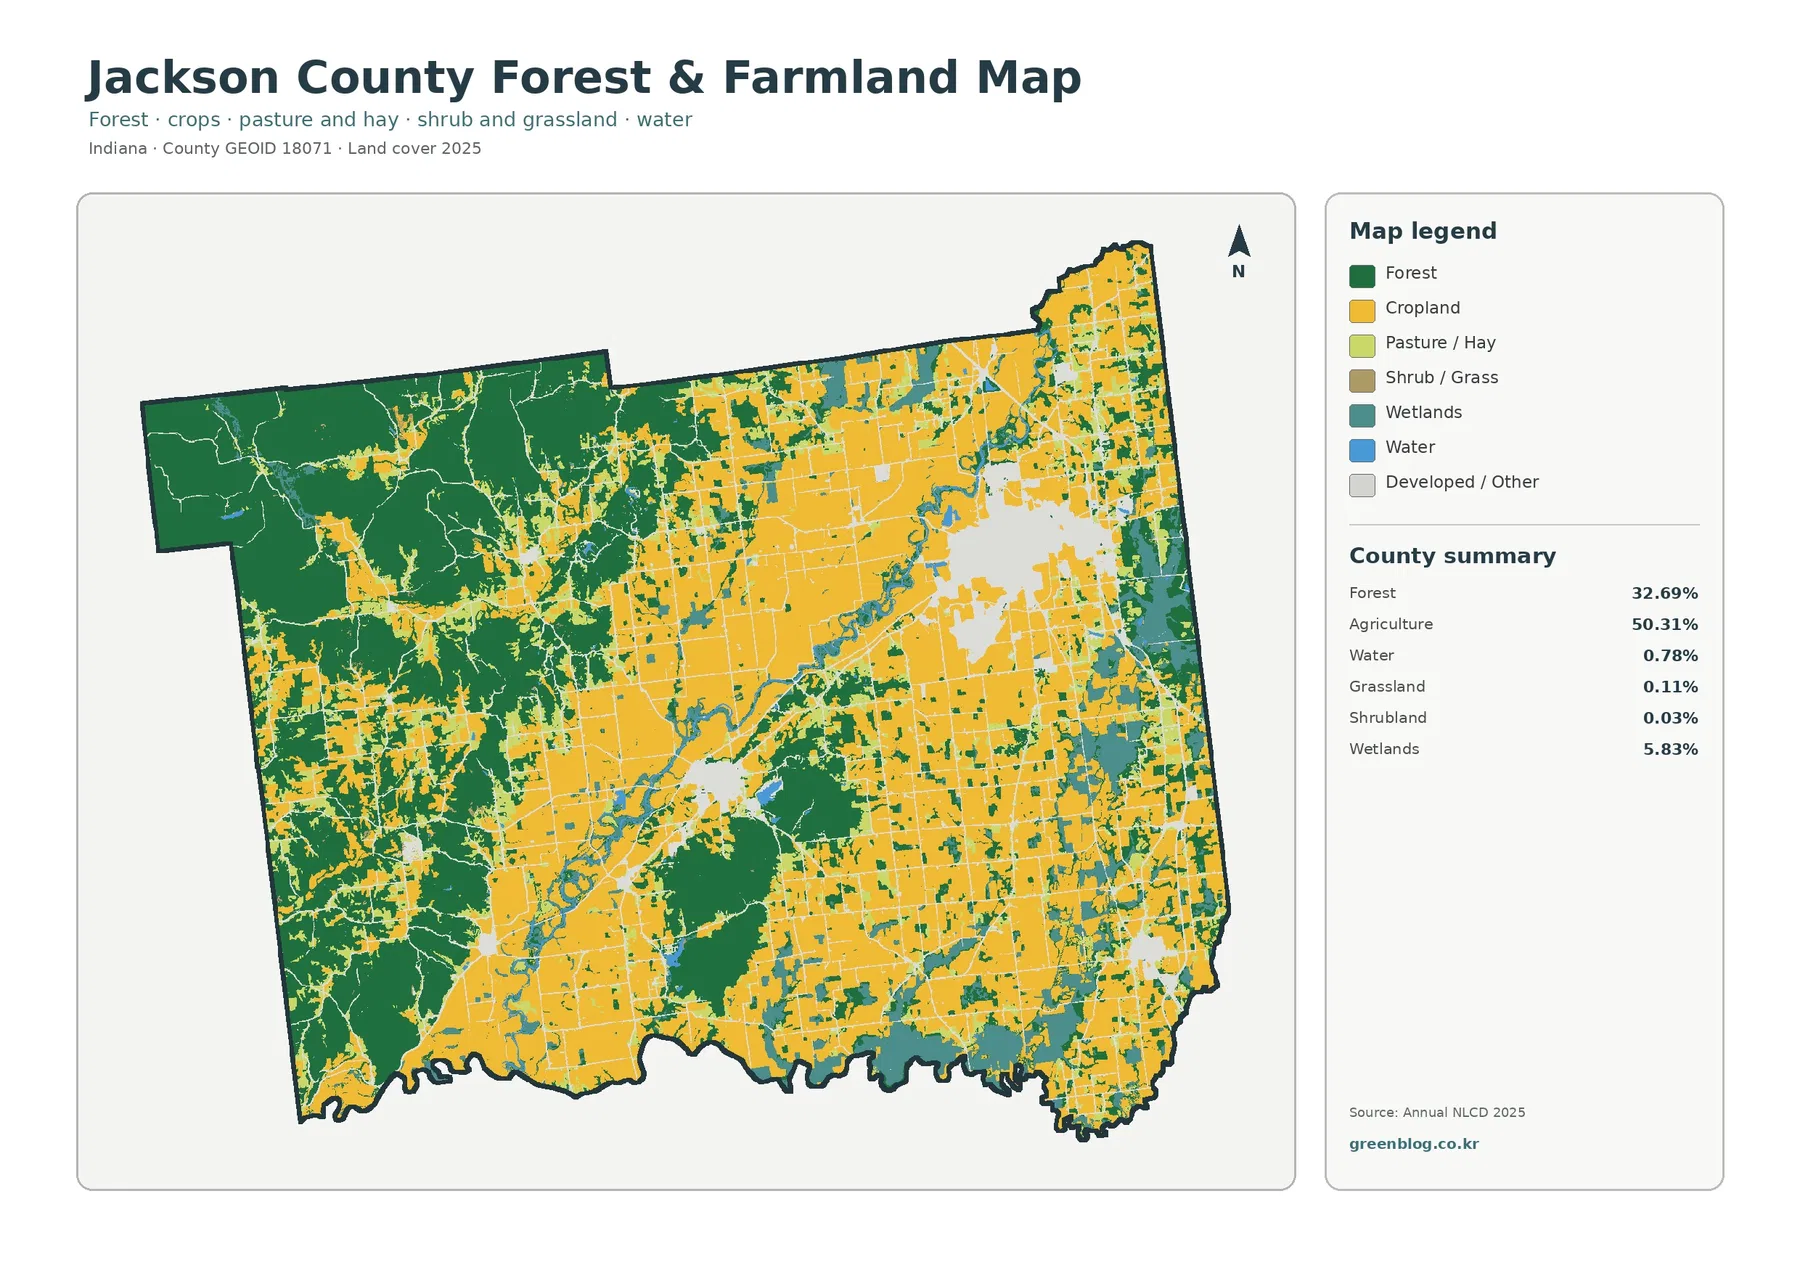
Forest represents nearly one-third of the county, yet the green areas on this map include many different situations. State forest, privately owned woods, riparian tree cover, and smaller wooded parcels can all fall into a forest class. The map does not distinguish public from private land, timber-management status, conservation restrictions, or access rights. For those questions, readers should use Indiana DNR property maps and local ownership records.
This simplified view is useful for environmental education because it shows that agriculture and forest are not evenly blended. A teacher or presenter can point to broad agricultural country in the interior, then move west to the larger woods and compare how the same county changes over a relatively short distance. Wetlands and water provide a third layer of contrast along the drainage system.
The 9.67% class difference from 1985 to 2025 includes several kinds of change, not just development
The comparison map reports a total class difference of 9.67% between 1985 and 2025. Within that summary, 1.69% is mapped as change to developed land, 0.97% as forest loss, 0.89% as agricultural loss, and 5.91% as other class difference. Wetland difference also appears as a separate legend category. The total therefore should not be described as a development rate, deforestation rate, or farmland-loss rate.
Red change-to-developed areas are most noticeable around Seymour, with smaller red patches around other settled locations. Purple “other difference” is scattered much more broadly across the county. Orange forest-loss and yellow agricultural-loss areas occur in smaller patches. The map shows where classifications differ between the two endpoints, but it does not identify a single cause for each colored cell.
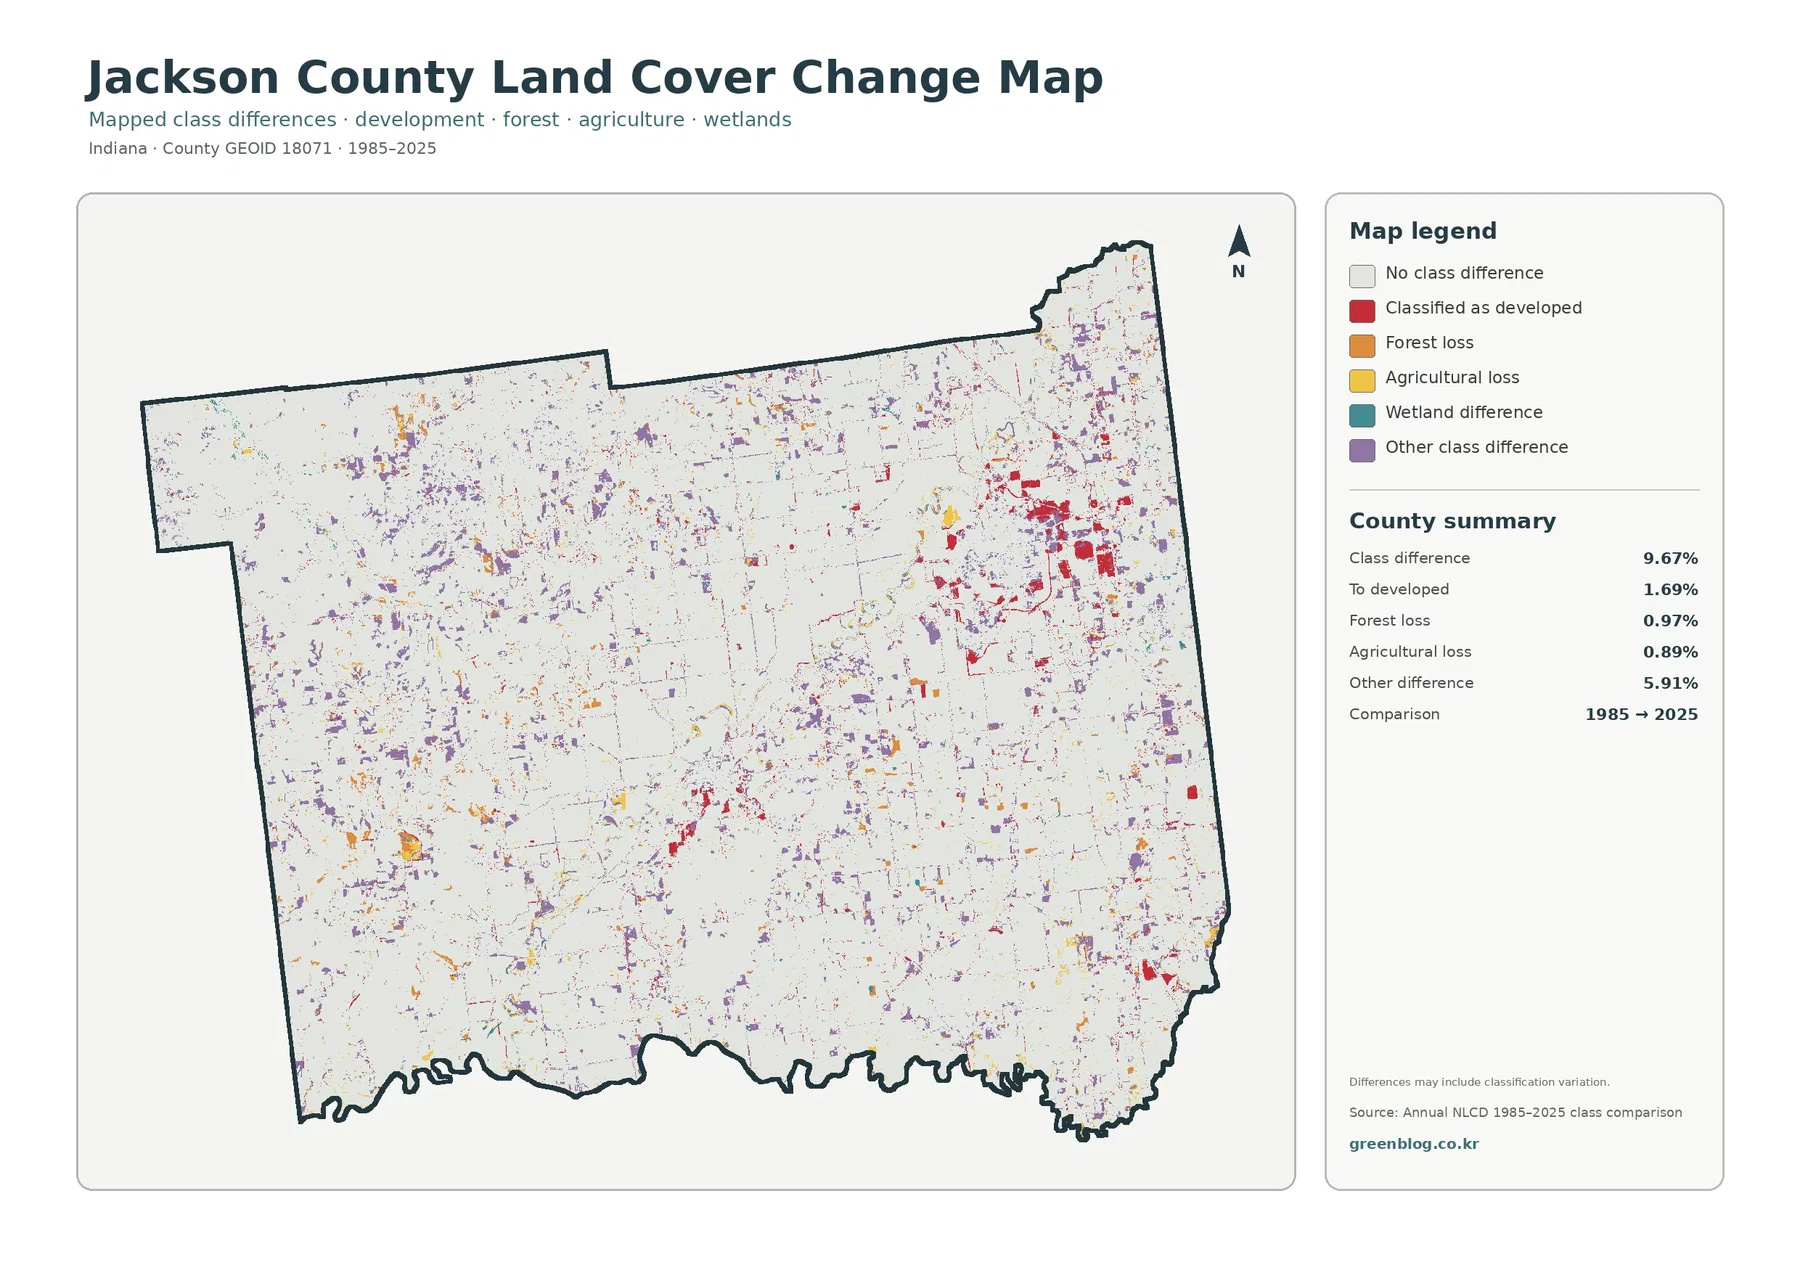
This is an endpoint comparison rather than an annual timeline. It cannot tell the exact year when a field became developed land or when a forest cell changed classification. Nor can it explain whether a difference resulted from construction, vegetation change, water conditions, or classification uncertainty. Narrow streams, forest edges, roads, and other mixed surfaces can be especially sensitive to how a raster cell is classified.
The safest way to use the change map is beside the current 2025 map. A place that is developed today will not necessarily be red on the comparison map if it was already developed in 1985. Conversely, a colored change cell in a rural area does not automatically indicate urban expansion. Keeping current condition and two-date difference separate prevents one of the most common misreadings of land-cover change products.
A simple comparison order makes the four maps easier to use together
Start with the general land-cover map and locate Seymour, Brownstown, the western forest blocks, the central farm belt, and the main wetland corridors. These features provide recognizable reference points. Once they are familiar, the forest-and-farmland view makes it easier to see how the two dominant covers meet, while the impervious map isolates the built surfaces that are less obvious in the broader classification.
For a classroom exercise, students can compare the same Seymour area on all four maps. The first view shows the developed class, the impervious map reveals where hard surfaces are concentrated, and the comparison map identifies cells that differ between 1985 and 2025. Repeating the exercise in the western forest area demonstrates that a large current forest block and a mapped forest-loss cell are not the same concept.
The JPG files are also useful in reports or slide decks when the legend remains visible. Keeping all four maps at the same scale makes it easier to compare locations without repeatedly reorienting the reader. Cropping away the legend or stretching the image can make the classifications harder to interpret, so preserving the original proportions is recommended.
For planning context, the maps can help frame questions about where development, farms, forests, and wetlands occur at county scale. They should not be used as a substitute for parcel maps, zoning maps, engineering surveys, or environmental delineations. The value of this set is broad comparison: it shows patterns that can guide a reader toward more detailed official records.
Raster classification generalizes small features, and the map date matters
Annual NLCD is a raster product, meaning the landscape is represented by a grid of cells. Each cell receives a representative class, so narrow roads, small ponds, streamside trees, and places where buildings and grass are closely mixed can be simplified. A mixed pixel contains more than one kind of surface within the area represented by a cell, which is one reason mapped edges may not match a property or field boundary exactly.
The general land-cover, forest-and-farmland, and impervious maps describe 2025 conditions, while the change map compares 1985 with 2025. Construction, tree clearing, new vegetation, water changes, or agricultural conversion after 2025 are outside this map set. Recent aerial photography and current county planning records are better sources for present-day site decisions.
Official references such as Jackson-Washington State Forest information and Indiana’s waterway roster add geographic context, but those resources serve different purposes from the land-cover maps. The state forest page describes a managed property, and the waterway roster identifies waterways; neither is replaced by an NLCD classification image. Using each source for the question it was designed to answer produces a more reliable interpretation.
Frequently Asked Questions
Does 50.31% agriculture mean farmland is evenly spread across Jackson County?
No. Agriculture is widespread through the county interior and northeast, while the western and southwestern portions are much more heavily forested. The percentage is a countywide total, so the map is needed to understand where that agricultural cover is actually concentrated.
Are the 5.83% wetlands shown here official regulatory wetland boundaries?
No. The wetland class is a remote-sensing land-cover category. It can help identify broad wetland patterns and river corridors, but regulatory boundaries, permitting status, and site-specific wetland determinations require separate official records and field work.
Is the 9.67% 1985–2025 class difference the county’s development rate?
No. The total includes several categories. The map summary lists 1.69% change to developed, 0.97% forest loss, 0.89% agricultural loss, 5.91% other difference, plus a wetland-difference category. The 9.67% figure should be read as a combined classification difference between two dates.
Map File Information
The ZIP contains four original JPG maps for Jackson County: 2025 land cover, forest and farmland, impervious surface and developed land, and the 1985–2025 land-cover class comparison.
- Printable Size: 2480 × 1754 px each
- File Type: ZIP containing four JPG images
Related Maps
- Adams County Indiana Land Cover Map
- Allen County Indiana Land Cover Map
- Bartholomew County Indiana Land Cover Map
Sources and References
- MRLC Annual NLCD Data – official source for Annual NLCD land-cover products
- USGS Annual NLCD Land Cover Classification – classification descriptions and dataset context
- U.S. Census Bureau TIGER/Line Shapefiles – official geographic boundary data used for county reference
- Indiana DNR – Jackson-Washington State Forest – official information about the state forest spanning Jackson and Washington counties
- Indiana Natural Resources Commission – Navigable Waterways by County – official county listing for the East Fork of White River and Muscatatuck River
- Indiana State Library – By County – Jackson County background and community references
Green Map creates custom-edited map images using open geographic data sources such as geoBoundaries, Natural Earth, OpenStreetMap, and government open data.
These maps are edited visual materials, not raw data files, and are provided for education, documents, presentations, and graphic reference.