Dubois County has a distinctly mixed surface pattern in the supplied 2025 data. Agriculture covers 51.10% of the county, but the yellow farm blocks are much more continuous in the west than in the wooded east. Forest accounts for 32.56%, developed land for 12.01%, and a large blue waterbody stands out along the eastern side. The result is not a uniform farm county: open working land, wooded ground, water, and several separate built clusters all occupy clearly different parts of the map.
This page pairs four views of that pattern: current land cover, forest and farmland, impervious surface, and a 1985–2025 endpoint comparison. The original map set is available as four 2480 × 1754-pixel JPG files in one download. For a county profile or classroom graphic, the current-cover image works well as the starting point; the other three are better used to answer narrower questions about vegetation, hard surfaces, or where classifications differ between the two years.
Table of Contents
A farm-dominant west gives way to a more wooded eastern half
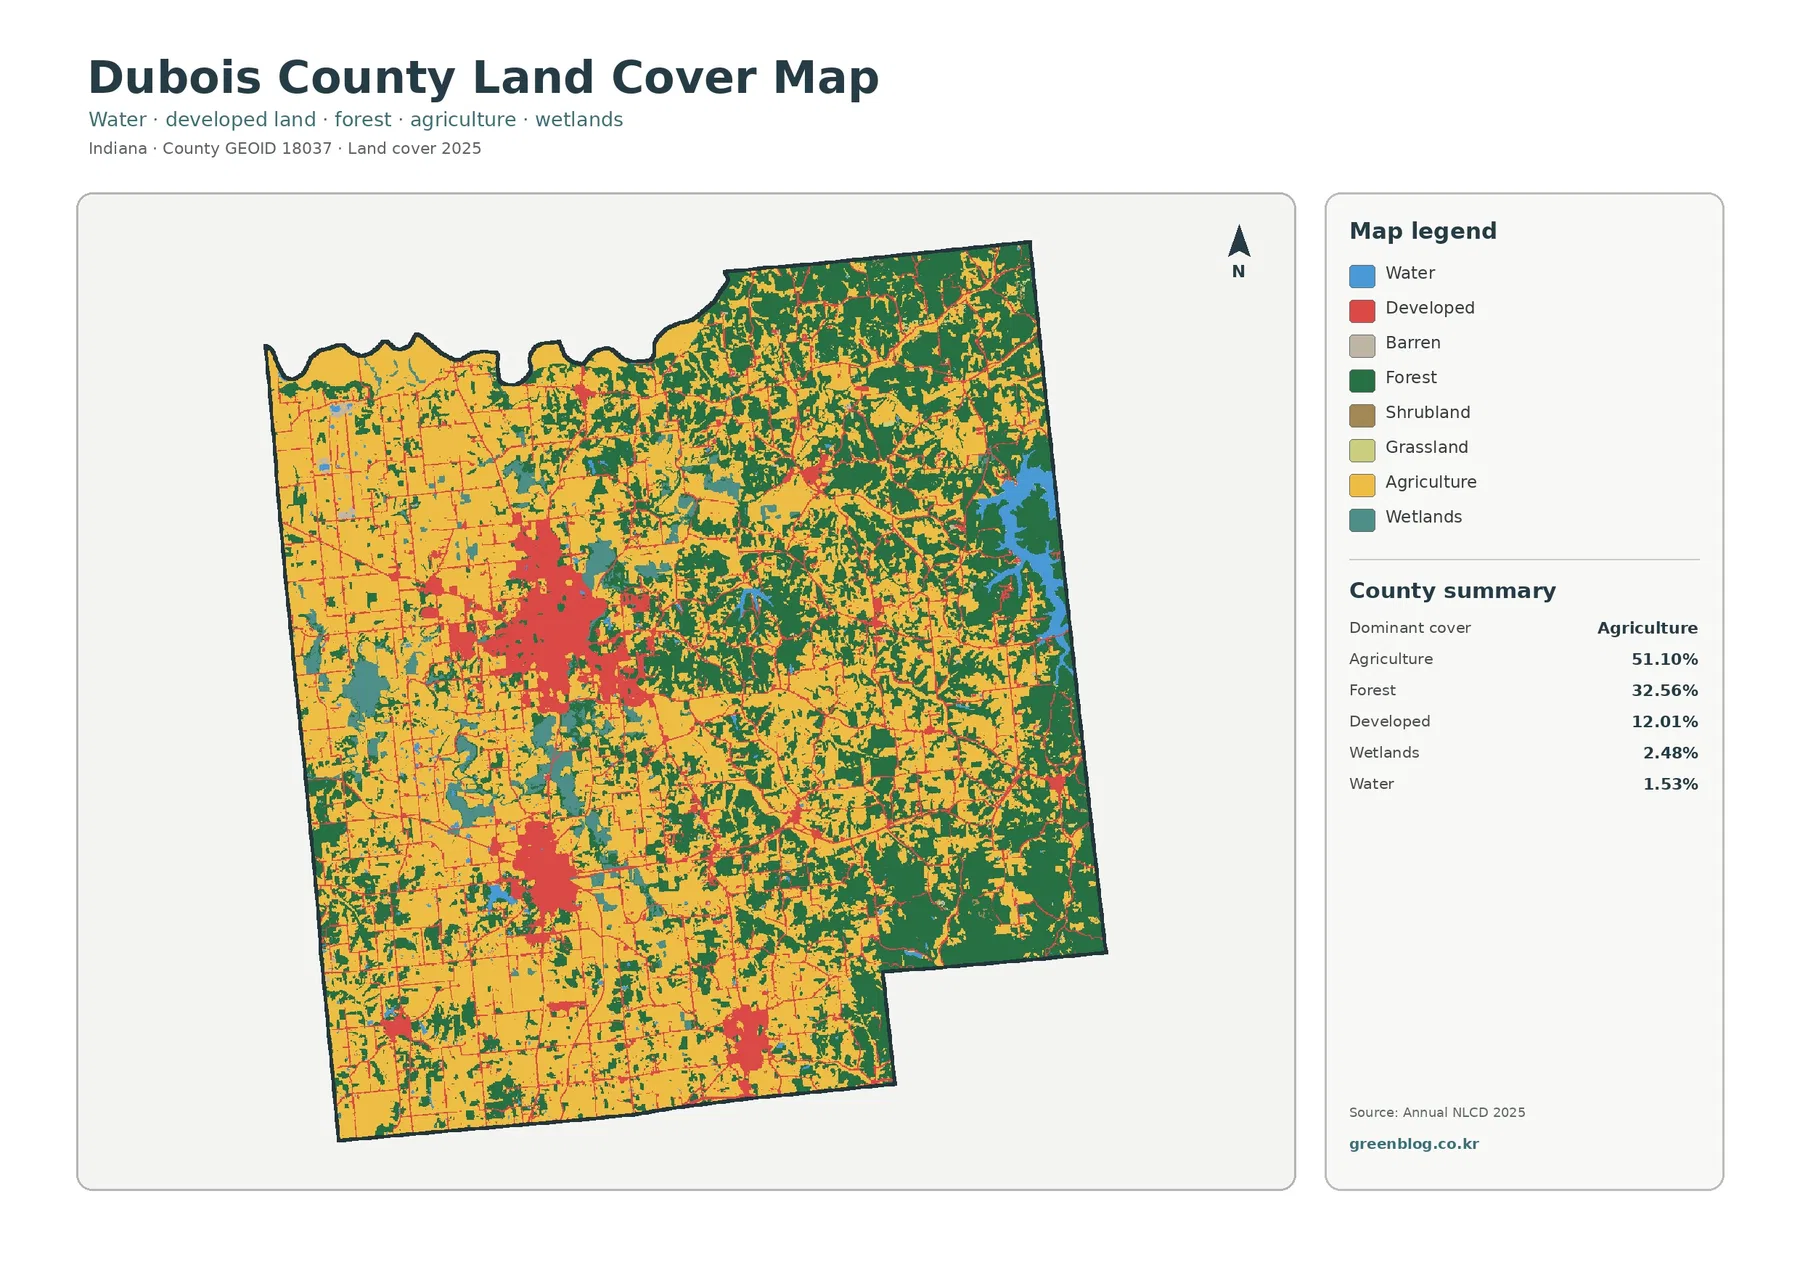
Agriculture is the largest class at 51.10%, followed by forest at 32.56% and developed land at 12.01%. Wetlands make up 2.48% and open water 1.53%. Those percentages describe countywide area, but the map makes their locations just as important. Broad farm blocks dominate much of the west and southwest. Moving east, forest breaks those blocks into smaller pieces and eventually becomes the stronger visual element across large parts of the northeastern and eastern sections.
The largest developed concentration sits west of the county center. It is wide enough to remain obvious even when viewed at the full-county scale, while a second developed cluster appears farther southwest and another smaller concentration lies near the southern edge. Thin developed traces connect many rural areas, yet the principal clusters remain separated rather than forming one continuous urban band. That separation matters when interpreting the 12.01% developed share: most of the county still consists of agricultural, wooded, wetland, or water surfaces between the built centers.
The eastern edge adds another strong contrast. A large waterbody occupies a noticeable area there, bordered by extensive forest. The supplied map does not label the waterbody, roads, towns, or municipal limits, so a name should not be assigned from the image alone. What the image does support is a clear land-cover observation: the eastern waterside landscape is more wooded and less dominated by broad farm blocks than the western half.
The vegetation view separates working fields from the wooded network
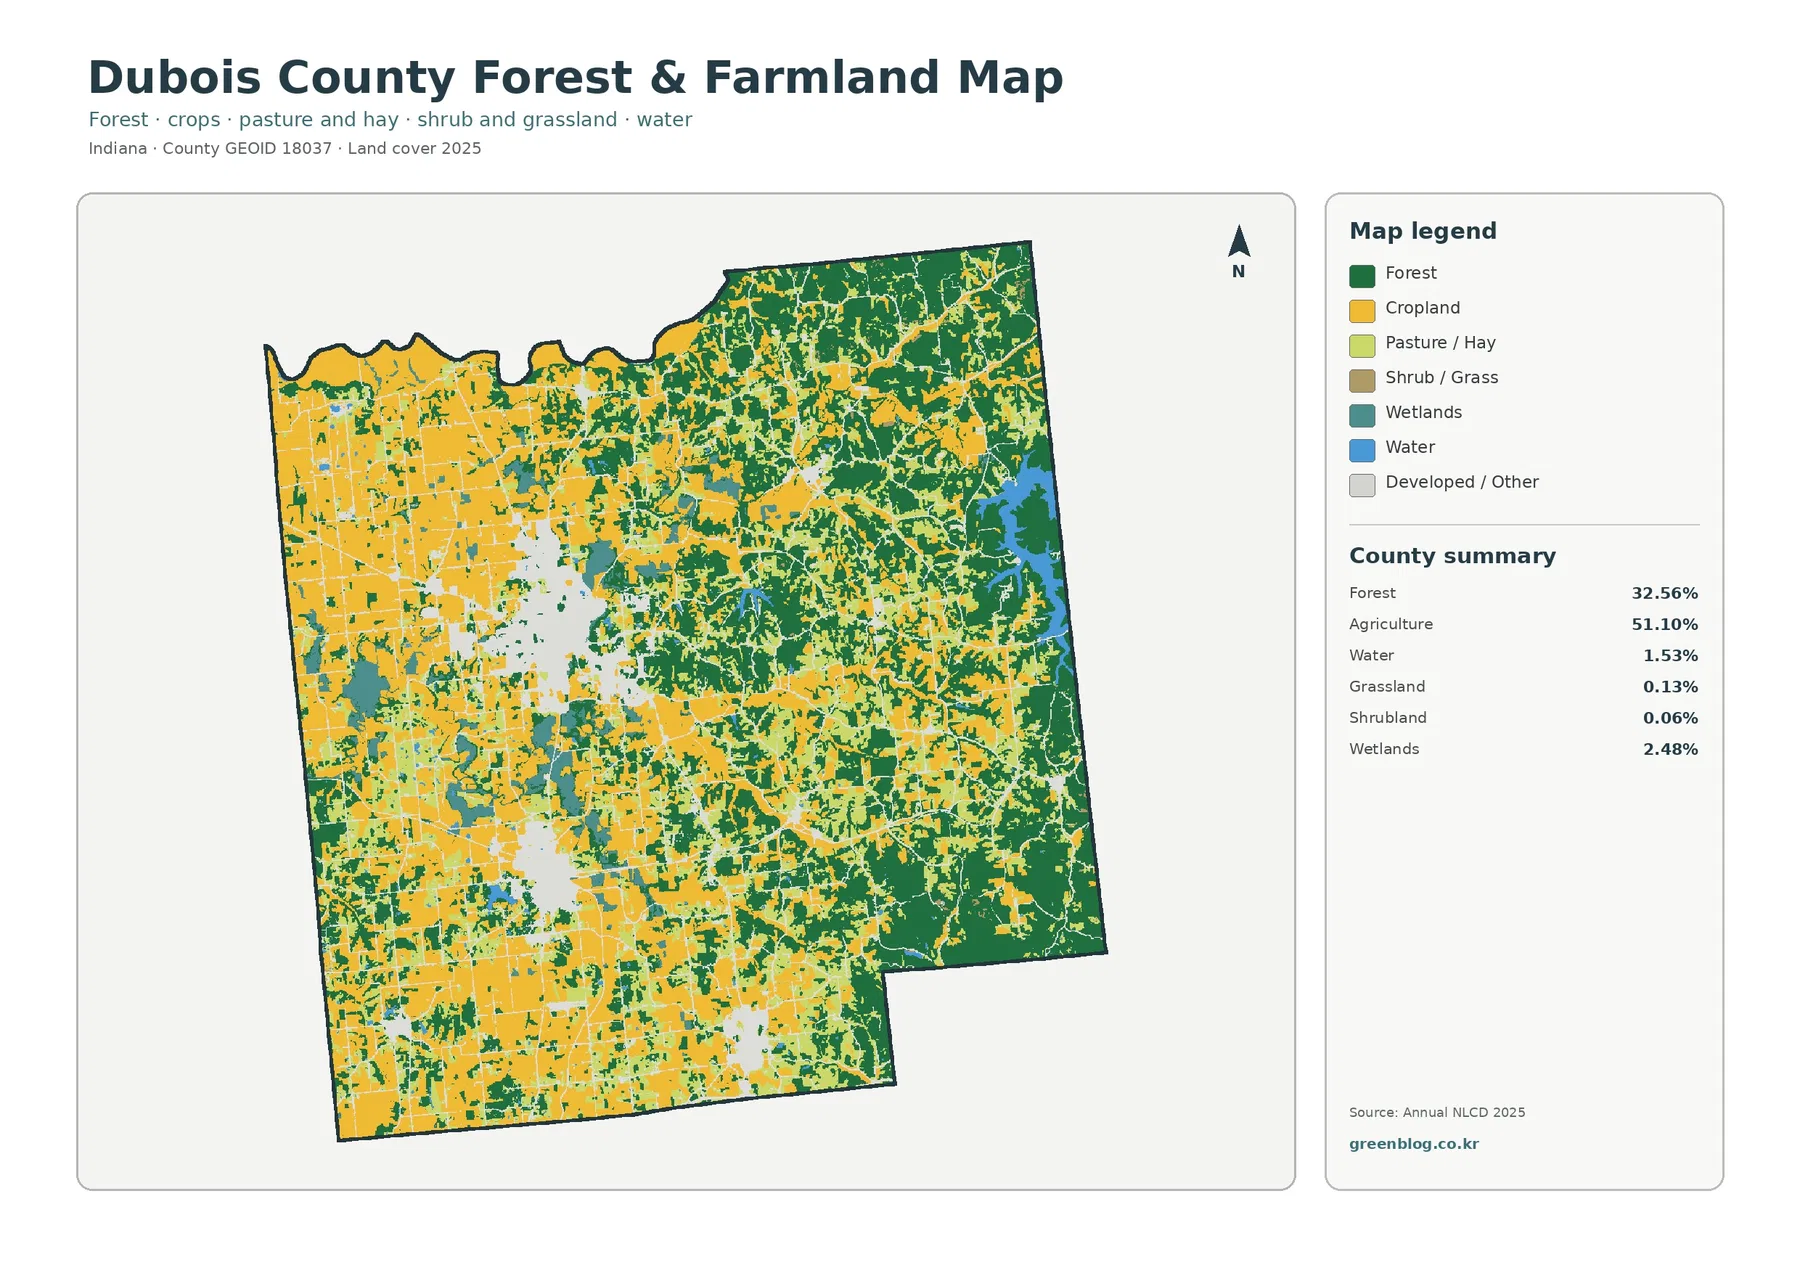
Fading developed and miscellaneous surfaces makes the agricultural-forest boundary easier to follow. Large yellow cropland areas fill much of the western side, but they are repeatedly interrupted by wooded patches and wet ground. Near the middle of the county, green forest becomes more frequent and the farm blocks lose some of their continuity. In the east, forest forms broader connected areas, while agriculture appears as smaller openings or irregular strips within a more wooded setting.
The 32.56% forest share is therefore not confined to one compact reserve-like block. Forest appears as large eastern masses, central patches, narrow links, and smaller pieces embedded within agricultural ground. This is useful when the goal is to compare broad vegetation structure rather than city development. The map also shows why a single county percentage cannot describe every local setting: two locations inside Dubois County can have very different immediate surroundings even though both contribute to the same 51.10% agriculture and 32.56% forest totals.
Wetlands account for 2.48%, while open water accounts for 1.53%. Blue water and teal wetland colors should not be treated as the same surface. Open water marks exposed water, whereas wetland classes can include vegetated or seasonally saturated ground. A place with little blue color can still contain mapped wetland, and a teal cell does not necessarily mean permanently standing water. That distinction is especially useful when comparing the large eastern waterbody with smaller wetland patches elsewhere in the county.
Grassland is only 0.13% and shrubland 0.06% in the supplied summary. They appear as minor pieces rather than county-defining classes. Those small values are still part of the map, but they should not be inflated into a major landscape story simply because the legend includes them. The more defensible countywide description remains a farm-and-forest landscape with several developed centers, limited wetland, and one conspicuous eastern water feature.
Hard surfaces concentrate in three main built areas
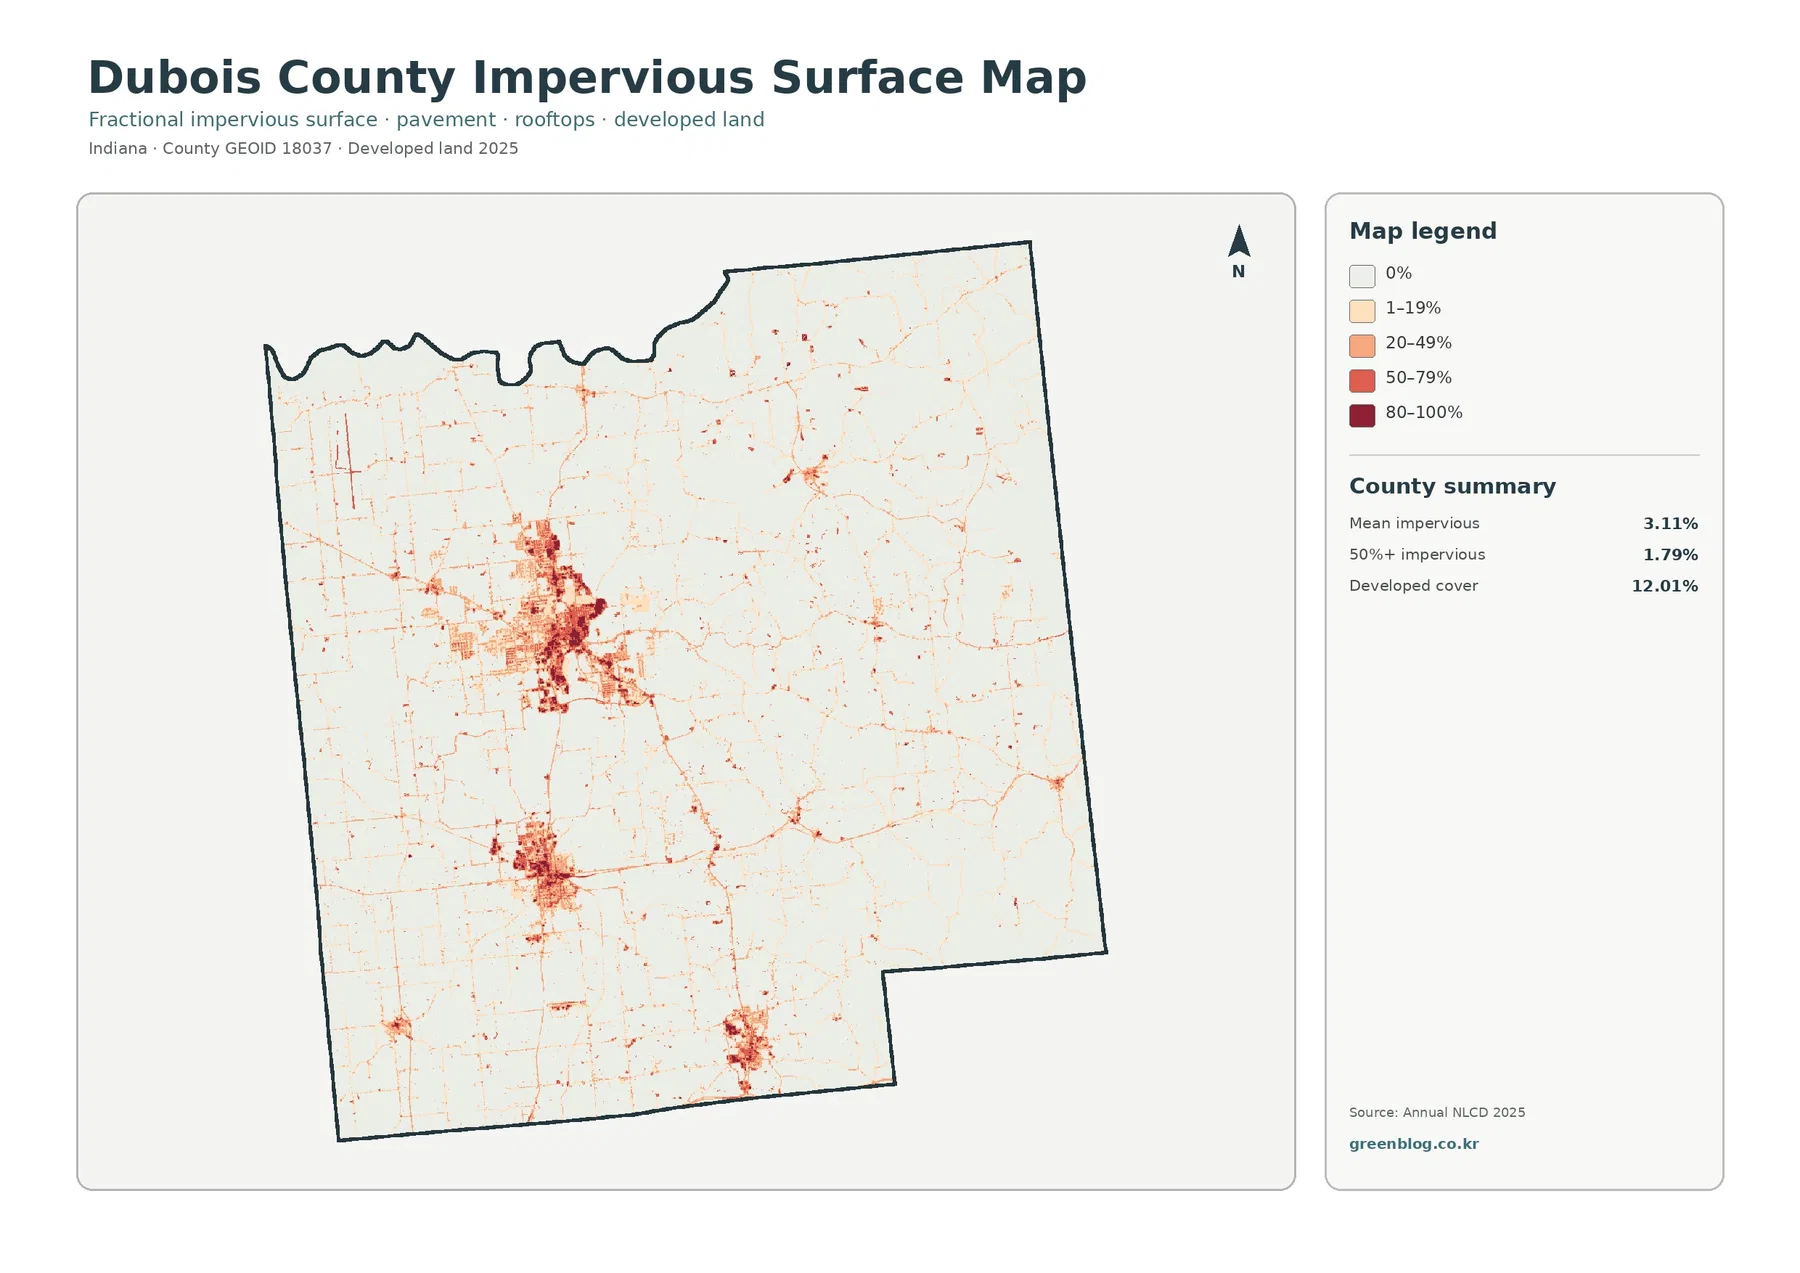
Mean impervious cover is 3.11%, and 1.79% of the county is mapped at 50% impervious or greater. Both values are well below the 12.01% developed share. That difference is expected because a developed land-cover class can contain lawns, trees, soil, and other permeable surfaces around buildings and roads. The impervious layer isolates the harder portion of that developed landscape, making it more useful when the question concerns pavement and rooftops rather than the full developed category.
The darkest tones cluster west of center, where the current land-cover map also shows the county’s largest built concentration. A second group appears to the southwest, and another smaller but distinct concentration lies near the southern boundary. Fine lines extend outward from these centers and cross rural areas, but the preview contains no route names or traffic information. They can be described as linear hard-surface traces, not identified as particular highways or assigned a transportation role without another source.
The countywide mean of 3.11% blends those dense centers with large farm and forest areas that are close to zero. For that reason, location is more informative than the average alone. A presentation about development intensity can show the 2025 land-cover image first and then use the impervious map to distinguish broad developed classes from the places where hard surfaces are most concentrated. The two maps answer related but different questions and should not be treated as interchangeable.
Impervious cover can also be a useful screening layer when discussing runoff, but it is not a flood-risk map. Rainfall, soil, slope, drainage infrastructure, streams, wetlands, and water levels all influence how water moves. A dark impervious patch indicates a high share of hard surface, not a measured flood probability. Site-level drainage or hazard decisions require current engineering, hydrologic, and local records beyond this countywide graphic.
The eastern waterbody is small in percentage but large in visual importance
Open water covers only 1.53% of Dubois County in the supplied summary, yet the eastern waterbody is one of the easiest features to locate on the page. This is a useful reminder that percentage and geographic importance are not the same thing. A class can occupy a small countywide share while still shaping one part of the map strongly because it is concentrated in a single large feature rather than scattered across many tiny cells.
The waterbody also helps orient the forest pattern. Dense green cover surrounds much of its visible edge, and the eastern side as a whole contains more connected forest than the broad western farm areas. A county profile can use that contrast to explain why Dubois County does not look like a simple agricultural grid despite agriculture being the dominant class. The map presents a transition from larger western fields toward a more wooded, water-influenced eastern landscape.
The land-cover image is not a shoreline survey. Thirty-meter cells generalize narrow coves, small channels, roads, tree lines, and mixed edges. The map also does not provide water depth, water quality, flood limits, ownership, or regulatory boundaries. Those questions need current hydrography, parcel records, local regulations, and higher-resolution imagery. The safest use here is county-scale orientation and comparison of surrounding surface classes.
A 13.07% endpoint difference is mostly not the red developed category
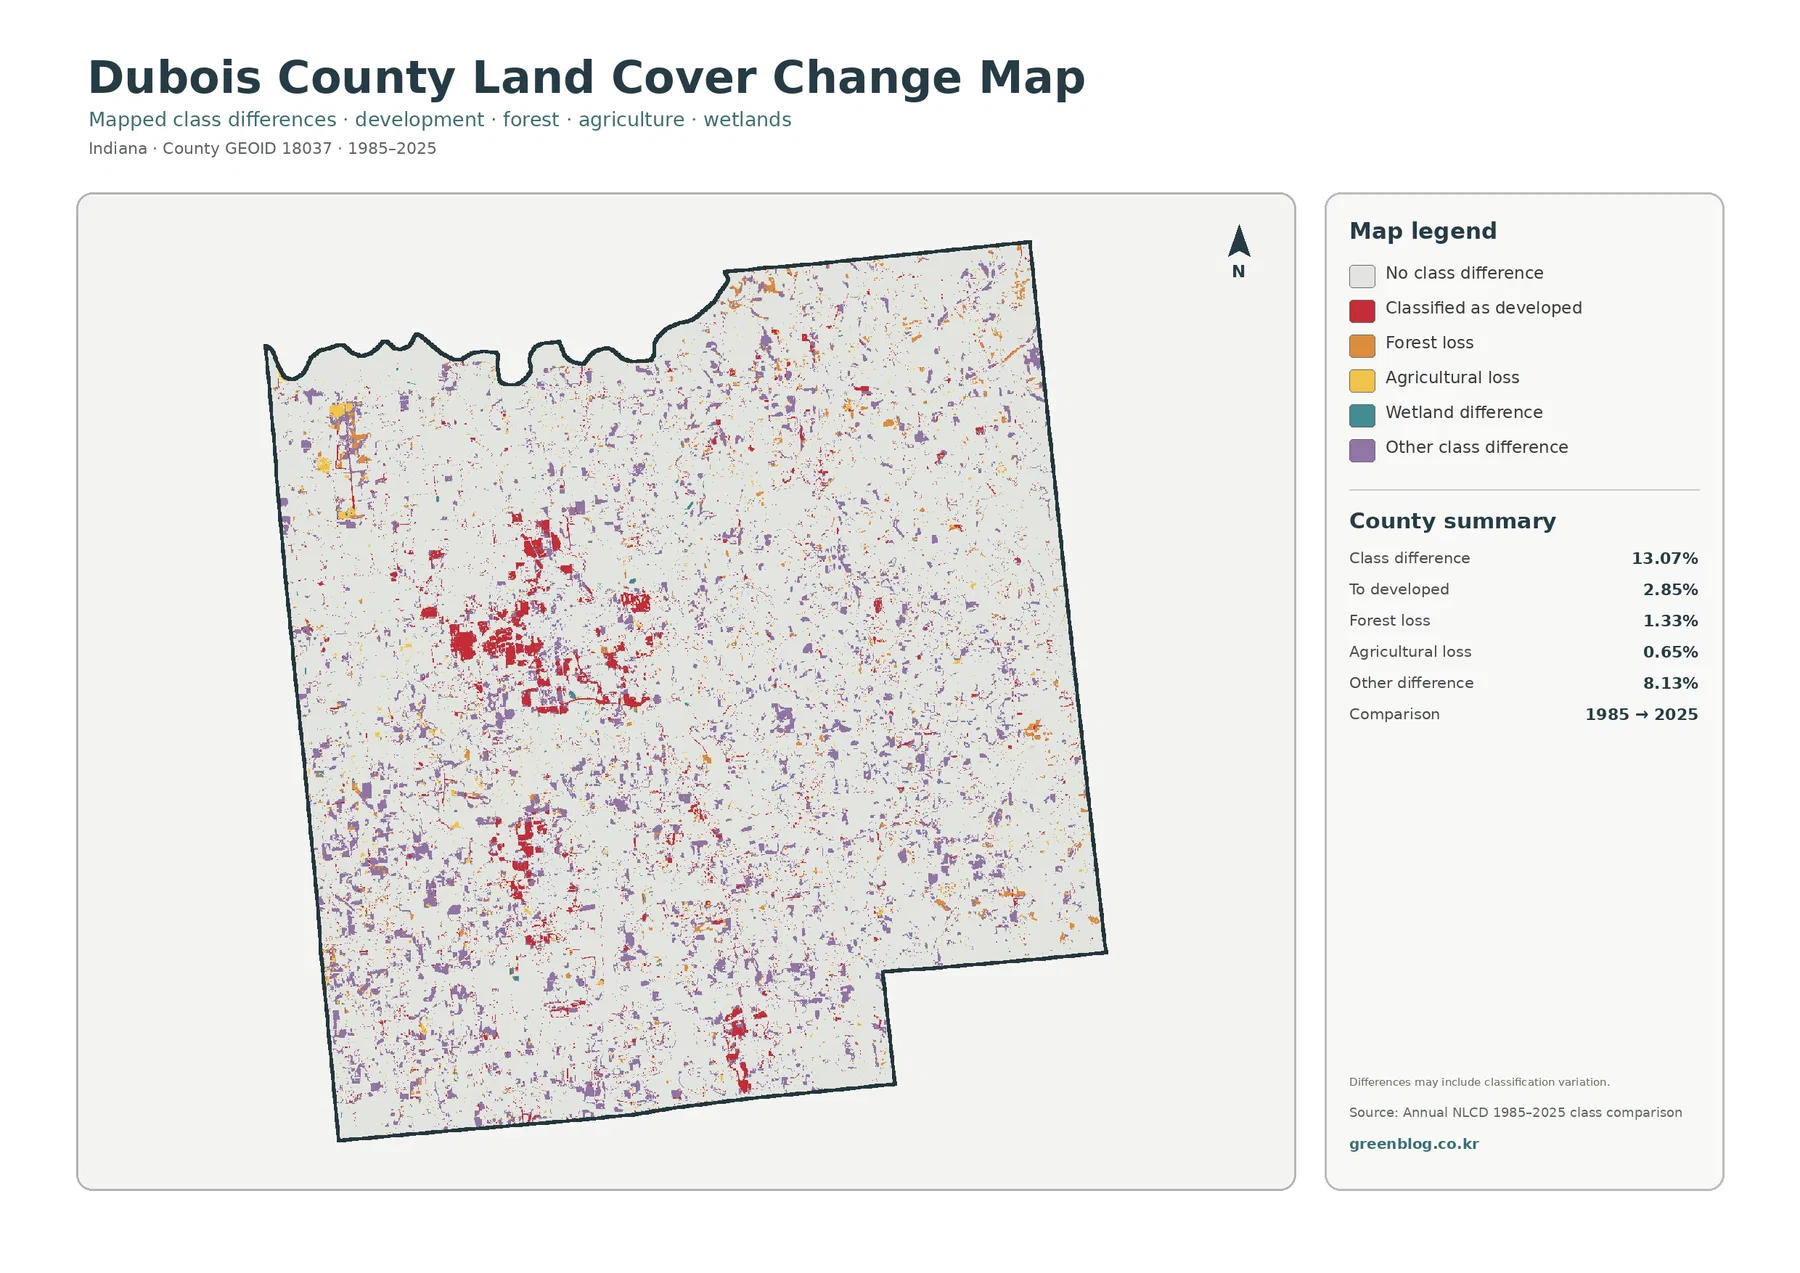
The total mapped class difference between 1985 and 2025 is 13.07%. The supplied components list 2.85% classified as developed, 1.33% forest loss, 0.65% agricultural loss, and 8.13% other difference. The largest reported component is therefore the catch-all other-difference category, not developed conversion. Treating the full 13.07% as urban growth would substantially misstate what the map says.
Red developed-conversion cells are most noticeable around the large west-central built cluster and appear again near the southwestern and southern concentrations. Purple other-difference cells are much more widely scattered across farm and forest areas. Orange forest-loss and yellow agricultural-loss cells occur in smaller shares and are dispersed rather than defining one single countywide hotspot. The spatial distribution is as important as the summary percentages because each category occupies a different set of places.
“Forest loss” or “agricultural loss” means that a cell assigned to that class in 1985 received a different class in 2025. It does not identify the cause. Logging, construction, field rotation, vegetation recovery, weather, mixed pixels, and classification variation cannot be separated from this endpoint graphic alone. Likewise, a red cell does not provide the construction year or project name. Intermediate imagery and local records are needed to establish timing and explanation.
The comparison also does not record every event that happened during the forty-year span. A cell could change during an intermediate year and return to its original class by 2025, leaving no endpoint difference. Small boundary cells may also switch classifications because the mix of surfaces inside a 30-meter cell changes slightly. The map is best used to locate areas worth examining more closely rather than as a complete history of land-use events.
Three broad landscape zones make the four maps easier to compare
Viewed together, the maps suggest three broad county-scale zones. The west and southwest are dominated by agriculture and contain the strongest built centers. The east and northeast are more heavily wooded and include the large waterbody. The middle forms a transition where farm blocks, forest, wetlands, and developed traces repeatedly meet. These zones are descriptive groupings based on the visible 2025 surface pattern; they are not zoning districts, ownership units, or official planning areas.
This three-part view prevents one countywide statistic from becoming the whole story. Agriculture is the majority class, but it is not equally continuous everywhere. Forest occupies nearly one-third of the county and becomes locally dominant in many eastern areas. Developed cover is much smaller overall, yet its concentrated clusters are visually strong. Water is smaller still, but its eastern concentration makes it a major orientation feature. Each percentage needs its spatial pattern to be useful.
For a report figure, pairing maps can make those relationships clear without overwhelming the reader. Current land cover plus forest-and-farmland works well for the west-to-east agricultural and wooded transition. Current land cover plus impervious surface explains why a 12.01% developed share contains a much smaller 3.11% mean hard-surface value. Current land cover plus endpoint difference is the strongest pair for discussing where the 1985 and 2025 classifications diverge.
Land cover is not zoning, ownership, or a parcel survey
Land cover classifies what the ground surface appears to be from mapped imagery. It does not tell a reader who owns the land, what a parcel is legally zoned for, whether development is permitted, or where a farm or property boundary lies. Developed cells can contain lawns and trees. Agricultural cells do not identify the crop, farm operator, or legal land use. Wetland color is not the same as a regulatory wetland determination.
Annual NLCD uses 30-meter square cells, so one cell may contain a road, a building, trees, grass, and part of a field while receiving one predominant class. Zooming in enlarges the cell but does not add parcel-scale detail that was absent from the source. Narrow tree lines, small ponds, ditches, driveways, and irregular edges may be generalized or absorbed into a neighboring dominant class.
The current maps represent the supplied 2025 observation year. Construction, harvest, forest activity, vegetation recovery, or changing water conditions after that date may not appear. Anyone working on a current site decision should use newer aerial imagery, official local records, and field information where appropriate. These graphics are countywide reference maps, not substitutes for survey, engineering, permit, parcel, flood-insurance, or wetland-jurisdiction products.
Choosing the right map for a profile, lesson, or comparison
Start with the 2025 overview when the goal is to introduce Dubois County. It shows the 51.10% agricultural share, 32.56% forest share, major developed clusters, wetlands, and the eastern waterbody in one image. Move to the vegetation-focused map when the question is how fields and forest meet. Use the impervious view when the emphasis is rooftops and pavement rather than the full developed category.
Place the 1985–2025 comparison after the current-cover map. Its red, orange, yellow, teal, and purple colors represent endpoint differences, not current land-cover classes. Showing it second or later gives the reader a known 2025 reference before asking them to interpret change. It also makes the 13.07% total easier to explain because the viewer can compare red developed-conversion cells with the actual current developed clusters.
Each JPG measures 2480 × 1754 pixels. That is useful for screen presentations, document illustrations, and many ordinary print applications, but the package does not mark the files as meeting an A3 high-resolution reference. Test large-format output before relying on it for a poster. The four images are reference graphics and should be labeled as such when used in a report or classroom handout.
What is included in the four-map JPG set
The ZIP contains one JPG for 2025 land cover, one for forest and farmland, one for impervious surface and developed land, and one for the 1985–2025 land-cover comparison. Begin with the countywide view and add the map that directly answers the second question. Keeping current cover, hard surface, and endpoint difference separate prevents similar-looking colors from being interpreted as the same type of information.
Frequently Asked Questions
Is Dubois County mainly farmland or forest?
Agriculture is the largest 2025 class at 51.10%, while forest covers 32.56%. The west and southwest are more strongly agricultural, but forest becomes much more continuous in the east and northeast. The eastern waterbody also sits within a noticeably wooded part of the county, so the local pattern changes substantially from one side to the other.
Why is developed cover 12.01% when mean impervious cover is only 3.11%?
Developed land-cover classes can include lawns, trees, bare soil, and other permeable surfaces around buildings and roads. Impervious cover isolates roofs, pavement, parking areas, and similar hard surfaces. The two measures describe related but different parts of the built environment, so the countywide impervious mean is lower.
Does the 13.07% 1985–2025 class difference mean 13.07% of the county was newly developed?
No. The supplied summary lists 2.85% classified as developed, 1.33% forest loss, 0.65% agricultural loss, and 8.13% other difference. The 13.07% total covers all mapped endpoint differences, not just development. It also does not identify exact dates or causes without intermediate imagery and local records.
Sources and Reference Data
- MRLC Annual NLCD Data – official access point for annual land-cover and comparison products
- USGS Annual NLCD Land Cover Classification – class definitions and guidance for agriculture, forest, developed land, wetlands, water, and related categories
- U.S. Census Bureau TIGER/Line Shapefiles – official geographic reference for the Dubois County boundary
Map File Information
The ZIP contains four original JPG maps for comparing Dubois County's farm and forest pattern, eastern waterbody, separate developed clusters, impervious surfaces, and 1985–2025 class differences.
- Included Files: Use only the versions confirmed in the article and supplied images
- File Type: Use the confirmed download contents
- Intended Use: Printing, education, presentations, and map-based projects
Related Maps
- Adams County Indiana Land Cover Map
- Allen County Indiana Land Cover Map
- Bartholomew County Indiana Land Cover Map
Green Map creates custom-edited map images using open geographic data sources such as geoBoundaries, Natural Earth, OpenStreetMap, and government open data.
These maps are edited visual materials, not raw data files, and are provided for education, documents, presentations, and graphic reference.