Will County has an unusually strong split between two major land-cover types. In the 2025 summary, agriculture accounts for 46.69% of the county and developed land for 38.71%. The maps show why those percentages need a geographic view: broad developed areas dominate much of the northwest and west, while large agricultural blocks extend across the south and the long eastern section. Forest, wetlands, and water occupy smaller shares but form visible ribbons and pockets between the two dominant patterns.
This page compares four views built on the same County GEOID 17197 boundary: general land cover, forest and farmland, impervious surface and developed land, and mapped class differences from 1985 to 2025. The WebP images are intended for quick viewing in the article, while the four original JPG maps are available together in one ZIP below. Each view answers a different question, so reading them side by side is more useful than treating any single map as a complete description of the county.
Table of Contents
A broad developed northwest gives way to a much more agricultural south and east
The general land-cover map has a clear visual divide. Across the upper and western parts of the county, red developed land forms large connected areas with smaller pieces of agriculture, forest, wetlands, and water inside them. Farther south, yellow agriculture becomes much more continuous. The long eastern portion is also predominantly agricultural, interrupted by small developed clusters, narrow linear features, wooded patches, and wet areas. The result is a county where average percentages hide a pronounced internal contrast.
Agriculture is the largest category at 46.69%, but developed land is close behind at 38.71%. Forest covers 5.38%, wetlands 4.44%, and water 2.24%. Grassland contributes 1.25% and shrubland 0.57%. Those smaller classes matter because they are not scattered evenly. They tend to appear as narrower bands, irregular patches, and edges within or beside the larger agricultural and developed zones, giving parts of the map a much more mixed appearance than the countywide totals suggest.
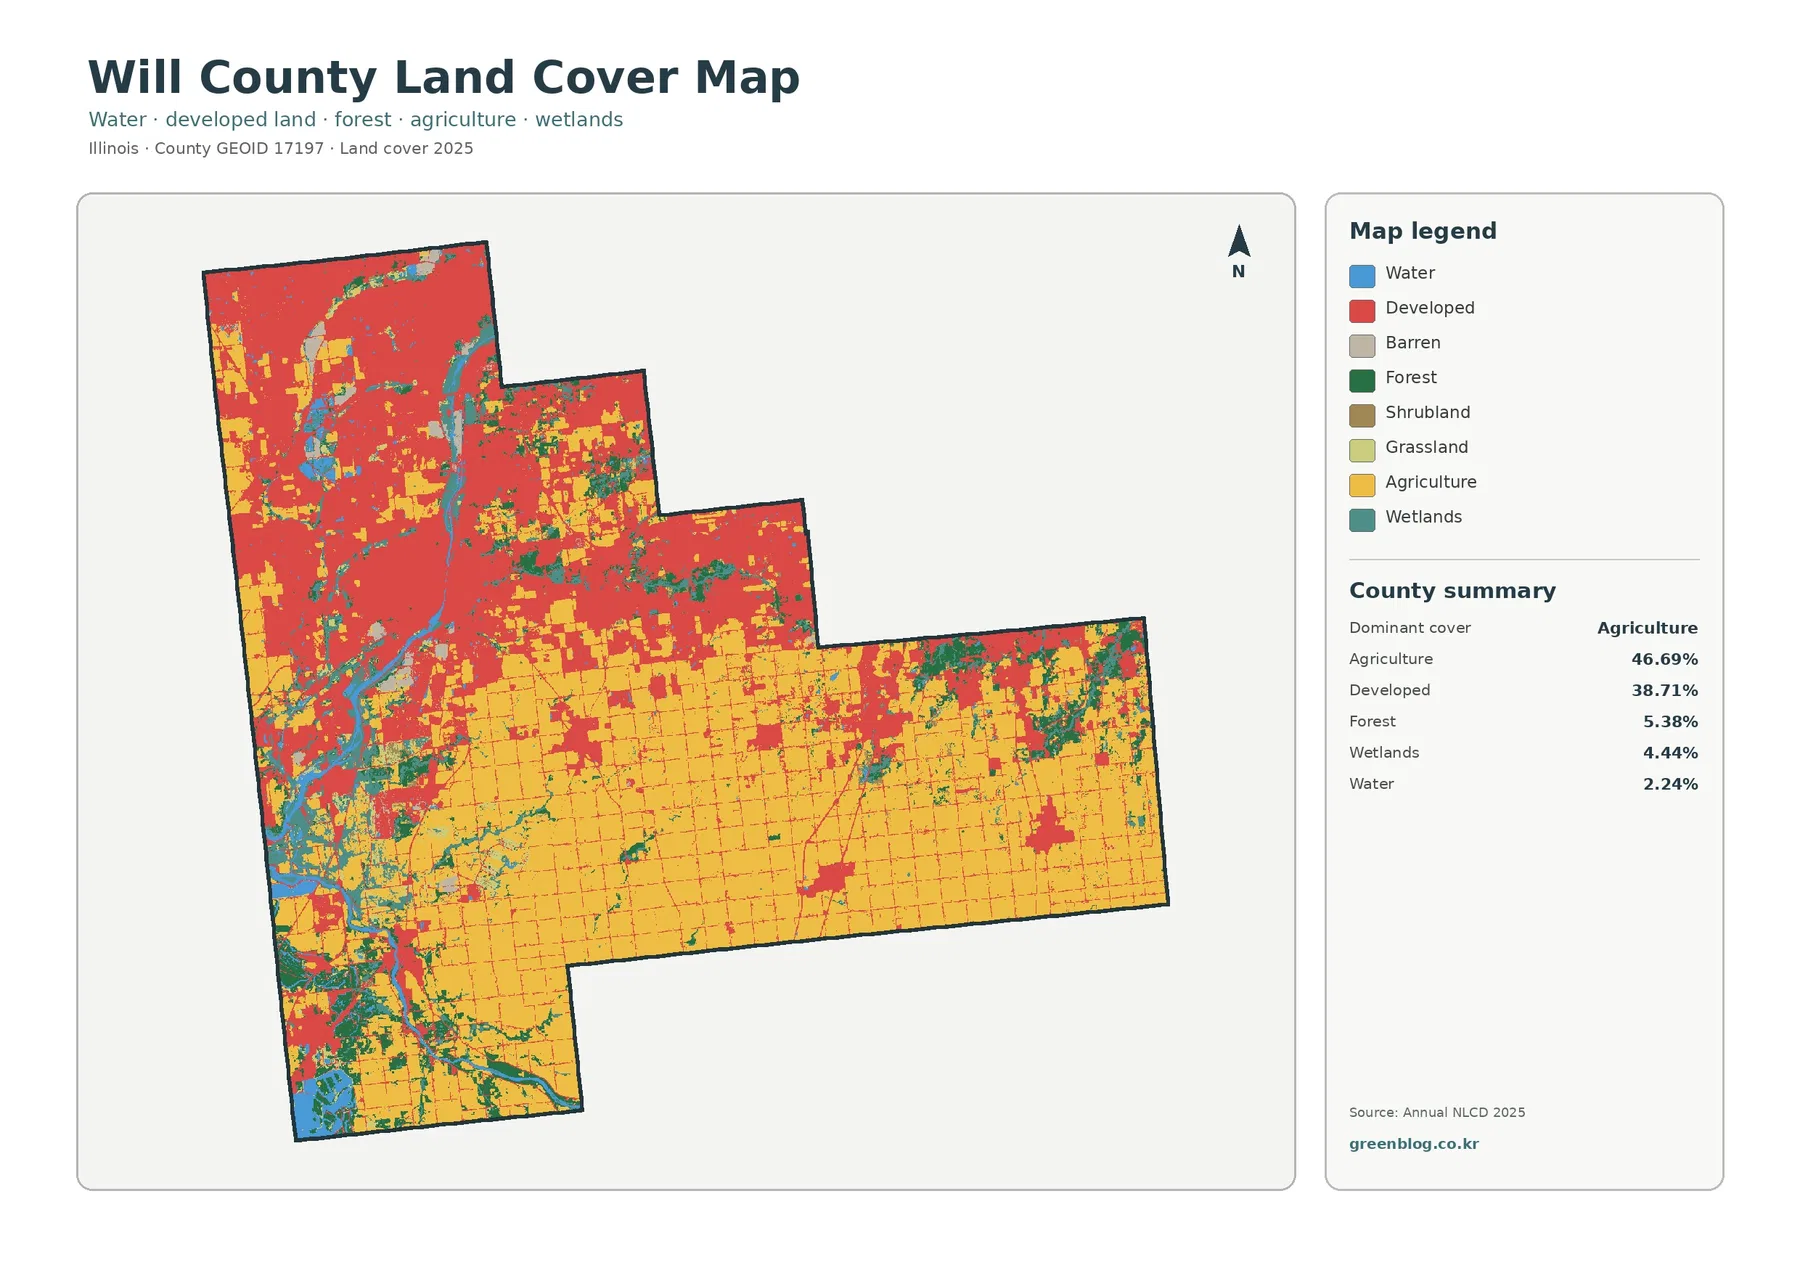
The developed class should not be read as a map of pavement alone. NLCD developed categories can include lawns, trees, bare soil, and other pervious surfaces mixed among buildings and roads. That distinction is important in Will County because the developed share is very large. The general map is best for locating the broad footprint of developed land, while the impervious-surface map later in the article shows where hard surfaces such as pavement and rooftops are actually concentrated.
Farmland forms the largest continuous surfaces in the southern and eastern parts of the county
Removing much of the developed-color detail makes the agricultural pattern easier to see. On the forest-and-farmland map, the south-central area and the long eastern extension contain broad yellow fields with relatively few large breaks. In the north, farmland is far more fragmented. Agricultural patches sit among extensive gray developed or other land, green woodland, teal wetlands, and blue water. This difference explains why a single countywide agriculture percentage cannot describe the whole landscape.
Forest accounts for 5.38% of the county. Rather than forming one dominant wooded block, it appears in repeated narrow belts and irregular patches. Some of the greener concentrations occur along wet or watery corridors, while other patches sit within developed or agricultural surroundings. Wetlands, at 4.44%, also appear repeatedly in the mixed northwestern and western areas and in narrower strips farther south. Together, these classes break up the otherwise broad agricultural surfaces and add a visible network of natural cover.
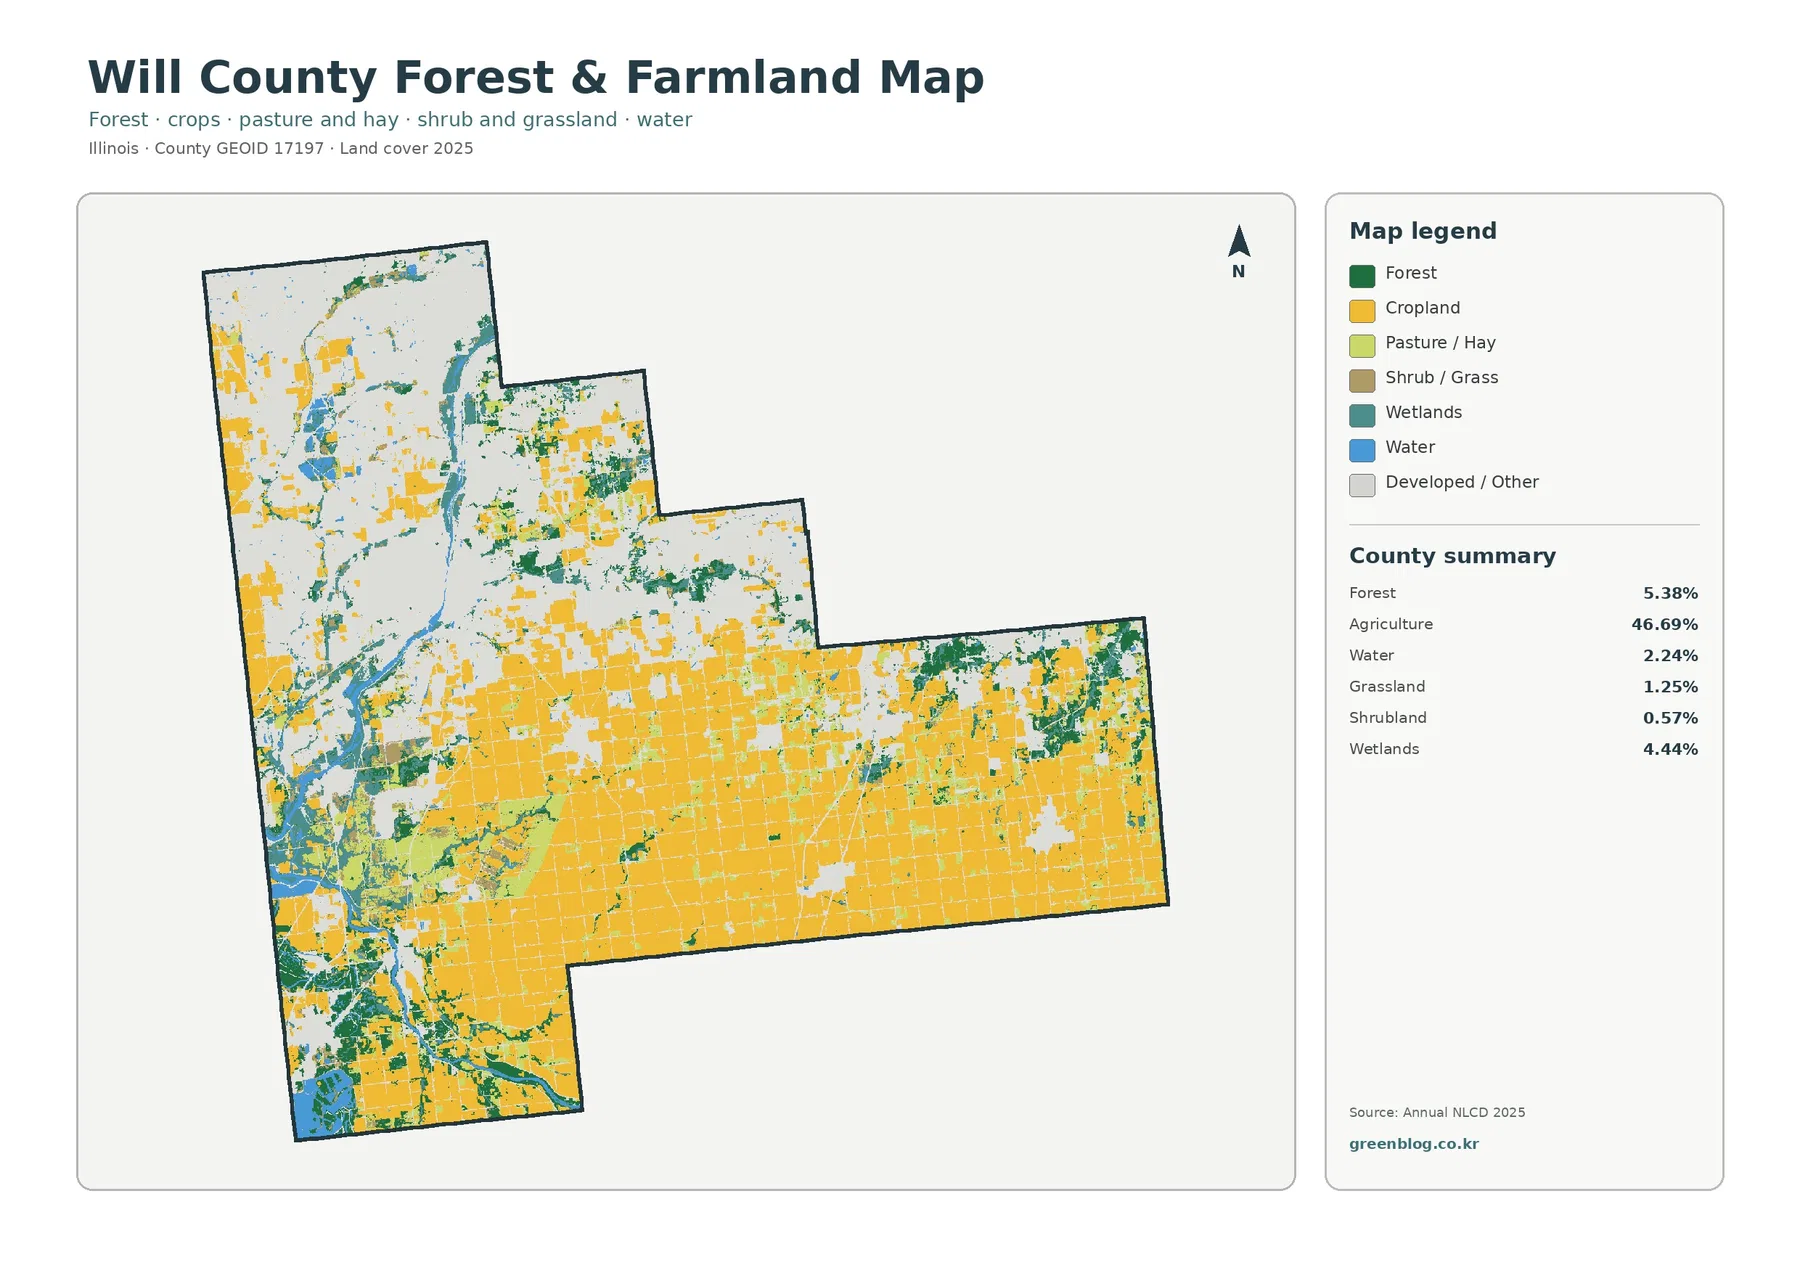
This view is useful when the main question is where farmland remains broad and where it is interrupted by other cover. The gray developed/other category simplifies the urbanized northwest, allowing agricultural, forest, wetland, and water patterns to stand out more clearly. It is still a land-cover classification, not a property or legal land-use map. Yellow areas should not be treated as tax parcels or protected farmland boundaries, and green areas should not be assumed to represent a particular ownership or forest-management status.
Water and wetlands create narrow breaks inside both the urbanized and agricultural portions
Water represents 2.24% of the mapped area and wetlands 4.44%. Their combined visual effect is larger than those percentages may imply because they are concentrated in distinct corridors and pockets. The northwest and west contain several noticeable blue and teal areas within the developed landscape. Other narrow wet features extend through central and southern portions of the county, and smaller wetland patches interrupt the eastern farm country. These features help explain why the map is not simply divided into red urban land and yellow agriculture.
Open water and wetlands are separate classes. Blue cells represent open-water cover, while teal wetland cells represent areas classified as wetland vegetation or wet ground. Their boundaries should be read at county scale rather than as surveyed lines. Annual NLCD uses a raster grid of roughly 30 meters, so a single cell may contain a narrow stream, trees, cropland, a road edge, or shallow water at the same time. Small channels and wetland margins can therefore look more generalized than they would on a parcel or engineering map.
The maps support a simple location-based observation: wet cover appears in both highly developed and strongly agricultural parts of Will County. They do not establish why development or farmland is located beside a particular water feature, and they do not identify legal wetland boundaries. For general reference, however, the blue and teal patterns are useful for separating broad dry agricultural surfaces from wetter corridors and for seeing where natural cover remains interwoven with the developed northwest.
Mean impervious cover reaches 16.50%, but the highest values are concentrated rather than countywide
Impervious surface means hard cover such as pavement, parking areas, and rooftops where water does not easily soak into the ground. Will County has a mean impervious value of 16.50%, and 15.32% of the county is mapped at 50% impervious or greater. Those figures are substantially lower than the 38.71% developed-land share because a developed land-cover class can contain lawns, trees, and other surfaces that remain permeable.
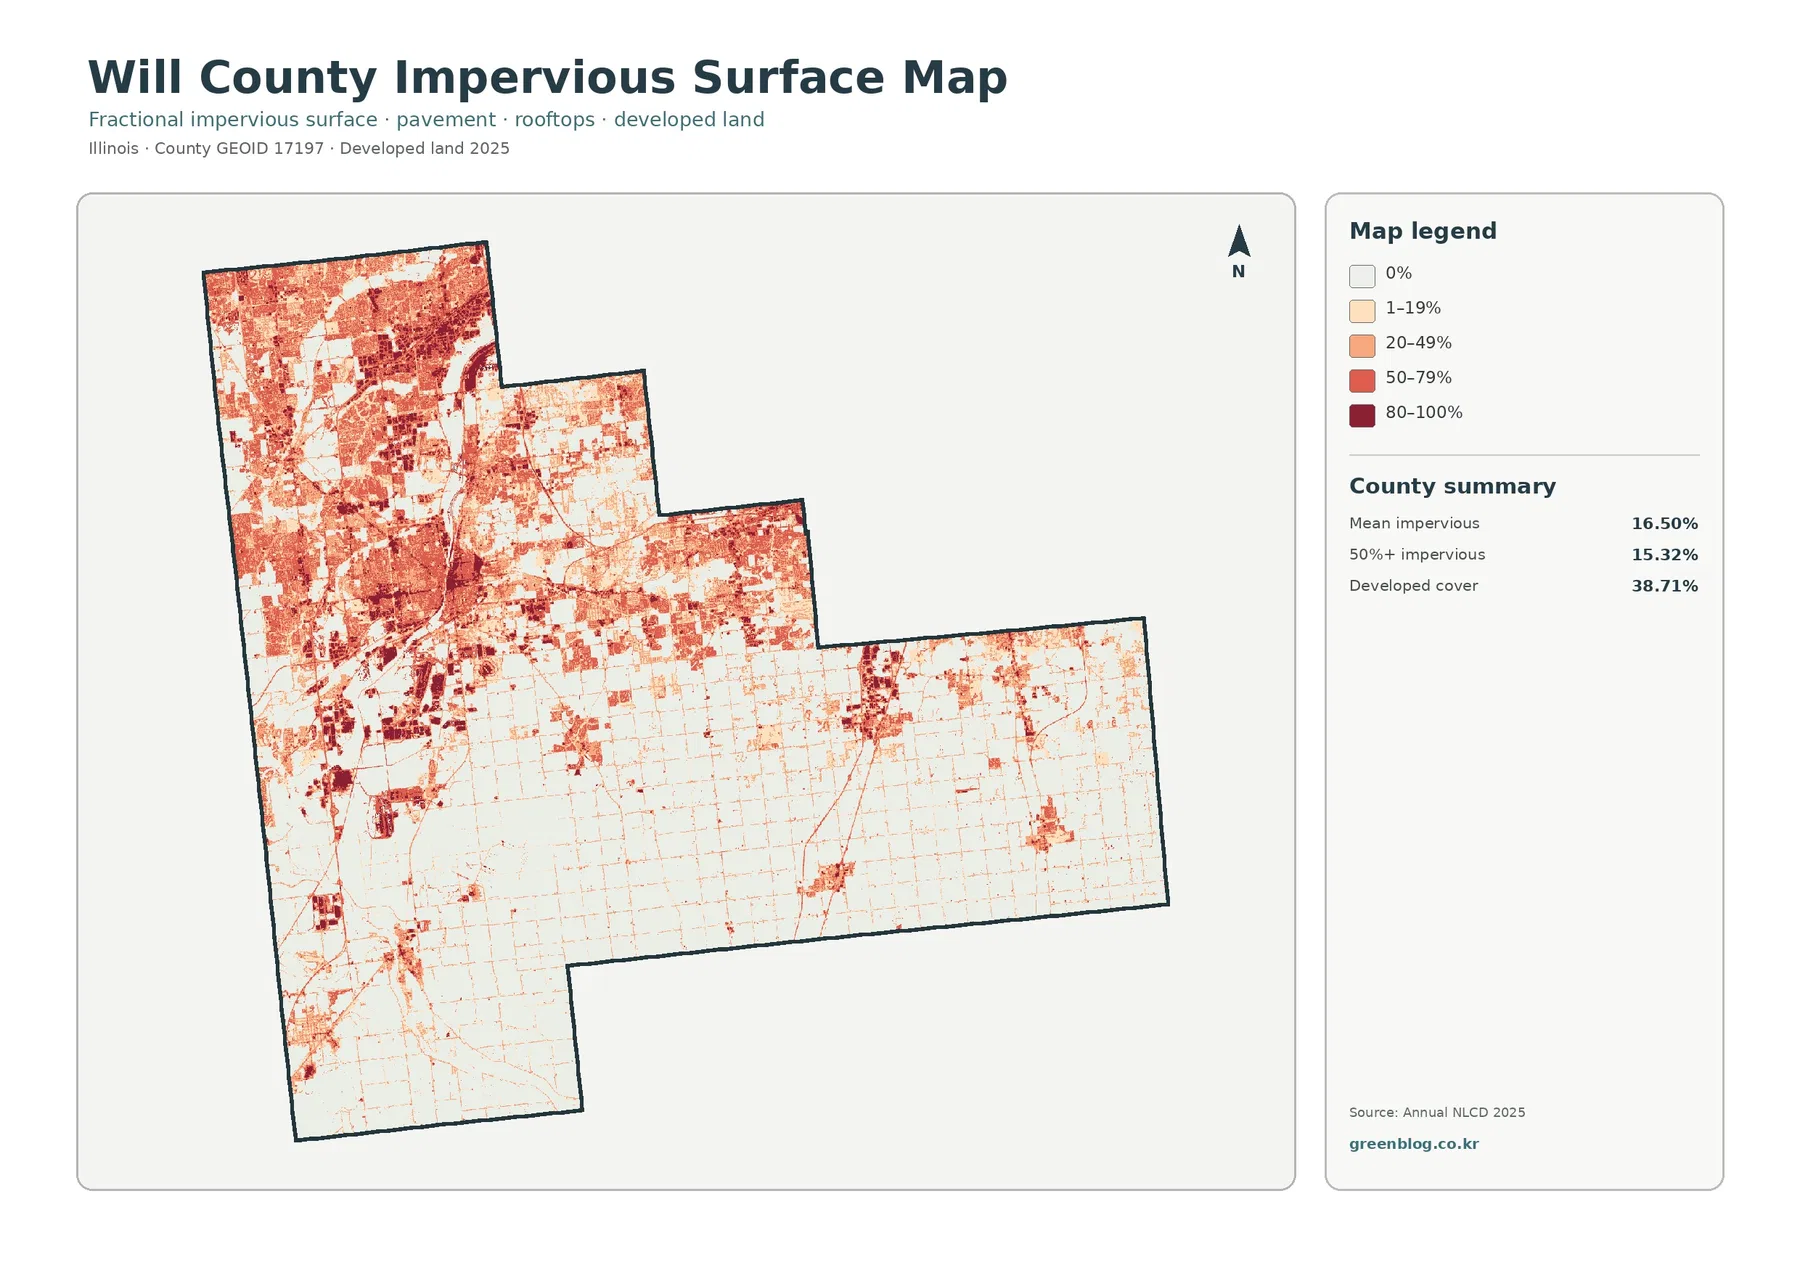
The spatial pattern is striking. Darker values cover large parts of the northwest, where many high-impervious cells connect into broad zones. The west and north-central areas also contain strong clusters. Moving south, the map becomes much lighter overall. In the long eastern section, most agricultural cells have very low impervious values, while roads and small developed centers appear as thin lines or compact darker patches. This makes the difference between the county’s two major land-cover settings especially clear.
A county average should not be assigned to any individual location. Some northwestern cells fall in the 80–100% range, while large agricultural areas are at zero or low values. The map is also not a flood-risk map. High impervious cover can be relevant to runoff, but actual flooding depends on rainfall, terrain, soils, drainage infrastructure, stream conditions, and other factors. The supported conclusion here is narrower: hard surfaces are far more concentrated in the developed northwest than in the agricultural south and east.
The 1985–2025 comparison marks class differences across 28.95% of the county
The change map compares land-cover classifications from 1985 and 2025. In Will County, 28.95% of cells are mapped with a class difference. The largest named component is change to developed land at 17.52%. Agricultural loss accounts for 1.67%, forest loss 0.12%, and other class differences 9.44%. These categories describe differences between two classified datasets; they should not be treated as a precise accounting of legal land-use conversion.
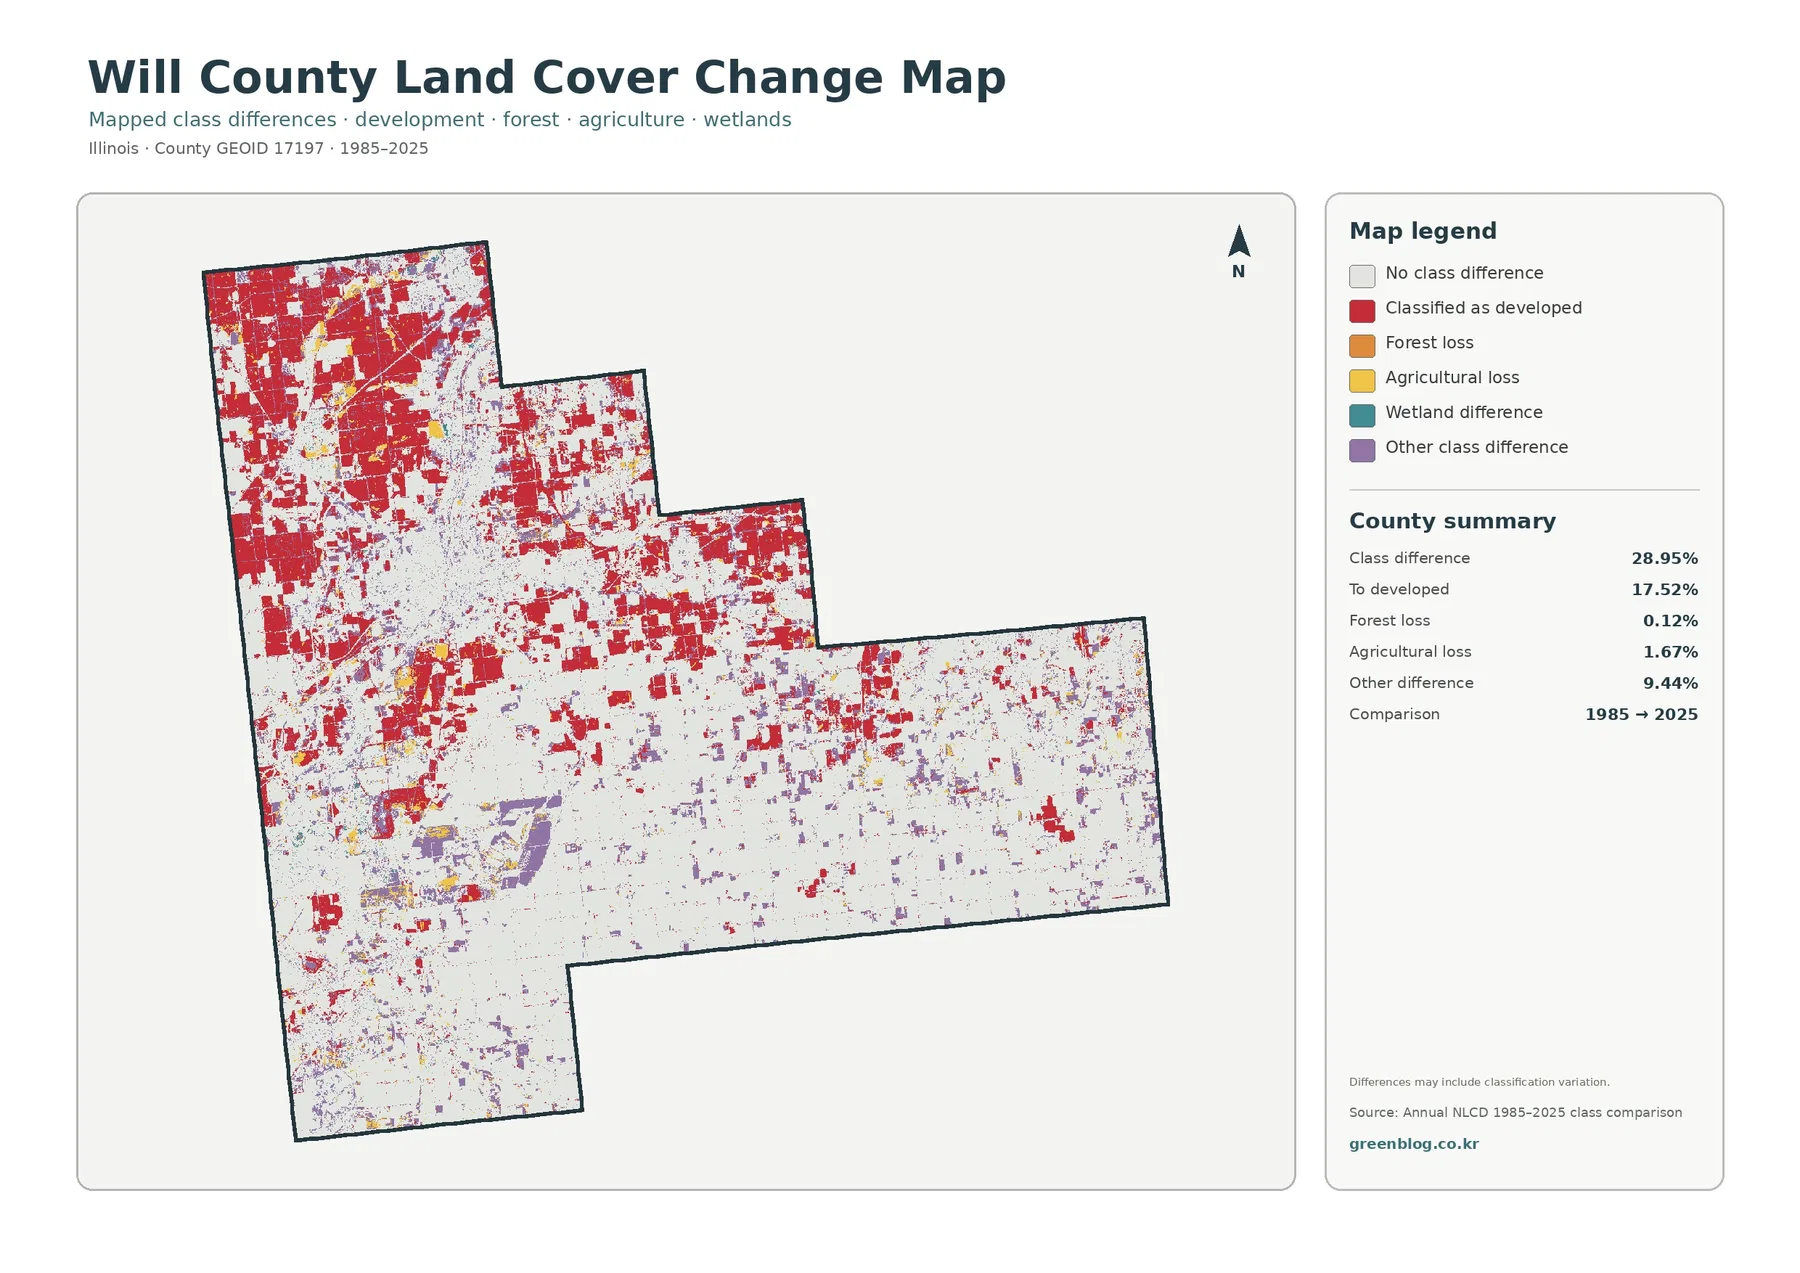
Red change-to-developed cells are extensive in the northwest and west and remain prominent across parts of the north-central area. Farther south and east, red areas become smaller and more scattered, though they still appear around compact developed clusters and along narrow connecting features. Purple other-difference cells are spread through both developed and agricultural settings. Yellow agricultural-loss cells occur in smaller pieces, and the orange forest-loss category is comparatively limited.
The 28.95% total should be read with care. Long-term comparisons can reflect real development and vegetation change, but they may also include differences in observation date, classification methods, mixed pixels, seasonal conditions, or changing water and vegetation states. The 9.44% other-difference component is a reminder that not every changed cell belongs to a simple development story. For a site-specific history, the change map is best used as a starting point for checking additional NLCD years, aerial imagery, and local records.
Matching the same place across all four maps separates current cover, hard surface, and long-term difference
The northwest provides the clearest example. On the general land-cover map it appears as a broad developed area. The impervious map then reveals that some parts of that developed footprint contain much higher percentages of pavement and rooftops than others. On the change map, only cells whose 1985 and 2025 classes differ receive change colors; the entire present-day developed area is not automatically marked as new development. These three views describe related but distinct properties of the same location.
The southern and eastern farm country works differently. Agriculture appears as wide, continuous yellow surfaces on the general and forest/farmland maps. The same areas are mostly pale on the impervious map, with darker values confined to roads and small centers. On the change map, large white areas indicate no mapped class difference, but small red, purple, and yellow patches remain scattered through the agricultural landscape. Current dominance by agriculture does not mean every cell stayed in the same class for forty years.
Wet areas provide a third comparison. Blue water and teal wetlands stand out inside the mixed developed northwest and along narrower corridors elsewhere. The forest/farmland map simplifies much of the surrounding development to gray, which can make wet and wooded cover easier to follow. The impervious map shows a sharp contrast between those softer surfaces and neighboring built areas, while the change map may show several different types of class difference nearby. Looking at one location repeatedly is the safest way to avoid confusing the meaning of the four products.
Thirty-meter raster cells are useful for county patterns, not parcel-level decisions
Annual NLCD is raster data: the ground is divided into cells and each cell receives a representative land-cover class or an impervious percentage. At roughly 30 meters, a cell can contain more than one real-world surface. A road edge, lawn, trees, a building, and a narrow water feature may all occur within the same area even though the map must represent it with one class or value. This limitation matters most along complex urban edges, wetland margins, and narrow transitions between farmland and development.
For that reason, the four maps are well suited to countywide comparison. They can show where developed land is concentrated, where farming remains broad, where wet and wooded cover interrupts those larger surfaces, and where impervious values or long-term class differences are most common. They are not appropriate for determining ownership, zoning, building eligibility, surveyed wetland boundaries, or exact parcel acreage. Those questions require the official records created for those specific purposes.
The most reliable reading starts with the large pattern and then moves to smaller details. In Will County, the large pattern is clear: agriculture and development are both major cover types but dominate different portions of the county. Forest, wetlands, and water form smaller but important breaks. Impervious cover rises sharply in the developed northwest, and the 1985–2025 map shows a large concentration of development-related class differences in many of the same broad areas. That county-scale structure is what these maps communicate best.
Choose the map by the question rather than expecting one view to answer everything
Use the general land-cover map when you need one overview of agriculture, developed land, forest, wetlands, and water. Choose the forest-and-farmland map when the main task is comparing broad agricultural surfaces with wooded and wet cover. The impervious-surface map is the better choice for locating concentrations of pavement and rooftops within the developed footprint. The 1985–2025 comparison is most useful for identifying where the mapped class changed between the two dates and what type of difference was assigned.
For a presentation or classroom exercise, the four maps can be placed in the same order and read as a sequence of questions. Why does developed land cover 38.71% while mean impervious cover is only 16.50%? Why does agriculture lead the county total even though the northwest looks strongly urbanized? Where do the 17.52% change-to-developed cells overlap the present developed footprint, and where do other class differences occur instead? Those comparisons turn the maps into a clearer explanation of the county than a list of percentages alone.
Download the four original Will County JPG maps
The ZIP contains four JPG files for Will County: general land cover, forest and farmland, impervious surface and developed land, and the 1985–2025 land-cover change map. Because every file uses the same County GEOID 17197 boundary, the developed northwest, agricultural south and east, wet corridors, high-impervious clusters, and long-term class differences can be matched from one map to the next. The WebP versions in the article are for quick browsing; the JPG files are convenient for local reference, documents, lessons, or presentations.
Frequently Asked Questions
Why is Will County 38.71% developed land but only 16.50% mean impervious cover?
The two measures describe different things. Developed land is a land-cover class that can include lawns, trees, and other permeable surfaces mixed with buildings and roads. Impervious cover measures the share of hard surfaces such as pavement, parking areas, and rooftops. A developed area therefore does not have to be completely impervious, which is why the countywide percentages differ.
Does the 46.69% agriculture figure represent legally registered farmland?
No. The 46.69% value is the share classified as agriculture in the supplied 2025 Annual NLCD map. It is a satellite-based land-cover measure, not a record of ownership, tax status, zoning, conservation designation, or legal farm acreage. Parcel-level farmland questions require records created for those purposes.
Can the 28.95% class difference from 1985 to 2025 be called the county’s development growth rate?
No. The 28.95% total includes 17.52% mapped as change to developed land, 1.67% agricultural loss, 0.12% forest loss, and 9.44% other class differences. Long-term classification comparisons can also reflect observation timing, methodology, and mixed-cell effects. A specific development history should be checked with additional years, aerial imagery, and local records.
Sources and Reference Data
- MRLC Annual NLCD Data – official source for annual land-cover and impervious-surface datasets
- USGS Annual NLCD Land Cover Classification – classification, legend, and interpretation information
- U.S. Census Bureau TIGER/Line Shapefiles – standard Will County boundary and geographic reference data
Map File Information
Download the four original JPG maps for Will County to compare agriculture, developed land, forest and wetlands, impervious cover, and mapped class differences from 1985 to 2025.
- Included Files: Land Cover Map, Forest & Farmland Map, Impervious & Developed Land Map, Land Cover Change Map
- File Type: 4 JPG maps in one ZIP
- Intended Use: comparing the developed northwest with the agricultural south and east, checking impervious concentration, reviewing wet cover, and locating 1985–2025 class differences
Related Maps
- Adams County Illinois Land Cover Map
- Alexander County Illinois Land Cover Map
- Bond County Illinois Land Cover Map
Green Map creates custom-edited map images using open geographic data sources such as geoBoundaries, Natural Earth, OpenStreetMap, and government open data.
These maps are edited visual materials, not raw data files, and are provided for education, documents, presentations, and graphic reference.