A world map of clean cooking access looks very different from a simple map of electricity, income, or total energy use. This article uses World Bank World Development Indicators series EG.CFT.ACCS.ZS, “Access to clean fuels and technologies for cooking (% of population),” and holds the comparison to a single reference year: 2023. Of 217 country and economy rows in the cleaned master table, 189 have a numeric 2023 observation and 28 remain missing.
The distribution is unusually uneven. The simple average across the 189 reported economies is about 69.6%, while the median is much higher at 91.4%. Sixty-one economies are recorded at 100%, and 71 are at 99% or above. At the other end, 36 are below 20% and 56 are below 50%. That combination—many near-universal values plus a long low-access tail—is why the map is more informative than a single global summary statistic.
“Clean” has a specific health-related meaning in this indicator. WHO classifies fuels and technologies against household-air-pollution emission criteria; electricity, natural gas, LPG, biogas, ethanol and solar are among the options recognized as clean at the point of use. The measure therefore asks what share of the population primarily relies on clean cooking fuels and technologies. It should not be read as the electricity-access rate, the share of renewable energy, or a measure of household income.
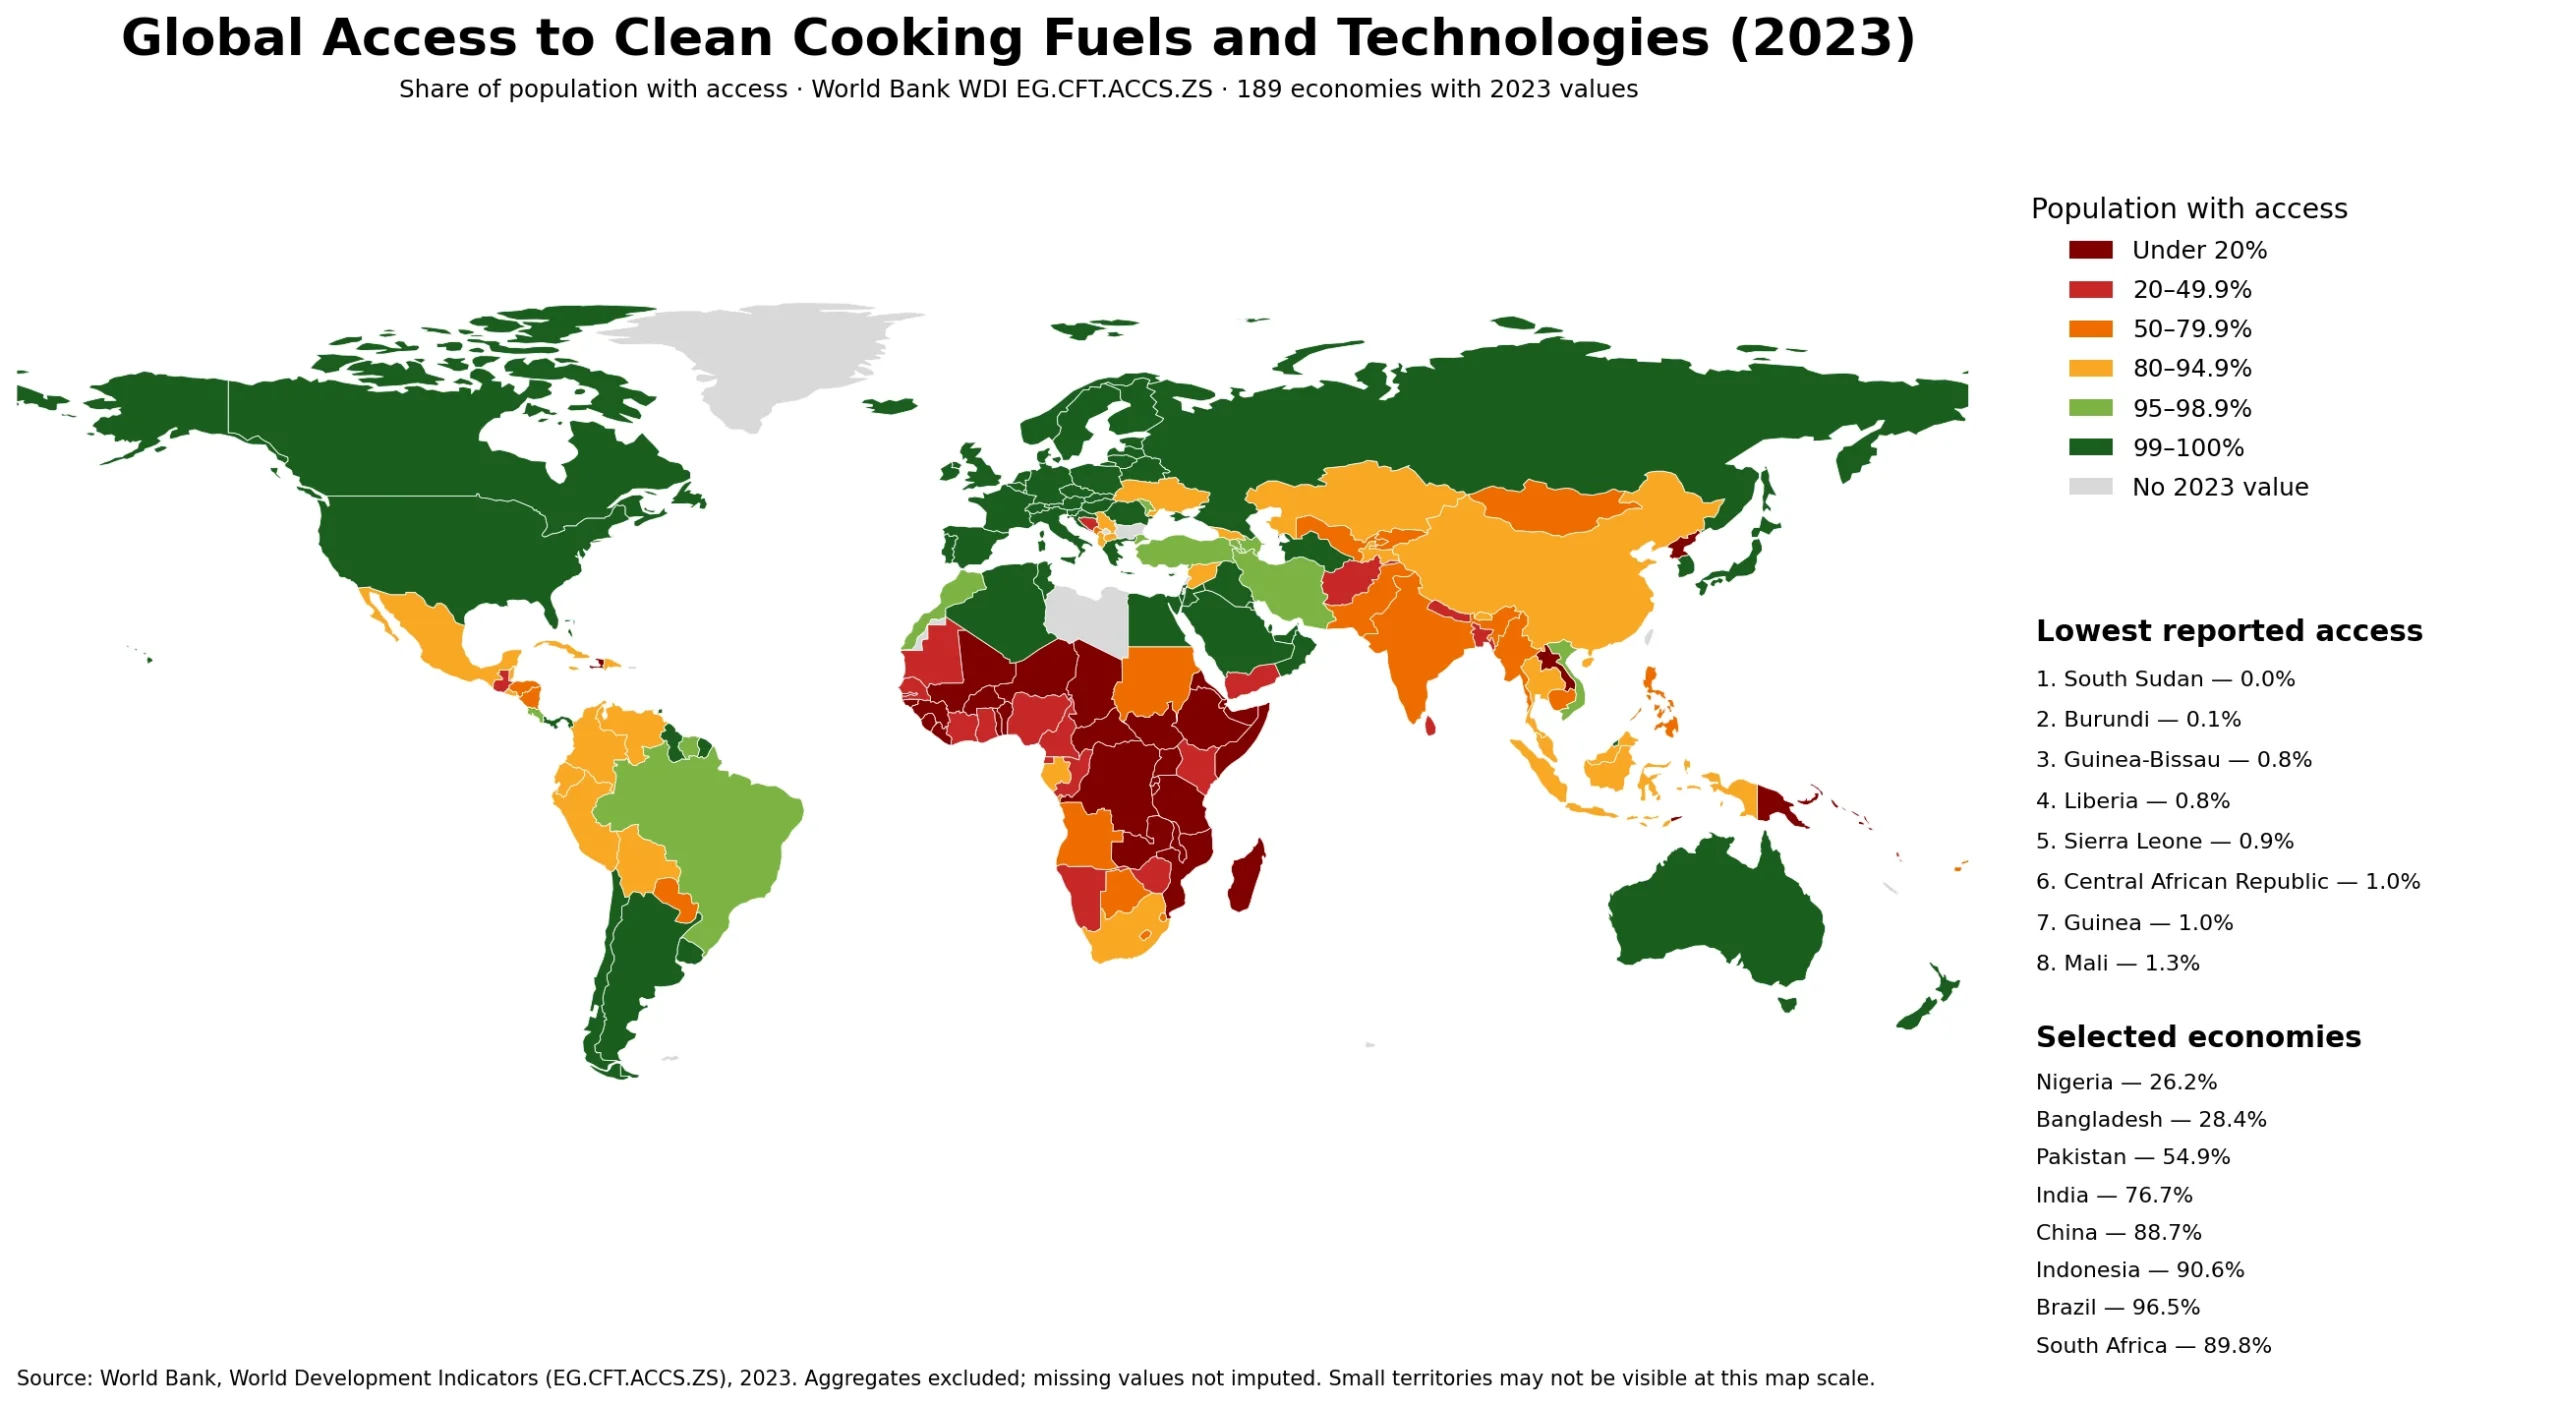
Table of Contents
The strongest geographic divide on the 2023 map
Near-universal access covers most of North America and Europe, Australia and New Zealand, several Gulf economies, and a number of East Asian countries. The United States, South Korea, Japan, Germany, France, Saudi Arabia and the United Arab Emirates are all reported at 100% for 2023. The opposite end of the map is concentrated heavily in Sub-Saharan Africa, where many countries fall below 20% and a second group sits between 20% and 50%.
Africa should not be treated as one uniform block. Algeria is at 99.7%, Egypt and Tunisia are both 99.9%, and Morocco is 98.1%. Farther south, Uganda is 1.8%, Ethiopia 7.1%, Mozambique 7.4%, Zambia 9.2%, and Tanzania 9.8%. The continent therefore contains some of the widest neighboring contrasts visible on the map, and a continental average would hide much of the pattern that matters for country-level comparison.
Countries with the lowest reported clean cooking access
| Country or economy | 2023 access |
|---|---|
| South Sudan | 0.0% |
| Burundi | 0.1% |
| Guinea-Bissau | 0.8% |
| Liberia | 0.8% |
| Sierra Leone | 0.9% |
| Central African Republic | 1.0% |
| Guinea | 1.0% |
| Mali | 1.3% |
| Malawi | 1.5% |
| Gambia, The | 1.6% |
The bottom of the distribution is compressed close to zero. South Sudan is recorded at 0.0% and Burundi at 0.1%. Guinea-Bissau and Liberia are both 0.8%, followed by Sierra Leone at 0.9%, the Central African Republic and Guinea at 1.0%, Mali at 1.3%, Malawi at 1.5%, and The Gambia at 1.6%. Uganda is only slightly higher at 1.8%. These percentages describe the national share primarily relying on clean cooking solutions; they do not mean that every household uses the same fuel or stove.
WHO links reliance on polluting household fuels and technologies to household air-pollution risks, which is why clean cooking is tracked under SDG 7.1.2. Still, this map should not be used to assign a single cause to a low national value. Infrastructure, fuel availability and prices, urban-rural settlement patterns, household preferences, and other factors can all matter. The WDI series measures the access outcome, not the independent contribution of each possible driver.
Asia spans nearly the full range of the indicator
Asia contains countries at almost every stage of the distribution. South Korea and Japan are at 100%, Viet Nam is 98.7%, Indonesia 90.6%, and China 88.7%. India is 76.7%, the Philippines 59.5%, Pakistan 54.9%, Cambodia 58.0%, Nepal 42.7%, Bangladesh 28.4%, and Lao PDR 11.1%. The regional picture therefore cannot be reduced to a simple “high” or “low” label.
For very populous countries, percentage changes can correspond to large changes in the number of people affected. This article does not convert the percentages into population counts because doing so would require a second, same-year population dataset and an explicit calculation. The map is intentionally limited to the verified percentage series so that it does not mix measures or reference periods.
Latin America shows high coverage with important exceptions
Much of Latin America is in the upper bands: Argentina is 99.9%, Brazil 96.5%, Colombia and Peru 91.8%, Bolivia 90.6%, Mexico 85.1%, and the Dominican Republic 93.5%. Haiti is the major contrast at just 4.5%. That gap is a reminder that geographic proximity alone does not determine a country’s clean cooking access level.
Selected large economies on the same 2023 scale
| Country or economy | 2023 access |
|---|---|
| United States | 100.0% |
| Korea, Rep. | 100.0% |
| Japan | 100.0% |
| Brazil | 96.5% |
| Indonesia | 90.6% |
| South Africa | 89.8% |
| China | 88.7% |
| Mexico | 85.1% |
| India | 76.7% |
| Pakistan | 54.9% |
| Bangladesh | 28.4% |
| Nigeria | 26.2% |
| Tanzania | 9.8% |
| Zambia | 9.2% |
| Uganda | 1.8% |
Looking only at large or widely discussed economies also produces a wide spread. Brazil is above 96%, Indonesia and South Africa are near 90%, China is 88.7%, and India is 76.7%. Pakistan is just above half, while Bangladesh and Nigeria are below 30%. This is why clean cooking access should be checked directly rather than inferred from GDP, total energy production, or electricity access.
Why the 100% cluster should not be over-ranked
Sixty-one reported economies are at exactly 100.0%, and 71 are at 99% or higher. A league table that tries to rank every one of those economies from first to seventieth would create more precision than the indicator can meaningfully support. The useful distinction is that these countries are in a near-universal-access group, not that 100.0% is substantively superior to 99.9% in every practical sense.
The international series can also include modelled estimates. WHO explains that nationally representative household surveys and censuses feed a statistical estimation process, and that internationally reported estimates may differ from national figures because definitions and modelling methods can differ. Using a single WDI series keeps the cross-country comparison internally consistent, but readers should still treat the values as indicator estimates rather than as a literal census of every household in 2023.
How the 28 missing 2023 observations are handled
The cleaned master table has 217 country and economy rows, but 28 do not have a retained 2023 number. Examples include Aruba, American Samoa, Bulgaria, Bermuda, Greenland, Hong Kong SAR, Macao SAR, Lebanon, Libya, Puerto Rico, West Bank and Gaza, and Kosovo. Those rows are not backfilled with an older year. A gray or absent area on the map therefore means “no retained 2023 value for this same-year comparison,” not “zero access.”
The World Bank country table also includes separately reported territories and economies in addition to sovereign states, so the count of 189 should not be interpreted as a sovereign-country count. Small island economies and territories may also be too small to appear clearly on the low-resolution world base map even when they are present in the statistical table.
Source, definition, and calculation method
The main statistical source is the World Bank World Development Indicators series for access to clean fuels and technologies for cooking, indicator EG.CFT.ACCS.ZS. This package uses the 2023 observation, country/economy geography, and ISO3 identifiers. World Bank regional and income-group aggregates are excluded, and missing observations are preserved rather than imputed.
For the definition of “clean,” see the WHO guidance on clean fuels and technologies and the WHO metadata for the SDG 7.1.2 clean cooking indicator. WHO bases the classification on emission-rate guidance and identifies electricity, natural gas, LPG, biogas, ethanol and solar among clean cooking options.
All rankings, threshold counts, the mean, the median, the tables, and the choropleth classes in this article were calculated directly from the cleaned CSV supplied with this package. No news article or third-party ranking was used to create the numbers, and no missing country was assigned an estimated value by this writing process.
Frequently Asked Questions
Is clean cooking access the same as electricity access?
No. Clean cooking access measures the share of the population primarily relying on clean fuels and technologies for cooking. Electricity access measures whether people have access to electricity and is a separate indicator.
Which fuels and technologies are considered clean for cooking?
WHO guidance classifies options according to emissions performance. Electricity, natural gas, LPG, biogas, ethanol and solar are among the commonly recognized clean cooking options.
Do gray countries on the map have 0% clean cooking access?
No. The cleaned table has 28 country or economy rows without a retained 2023 value. Those observations remain missing rather than being treated as zero or filled with an older year.
Why are so many countries shown at 100%?
The 2023 series records 61 economies at exactly 100% and 71 at 99% or above. For these economies, it is more useful to think of a near-universal-access group than to force a detailed ranking.
Related Maps
The country map pages below provide geographic context for several economies that appear at very different positions in the clean-cooking distribution. They are location and administrative-reference resources, not explanations of why each country has its reported access rate.
- Zambia Map with 10 Provinces and Border Context
- India Maps Download Collection for Regional Reference
- South Africa Map: Printable Provincial Reference
- Democratic Republic of the Congo Map: 26 Provinces
Green Map creates custom-edited map images using open geographic data sources such as geoBoundaries, Natural Earth, OpenStreetMap, and government open data.
These maps are edited visual materials, not raw data files, and are provided for education, documents, presentations, and graphic reference.