The Rock Island County Illinois Land Cover Map set captures one of the clearest urban-to-rural contrasts in western Illinois. A broad developed belt around the Illinois side of the Quad Cities occupies the middle of the county, while large farm blocks spread across the south, east, and northern extension. Forest, water, and wetlands become especially noticeable along the Mississippi River, the Rock River, and wooded drainage corridors.
Four map views are included on this page: 2025 land cover, forest and farmland, impervious surface and developed land, and mapped class differences from 1985 to 2025. The four original JPG maps are also available together in one download for printing, classroom work, presentations, and county-level comparison.
Table of Contents
A county split between the Quad Cities and broad farm country
Rock Island County does not read as a uniformly rural county even though agriculture is its largest land-cover class. The 2025 summary assigns 54.66% of the county to agriculture, but developed land accounts for 18.95% and forms a large, continuous-looking cluster in the central part of the map. That cluster stands apart from the rectangular farm pattern farther south and east, making the county’s metropolitan and agricultural landscapes easy to compare on the same sheet.
Forest covers 15.81%, water 5.68%, and wetlands 4.28%. Those shares are large enough to shape the map visually rather than appearing as minor background classes. Blue water areas trace major river edges, while forest and wetland colors interrupt both farm country and developed land. The result is a landscape in which river systems, cities, and agriculture all occupy prominent space.
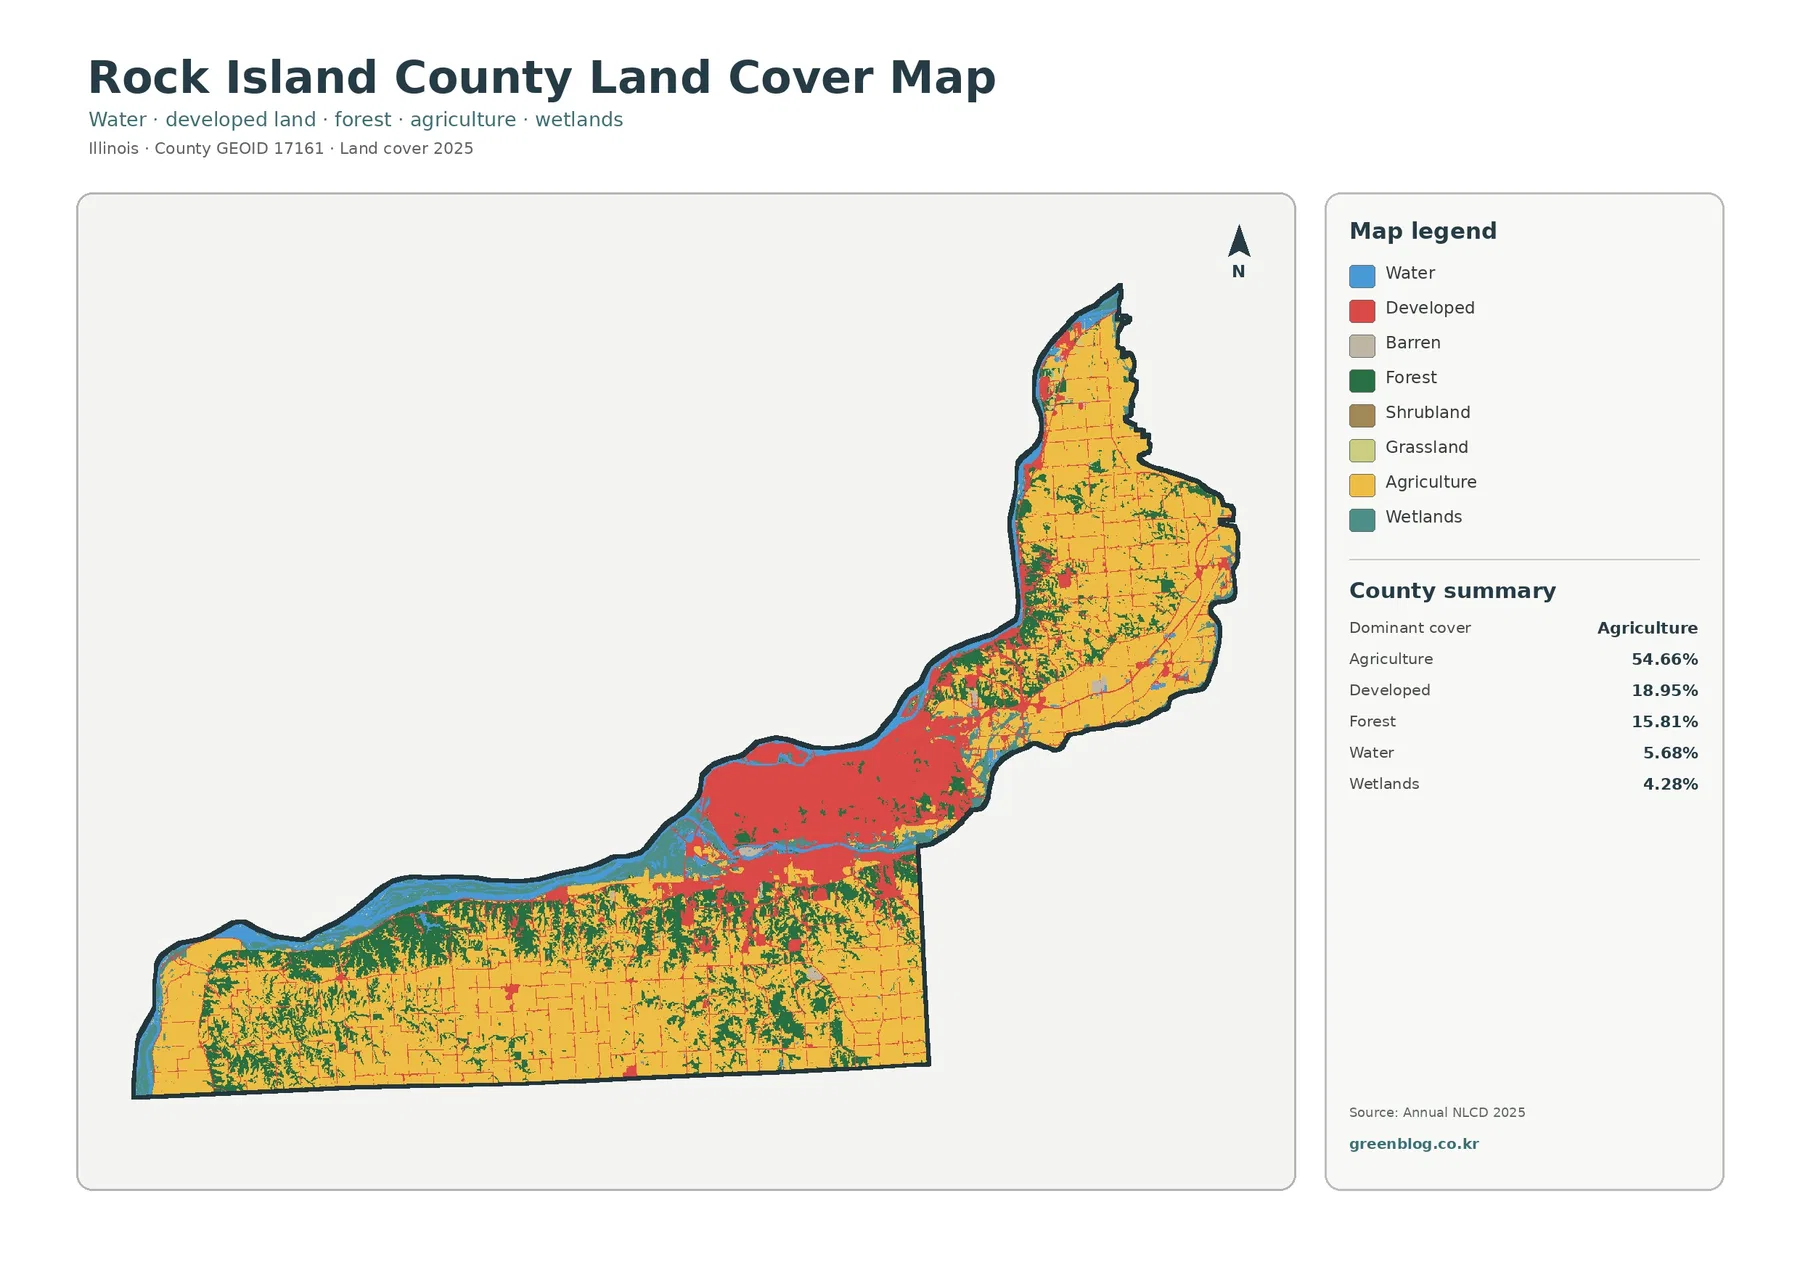
The county’s unusual outline helps explain why the pattern changes so quickly from one end to another. The southern portion is broad and mostly agricultural, the central section contains the largest developed concentration, and the northern extension follows the Mississippi River corridor. Reading the map by these subareas is more useful than treating the county as one average landscape.
River edges and wooded corridors remain visible inside a developed county
The forest-and-farmland view removes much of the visual weight of developed classes and makes natural cover easier to follow. Cropland dominates the open landscape, but forest does not appear as one isolated block. It forms bands and branching patches that follow river margins, tributary corridors, and more irregular terrain, especially where the agricultural grid breaks apart.
Water and wetlands are also important along the Mississippi and Rock River environments. On this map, wetlands should be read as a surface-cover classification derived from remotely sensed data, not as a legal wetland boundary or a statement about land ownership. The distinction matters because a mapped wetland cell can be useful for regional comparison without answering permitting, jurisdiction, or parcel-level questions.
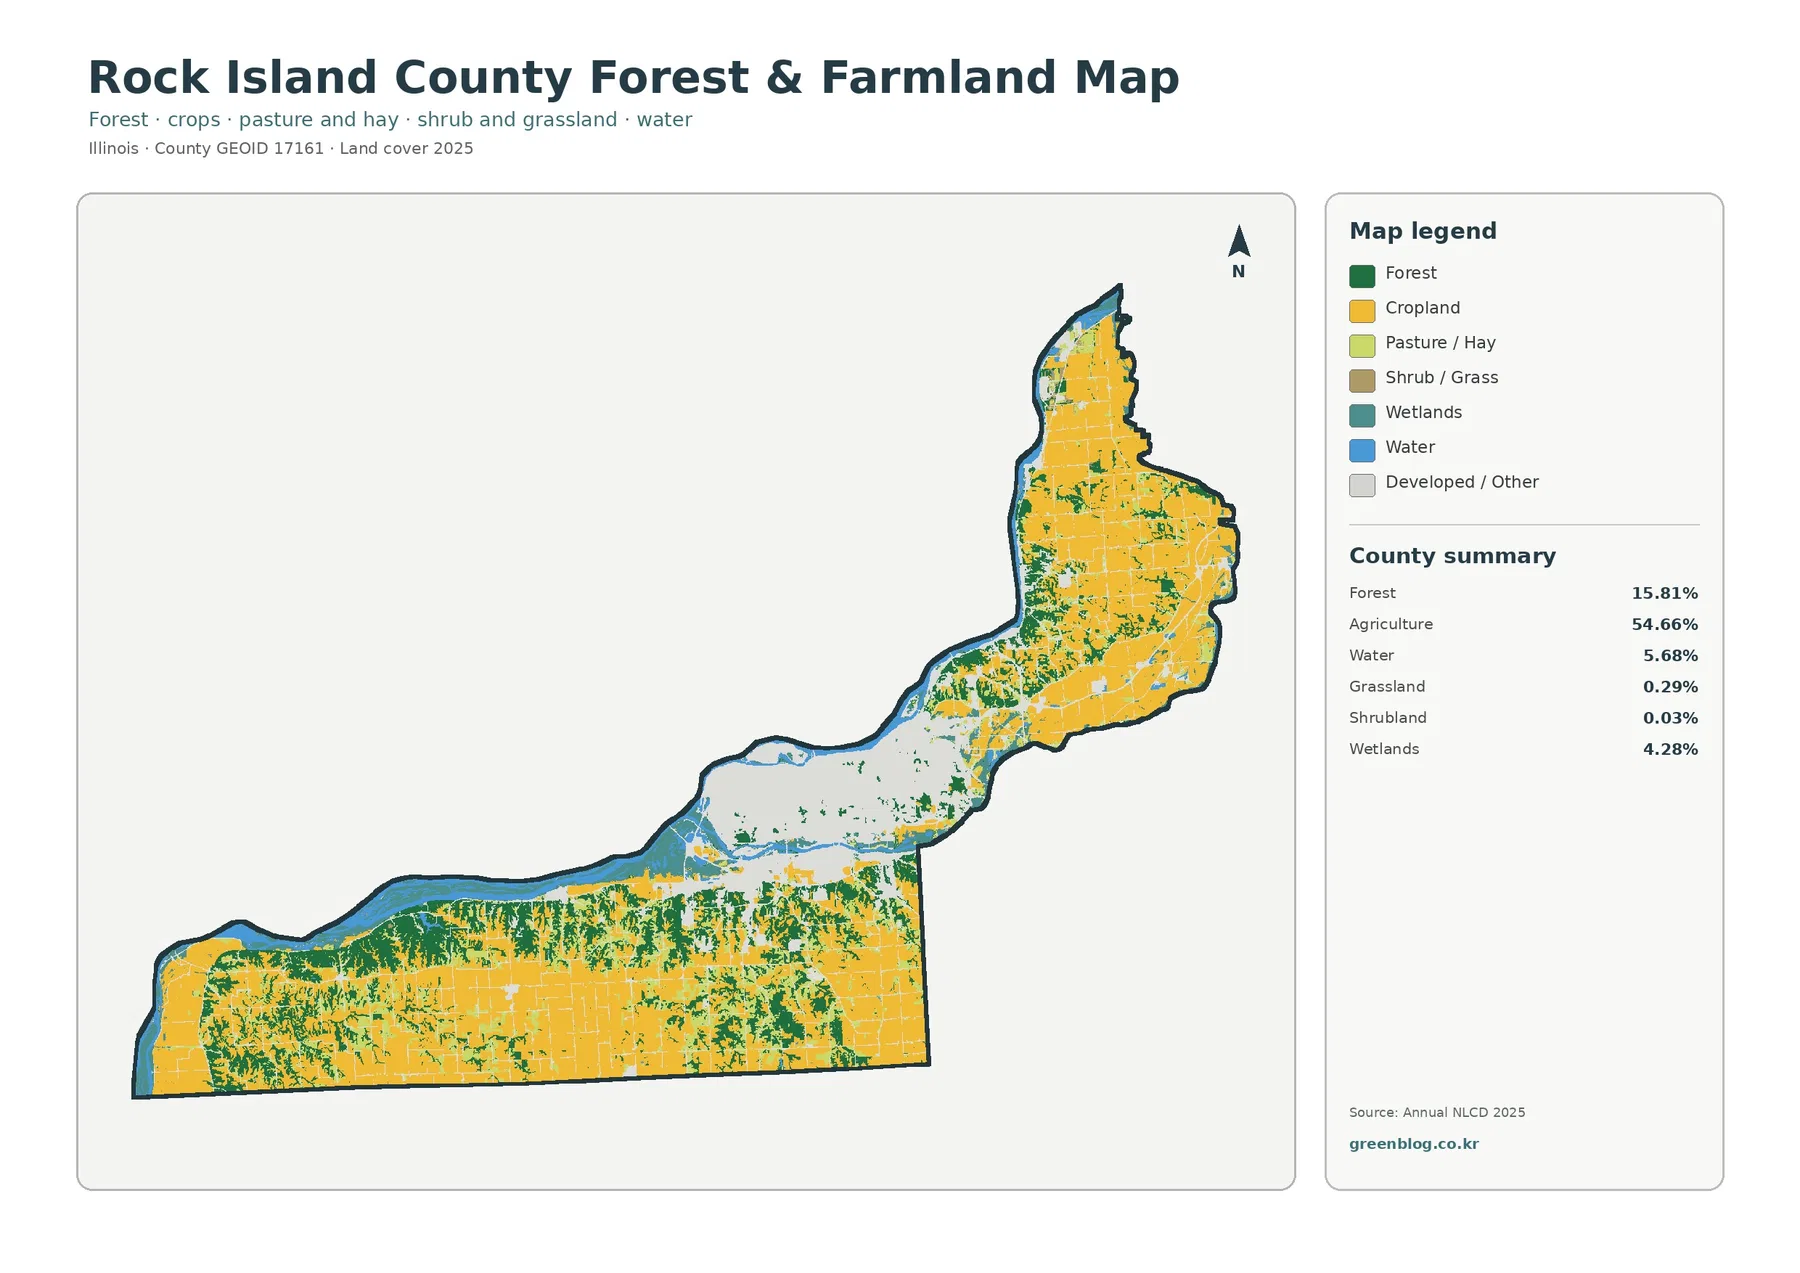
The summary reports 15.81% forest, 54.66% agriculture, 5.68% water, 4.28% wetlands, 0.29% grassland, and only 0.03% shrubland. Because grassland and shrubland occupy very small shares, the most useful natural-cover comparison is between farmland, forest, river water, and wetlands rather than trying to make every legend class equally important.
Impervious cover reveals the intensity of the central urban belt
Impervious surface means pavement, rooftops, parking lots, and other hard surfaces that shed water rather than allowing it to soak into the ground. Rock Island County has a mean impervious value of 7.04%, while 5.68% of the county falls in areas with at least 50% impervious cover. These numbers add detail that the broader developed-land category cannot provide by itself.
The darkest impervious values are concentrated around the Rock Island–Moline–East Moline urban area and related built-up corridors. Outside that core, most hard-surface signals become thinner and more linear, often following roads through farm country or appearing as small settlement clusters. This pattern makes the impervious map especially useful when the goal is to distinguish a dense urban surface from lower-density development.
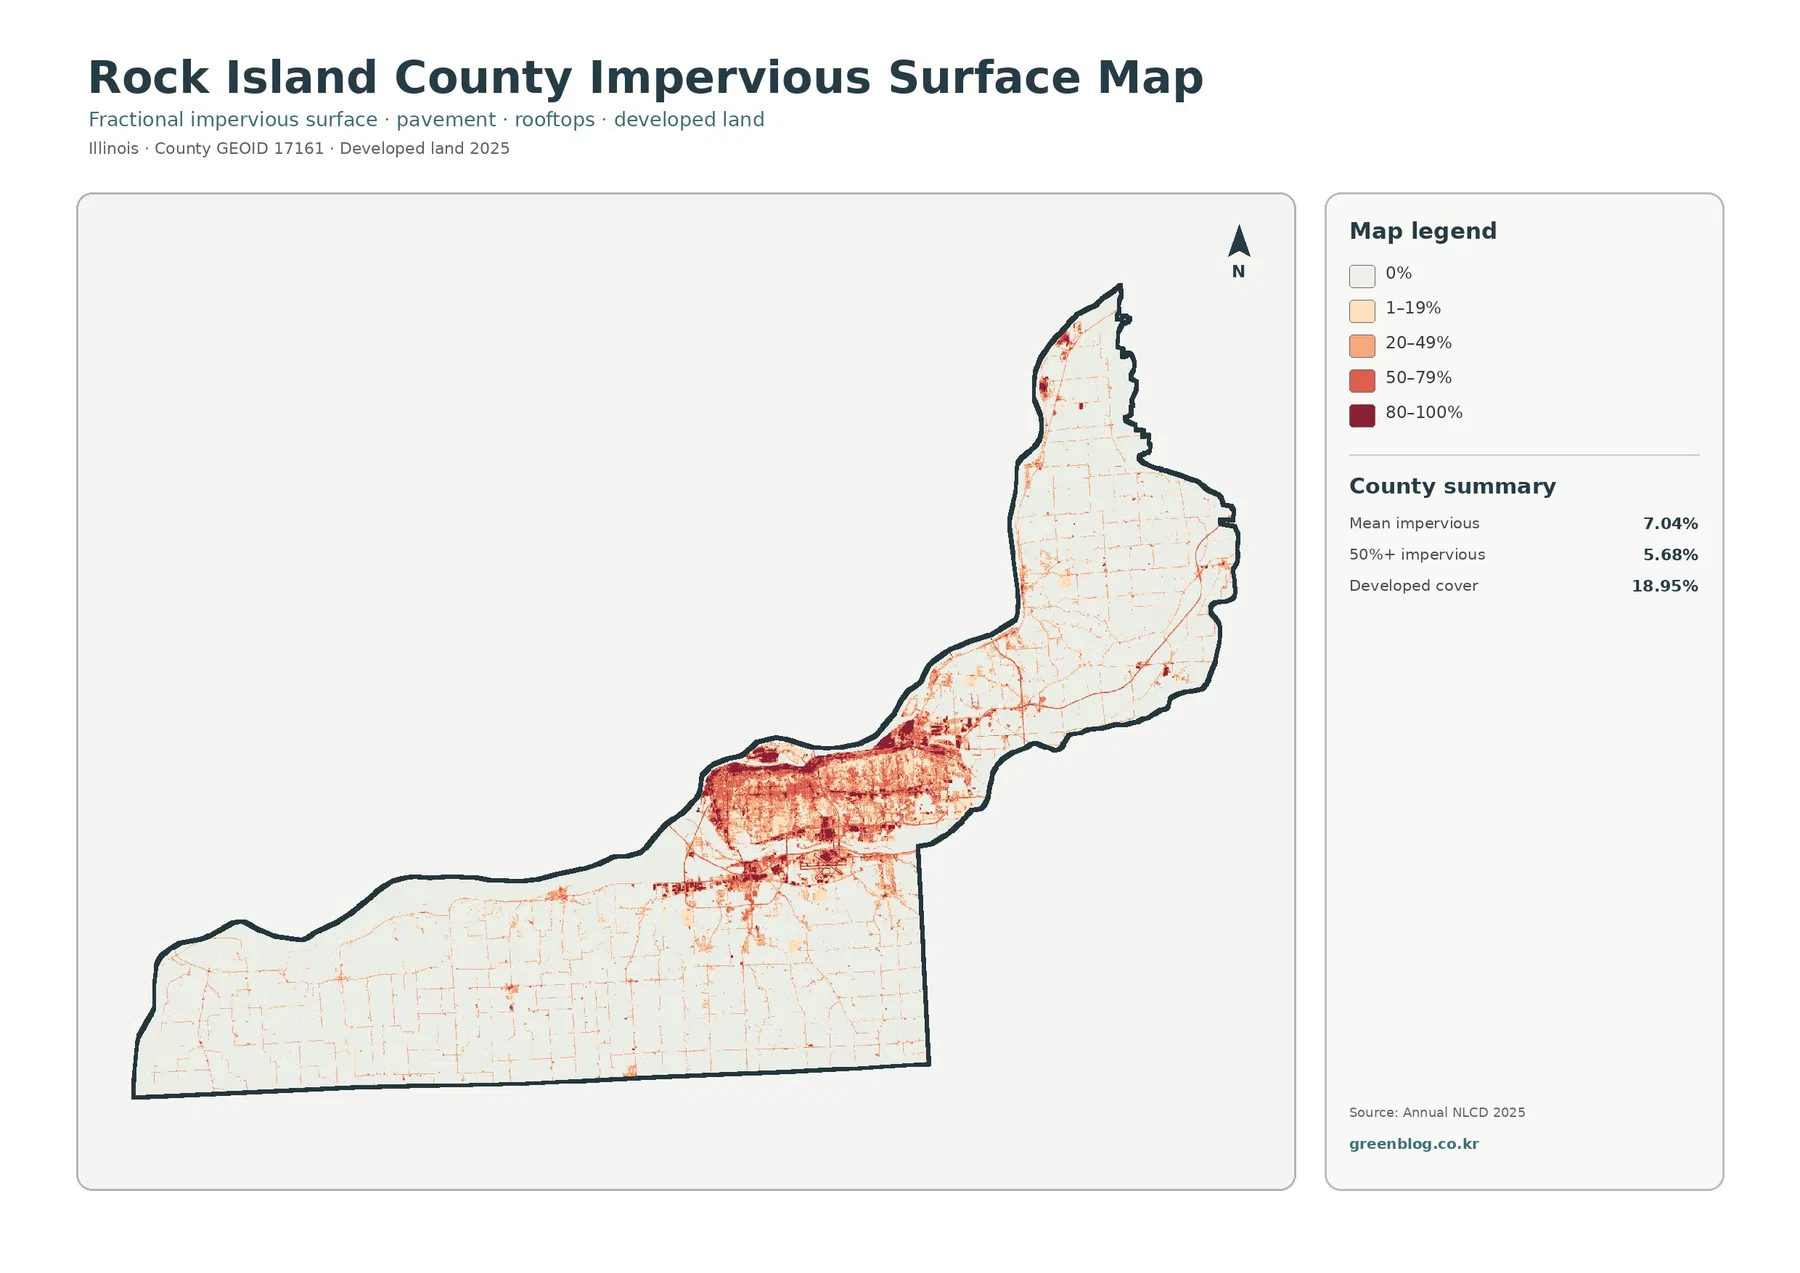
Developed land and impervious cover should not be treated as interchangeable measures. A developed NLCD class may still contain lawns, trees, yards, and other permeable surfaces, which is why the 18.95% developed share is much larger than the 5.68% area above 50% imperviousness. The difference is useful: one map identifies the broader developed landscape, while the other shows where hard surfaces are most concentrated within it.
What the 1985–2025 difference map can and cannot prove
The long-term comparison marks 11.43% of the county as having a class difference between 1985 and 2025. Of that total, 2.31% is mapped as changed to developed, 0.65% as forest loss, and 0.68% as agricultural loss. The largest category is “other class difference” at 7.50%, which immediately shows why the full 11.43% should not be described as a development rate or a single type of land conversion.
Red change pixels are more common around the developed central corridor and at smaller built locations elsewhere. Purple “other” differences are more widely scattered, including across rural areas. The map itself warns that differences may include classification variation, so a colored cell should be treated as a place to investigate rather than proof of a particular construction project, clearing event, or land-use decision.
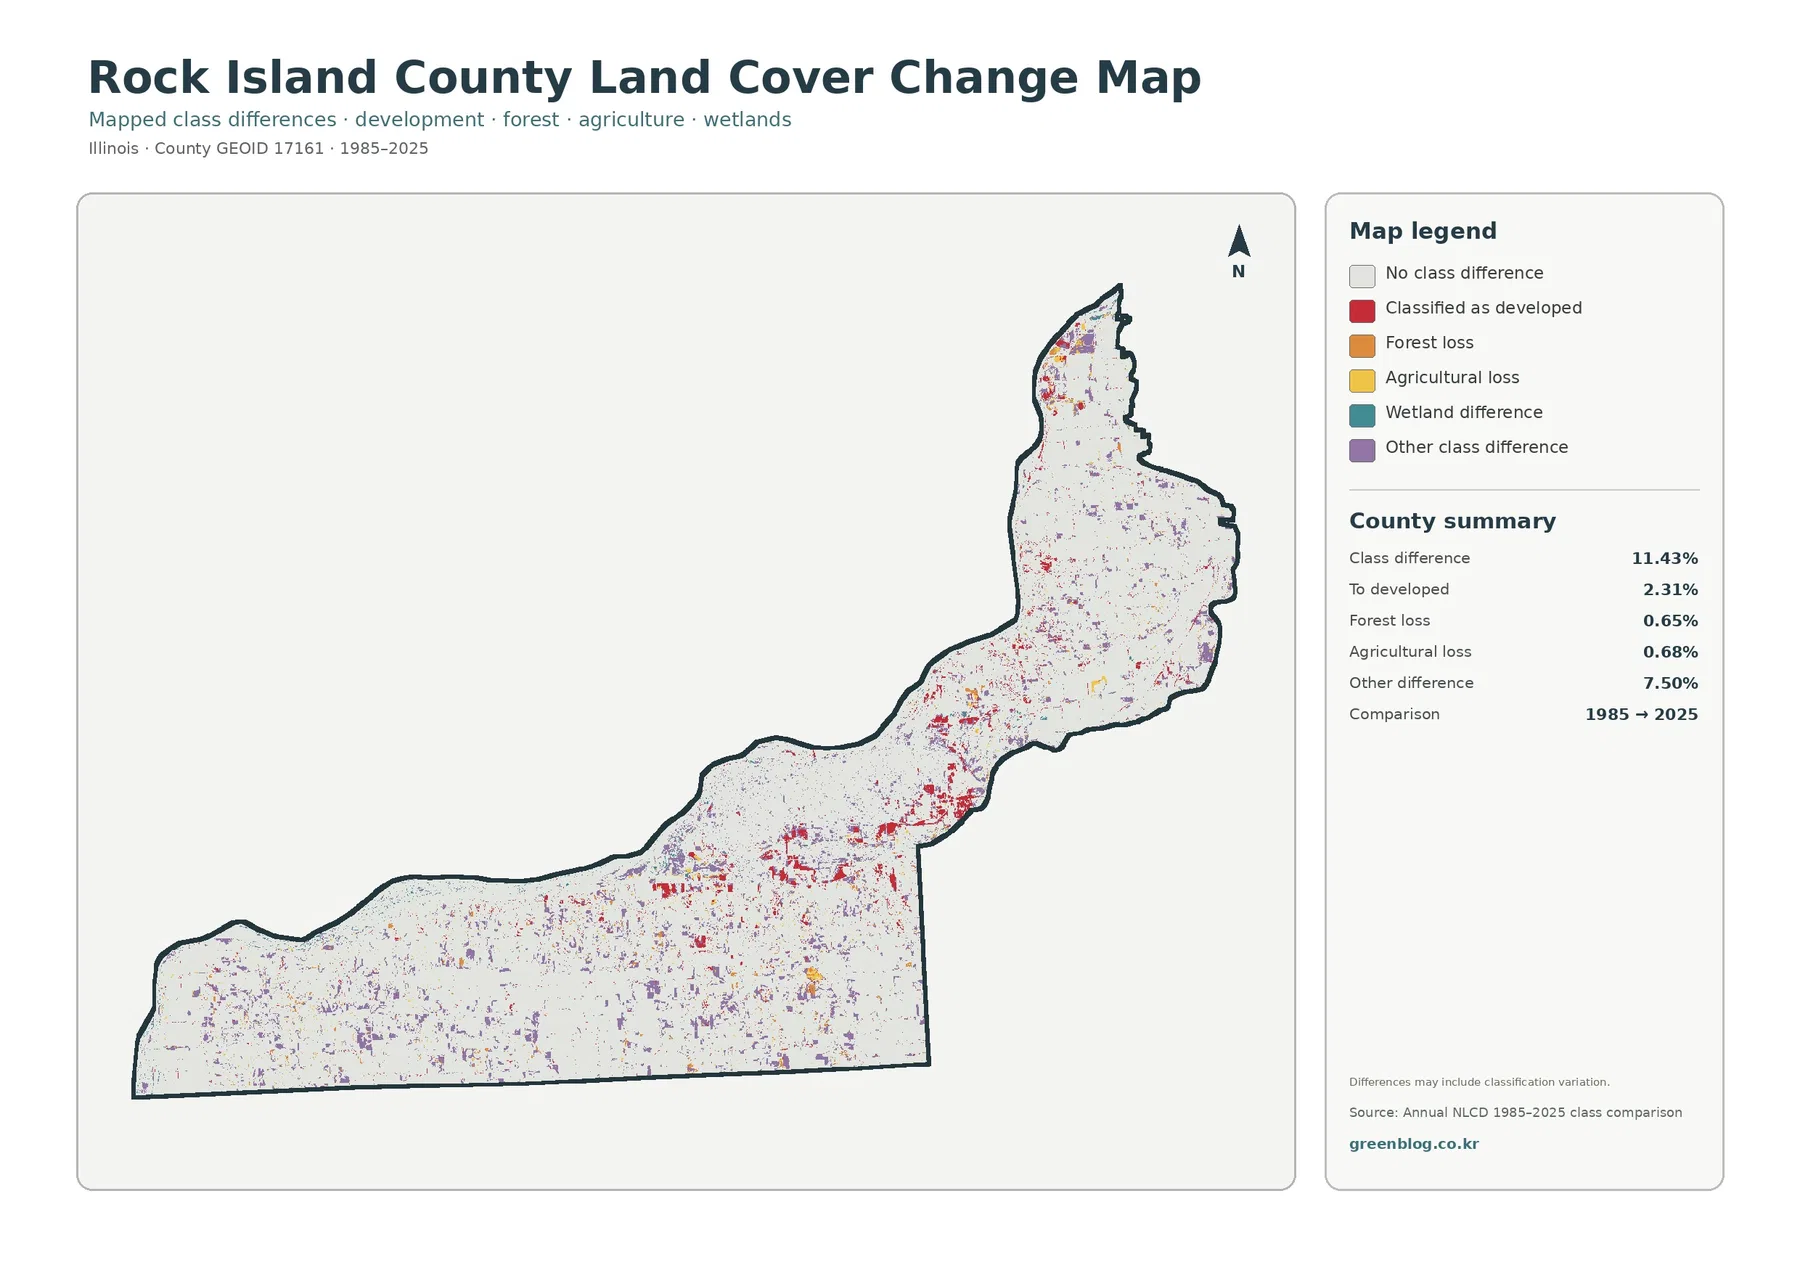
A practical way to use this map is to check the same location on the 2025 land-cover and impervious maps. If a red change area also appears as developed land with high imperviousness today, the current surface condition is clearer. Where the difference map is colored but current land cover does not support an obvious interpretation, it is better to leave the cause unresolved until historical imagery or local records are consulted.
Local conservation context helps explain some of the green and blue areas
Rock Island County’s own comprehensive plan describes a county shaped by historic Mississippi River communities, a major agricultural and natural-resource base, and the Quad Cities metropolitan economy. That local framing matches the broad contrast visible in the land-cover maps without turning a planning document into a substitute for the NLCD classification. Planning categories and surface cover answer different questions.
The Rock Island County Forest Preserve District also manages multiple preserves in the county. Illiniwek Forest Preserve provides direct Mississippi River access, while Loud Thunder Forest Preserve contains a large wooded preserve and Lake George. These official locations give useful geographic context for some forest and water areas, but not every green pixel belongs to a public preserve. NLCD forest can include private woodland, riverbank trees, parks, and other tree-covered land.
Choosing the right map for a specific question
For a general county overview, start with the 2025 land-cover map because it places agriculture, developed land, forest, water, and wetlands on one legend. It quickly answers where the urban belt ends and broad farm country begins. If the question shifts toward rural landscape structure, the forest-and-farmland map is easier to read because it reduces developed areas to a quieter background.
Use the impervious map when the key issue is the intensity of built surfaces rather than the presence of development in general. It is particularly useful for comparing the dense Quad Cities core with smaller settlements and rural road networks. Use the change map only after the present-day maps are understood, because a class-difference pixel is much easier to interpret when its current land cover is known.
For a presentation or worksheet, one large map plus one supporting map is usually clearer than shrinking all four onto a single page. A discussion of urban concentration can pair the impervious map with the general land-cover map. A river and habitat discussion can pair the forest-and-farmland view with the general map. A long-term comparison can place the change map next to whichever present-day map best explains the current condition.
Download the four original JPG maps
The download package contains one JPG for each of the four map views shown in this article: 2025 land cover, forest and farmland, impervious surface and developed land, and 1985–2025 class differences. The files can be used independently, so a reader does not have to keep all four together when a single topic is being explained.
Important limits before using the maps for decisions
These maps are designed for county-scale comparison, not parcel-level legal decisions. A forest class does not identify ownership, an agriculture class does not establish farmland protection status, and a developed class does not determine zoning or building rights. Likewise, impervious cover can indicate where hard surfaces are concentrated without identifying whether a site is residential, commercial, industrial, or public.
Small features can also be generalized by a satellite-based land-cover product. Narrow roads, small ponds, isolated buildings, and thin strips of vegetation may be mixed with neighboring cover in a map cell. Water and wetland appearance may vary with season and water level. For flood regulation, wetland jurisdiction, construction permits, or current parcel conditions, use current agency records and site-specific information in addition to these maps.
Frequently Asked Questions
What is the largest land-cover class in Rock Island County?
Agriculture is the largest 2025 class at 54.66%. Developed land is second at 18.95%, followed by forest at 15.81%. That combination is why the county map looks different from a purely rural county: a large metropolitan belt sits within a landscape that is still mostly agricultural by area.
Why is developed land 18.95% while highly impervious land is only 5.68%?
Developed land can include permeable surfaces such as lawns, trees, yards, and open space around buildings. The 5.68% figure refers only to areas where impervious cover reaches at least 50%, so it identifies the harder-surfaced part of the developed landscape rather than the entire developed class.
Does the 11.43% class difference mean that 11.43% of the county was developed after 1985?
No. Only 2.31% is specifically mapped as changed to developed, while 7.50% falls in the other-class-difference category. The comparison also carries a classification-variation warning, so the map is best used to locate areas for further review rather than as a direct measurement of one kind of land conversion.
Map File Information
Download four original JPG maps covering Rock Island County land cover, agriculture and forest, impervious surface, and mapped class differences.
- Included Files: Use only the versions confirmed in the article and supplied images
- File Type: Use the confirmed download contents
- Intended Use: Printing, education, presentations, and map-based projects
Related Maps
- Adams County Illinois Land Cover Map
- Alexander County Illinois Land Cover Map
- Bond County Illinois Land Cover Map
Sources and References
- MRLC Annual NLCD Data
- USGS Annual NLCD Land Cover Classification
- U.S. Census Bureau TIGER/Line Shapefiles
- Rock Island County Comprehensive Plan 2020
- Rock Island County Forest Preserve District – District Information
- Illiniwek Forest Preserve
Green Map creates custom-edited map images using open geographic data sources such as geoBoundaries, Natural Earth, OpenStreetMap, and government open data.
These maps are edited visual materials, not raw data files, and are provided for education, documents, presentations, and graphic reference.