Richland County, Illinois is mostly agricultural in the 2025 land-cover data, but the county is not a single uninterrupted farm surface. A large developed cluster near Olney, East Fork Lake just to the north, wooded patches toward the east and southeast, and wet areas near water create several clearly different landscapes within the same county outline.
The page includes four complementary views: current land cover, forest and farmland, impervious surface and developed land, and mapped class differences from 1985 to 2025. The four original JPG maps are available together in one download, while the WebP images in the article are intended for on-screen viewing.
Table of Contents
Olney and East Fork Lake provide the clearest visual reference
The most obvious non-farm feature on the county map is the dense developed area near the middle of Richland County. The county courthouse and county offices are in Olney, so this central concentration provides a useful geographic reference even though the land-cover map itself does not draw municipal boundaries. Immediately north of that built cluster, a large blue water body with wetland and forest around its edges stands out against the surrounding agricultural land.
Illinois Department of Natural Resources identifies East Fork Lake as a 935-acre lake in Richland County about one mile north of Olney. That verified location matches the prominent water feature north of the central developed area. The lake makes a useful place to compare several classes at once: open water occupies the center, wetlands fringe parts of the shoreline, forest appears around portions of the basin, and agriculture becomes dominant again farther away.
Richland County’s own zoning memorandum lists five incorporated municipalities: Olney, Noble, Parkersburg, Calhoun, and Claremont. Smaller developed patches appear away from the main Olney cluster, which is consistent with a county that has more than one incorporated settlement. Because the map does not label those communities, however, each small red patch should not be assigned to a specific municipality without another reference map.
A 73.98% farm landscape still has strong local contrasts
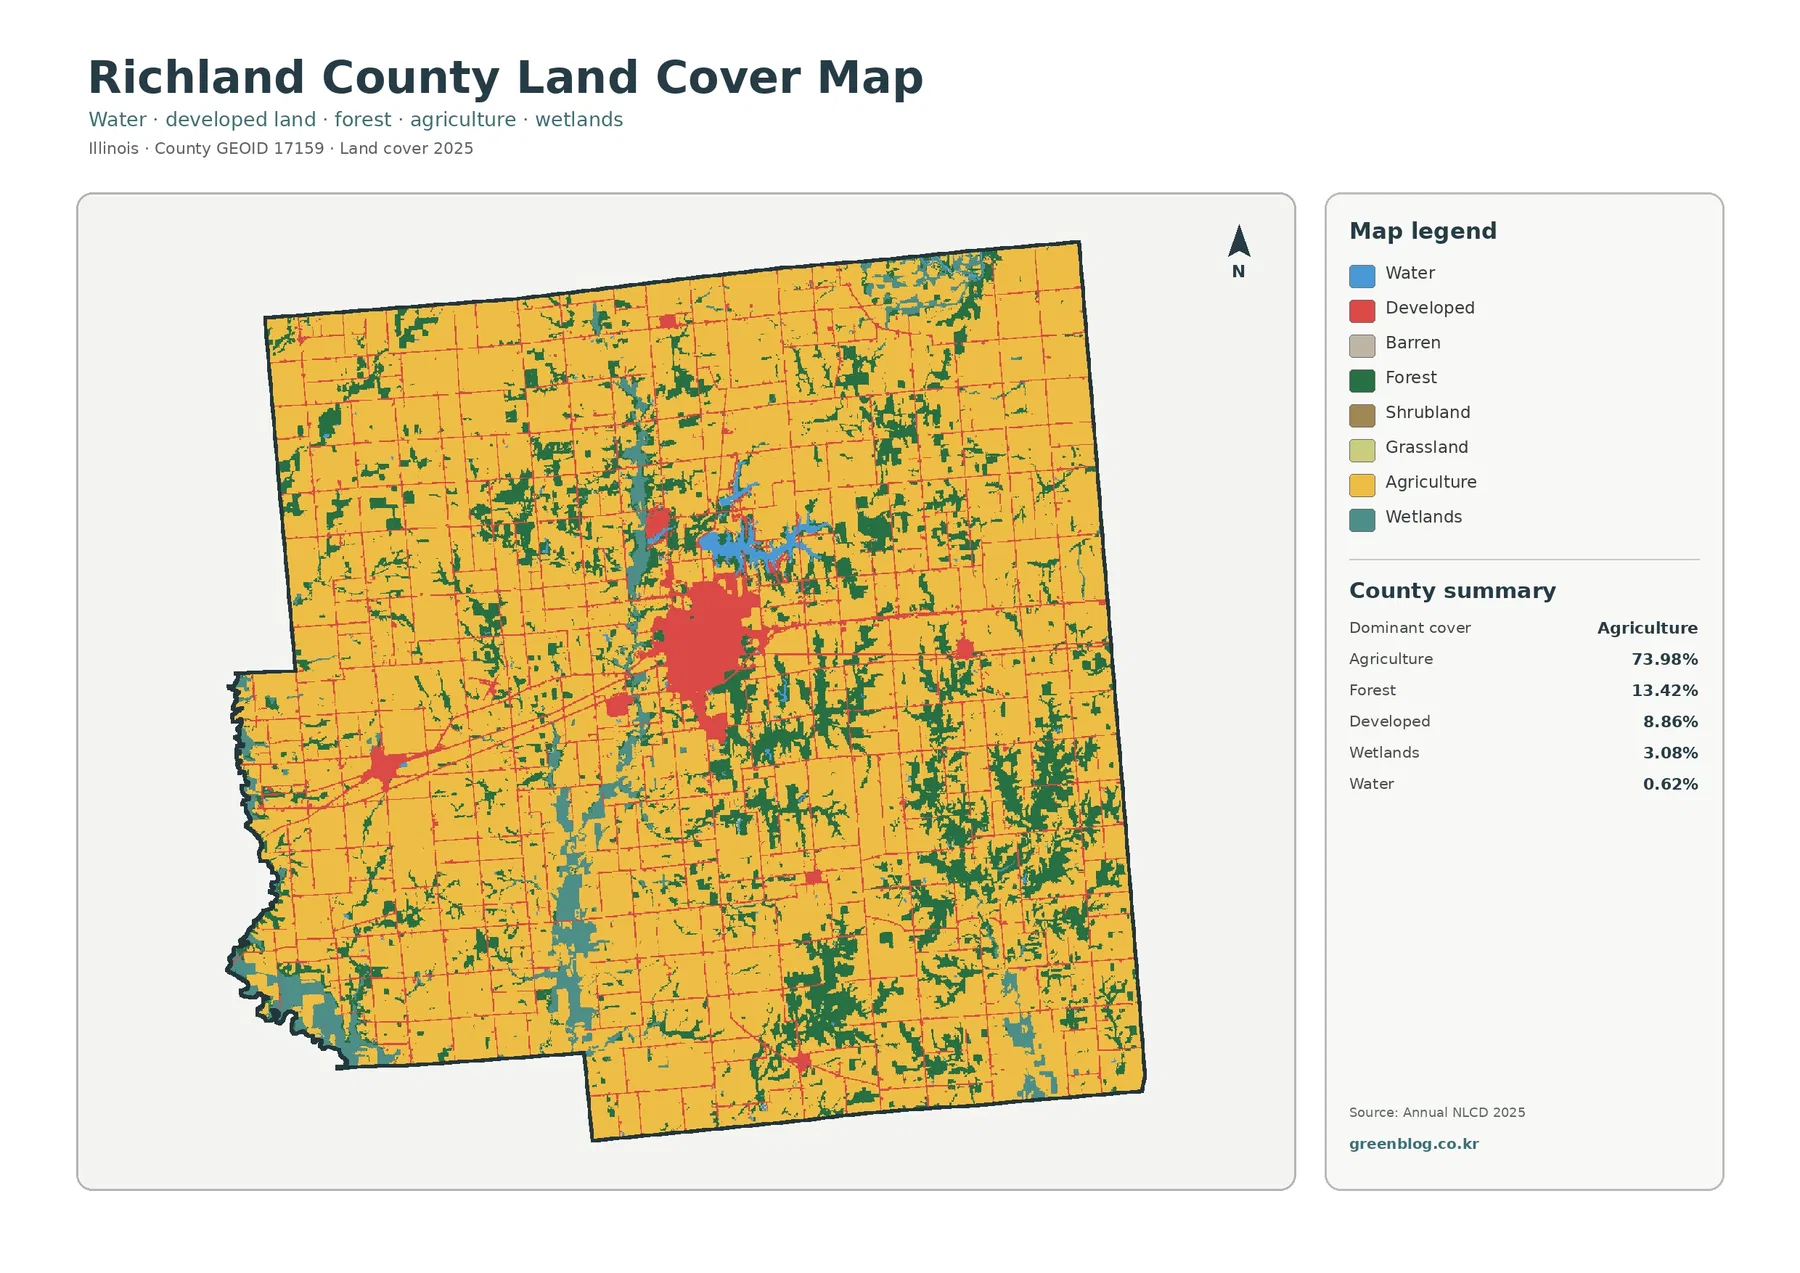
Agriculture accounts for 73.98% of the 2025 summary, making it the dominant class by a wide margin. Forest covers 13.42%, developed land 8.86%, wetlands 3.08%, and water 0.62%. Grassland is only 0.04%, while shrubland is reported as 0.00% in the supplied summary. These percentages explain the broad yellow background of the map, but they do not show where the smaller classes are concentrated.
Farmland fills much of the north, east, and south in large blocks, yet dark green forest repeatedly interrupts those fields. The eastern and southeastern parts of the county contain some of the larger wooded patches. Smaller forest strips also occur in the north and around drainage features. Wetlands are especially noticeable near East Fork Lake and along parts of the southwestern edge, even though their countywide share is much smaller than agriculture or forest.
Developed land is unevenly distributed. Olney forms the largest red cluster, while smaller red areas and thin linear features occur elsewhere. This matters when using the map for a county profile: saying that developed land is 8.86% is accurate, but it would be misleading to picture that 8.86% as evenly spread. Much of the county remains lightly developed agricultural land, with the built cover concentrated in a few places.
Forest is most informative when viewed against the farm pattern
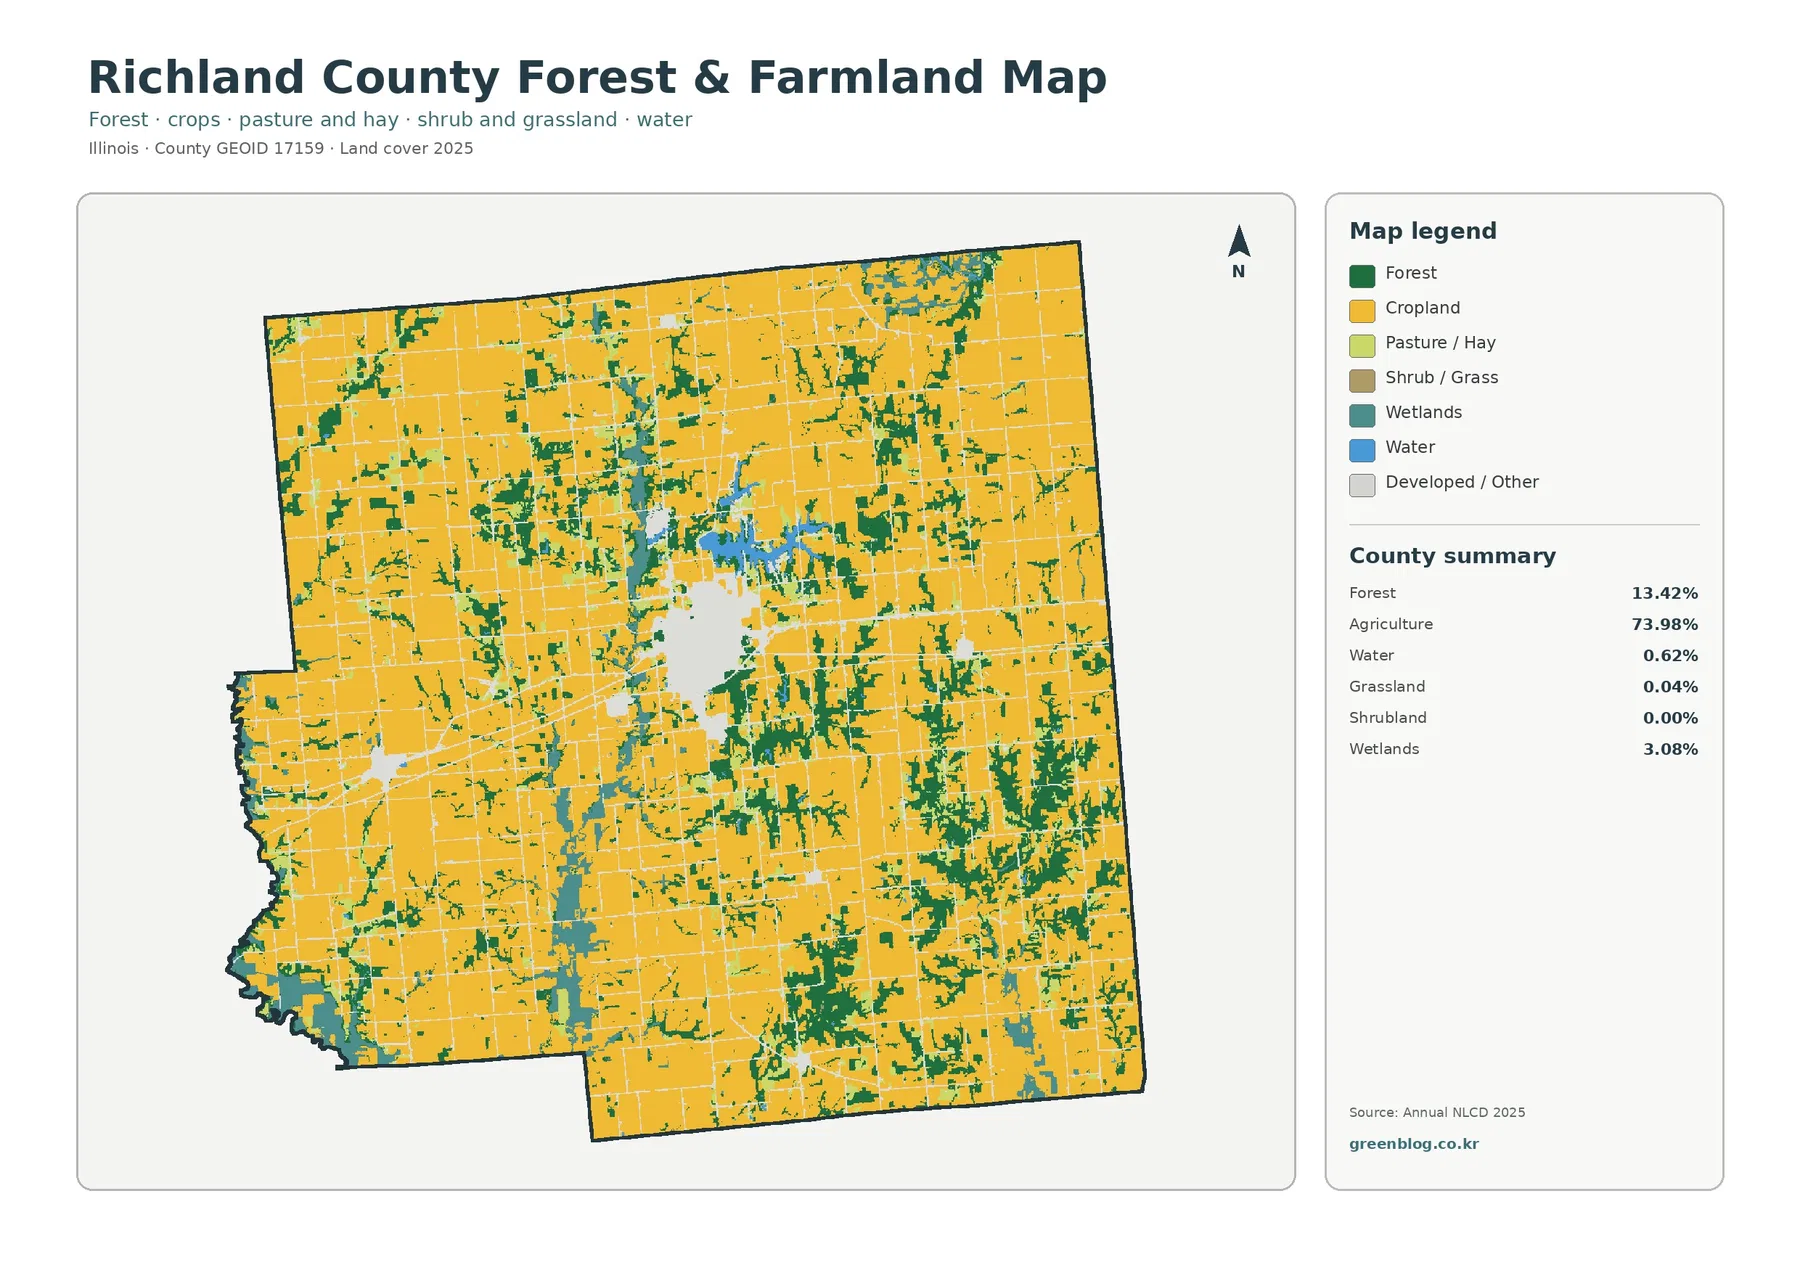
The forest-and-farmland view removes much of the visual competition from developed classes and makes the 73.98% agriculture versus 13.42% forest relationship easier to see. Cropland forms large, regular expanses through most of Richland County. Forest is less extensive, but it is not confined to one corner. It appears in larger patches toward the east and southeast and in narrower pieces scattered through the central and northern portions of the county.
The pattern is useful because forest percentage alone does not describe fragmentation. Some wooded areas form broad blocks, while others follow narrow shapes between fields or near water. Those smaller pieces can be visually important even though they contribute less area. In a classroom or county comparison, this view makes it easier to discuss how a heavily agricultural county can still contain a meaningful network of wooded land.
Wetlands occupy 3.08% of the county and become easier to recognize in this simplified palette. They are especially visible around East Fork Lake and in parts of the southwest. Water is only 0.62%, so most blue areas are compact rather than widespread. Grassland at 0.04% and shrubland at 0.00% are too small to define the county’s overall character, and they should not receive the same emphasis as agriculture, forest, development, wetlands, and water.
The 1985–2025 comparison is mostly a map of class differences, not a development rate
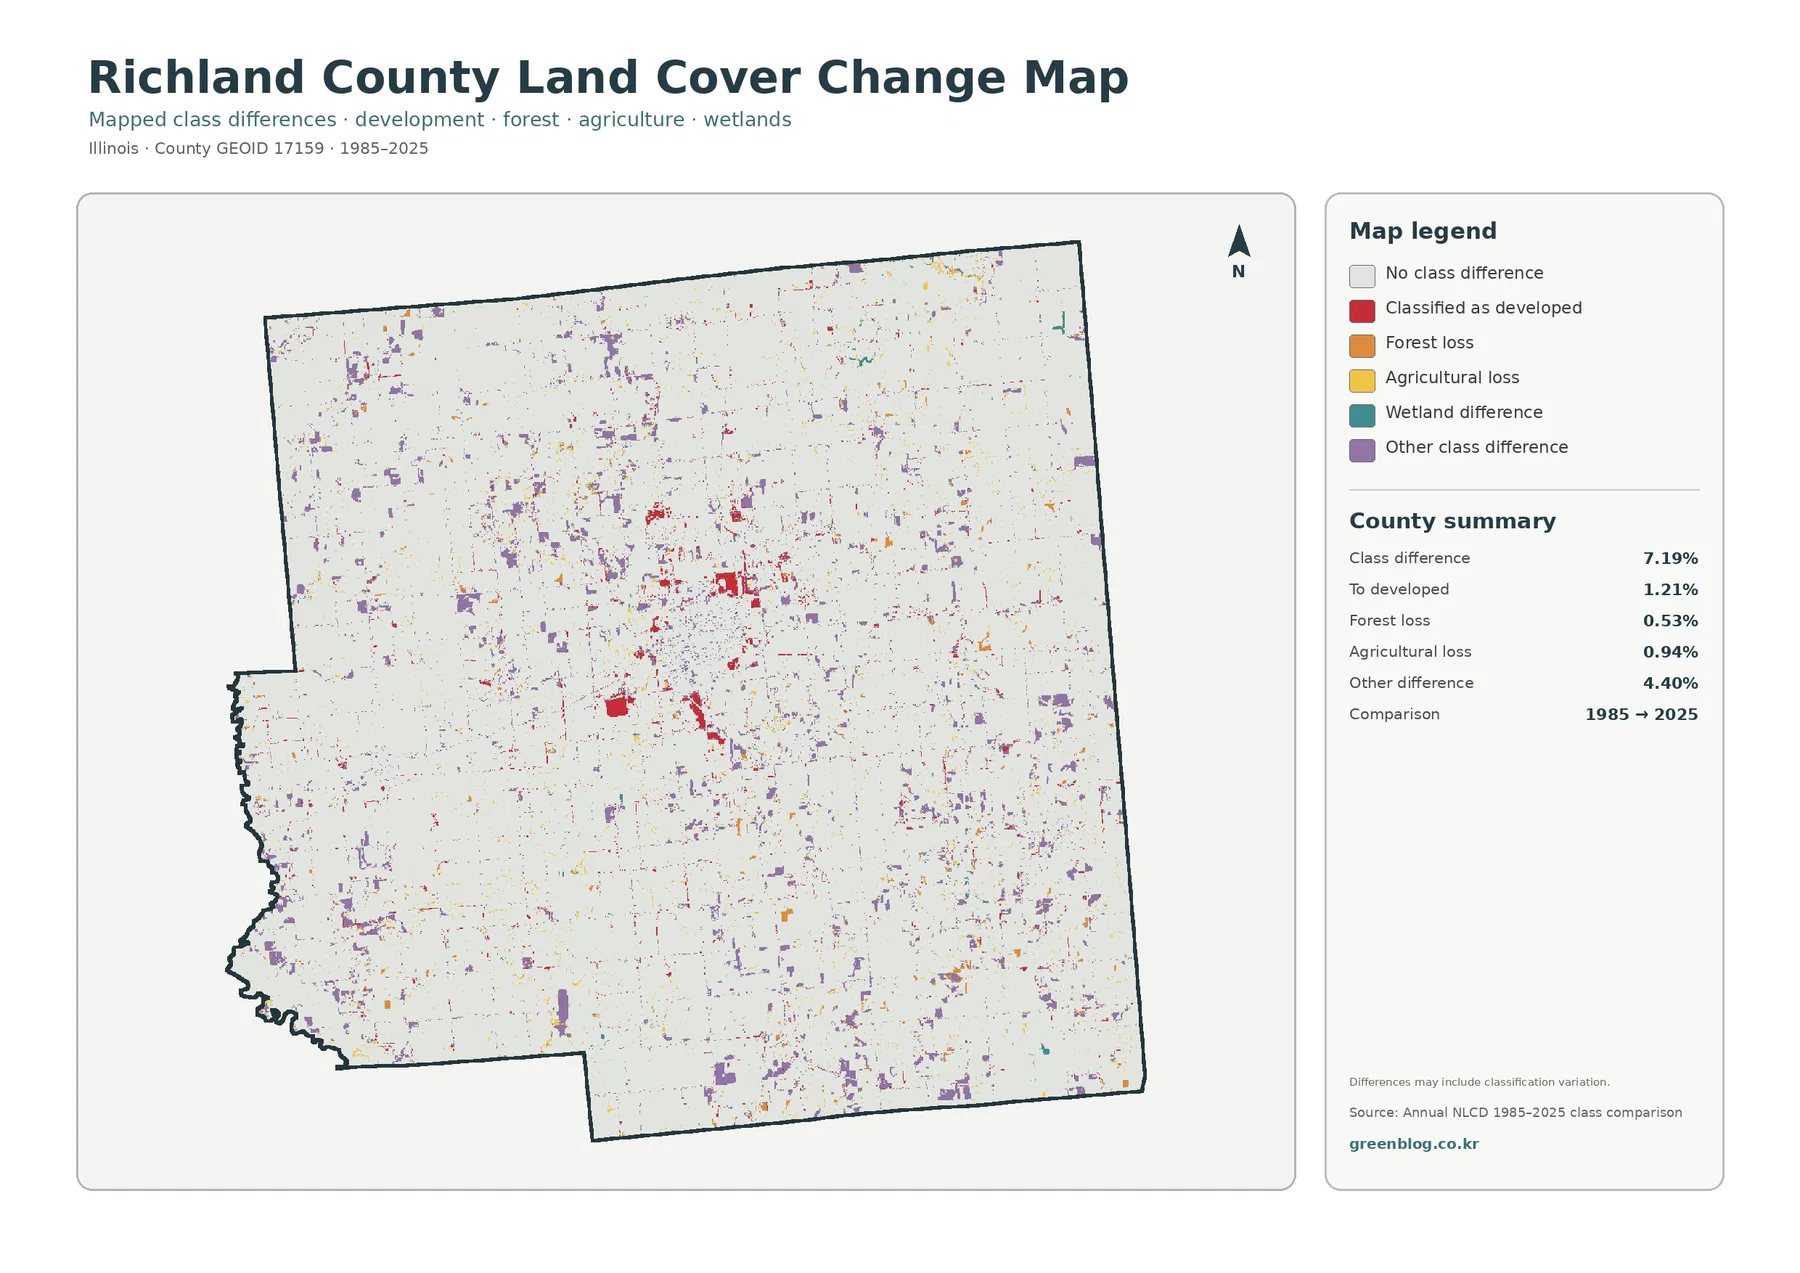
The supplied change summary reports class differences across 7.19% of Richland County between 1985 and 2025. Areas classified as developed account for 1.21%, mapped forest loss for 0.53%, agricultural loss for 0.94%, and other class differences for 4.40%. The legend also includes wetland differences, but the package does not provide a separate percentage for that category, so no additional value should be inferred.
Other class difference is the largest named component of the 7.19% total. Purple pixels are scattered across much of the county rather than forming one continuous zone. Red developed differences are more concentrated near the central built area and along a number of narrow or clustered features. Orange forest-loss and yellow agricultural-loss marks appear in smaller amounts. The map therefore does not support treating 7.19% as the share of the county that was newly developed.
Annual NLCD is a raster product at 30-meter resolution. Each cell represents a classified surface rather than a parcel survey, and a cell can contain a mixture of crops, trees, roads, yards, or other surfaces. Classification can also vary between years. A mapped difference may correspond to real land change, but it can also reflect mixed pixels or classification behavior. Site-specific change should be checked with aerial imagery or local records before drawing a firm conclusion.
Impervious cover separates Olney’s hard surfaces from the wider developed class
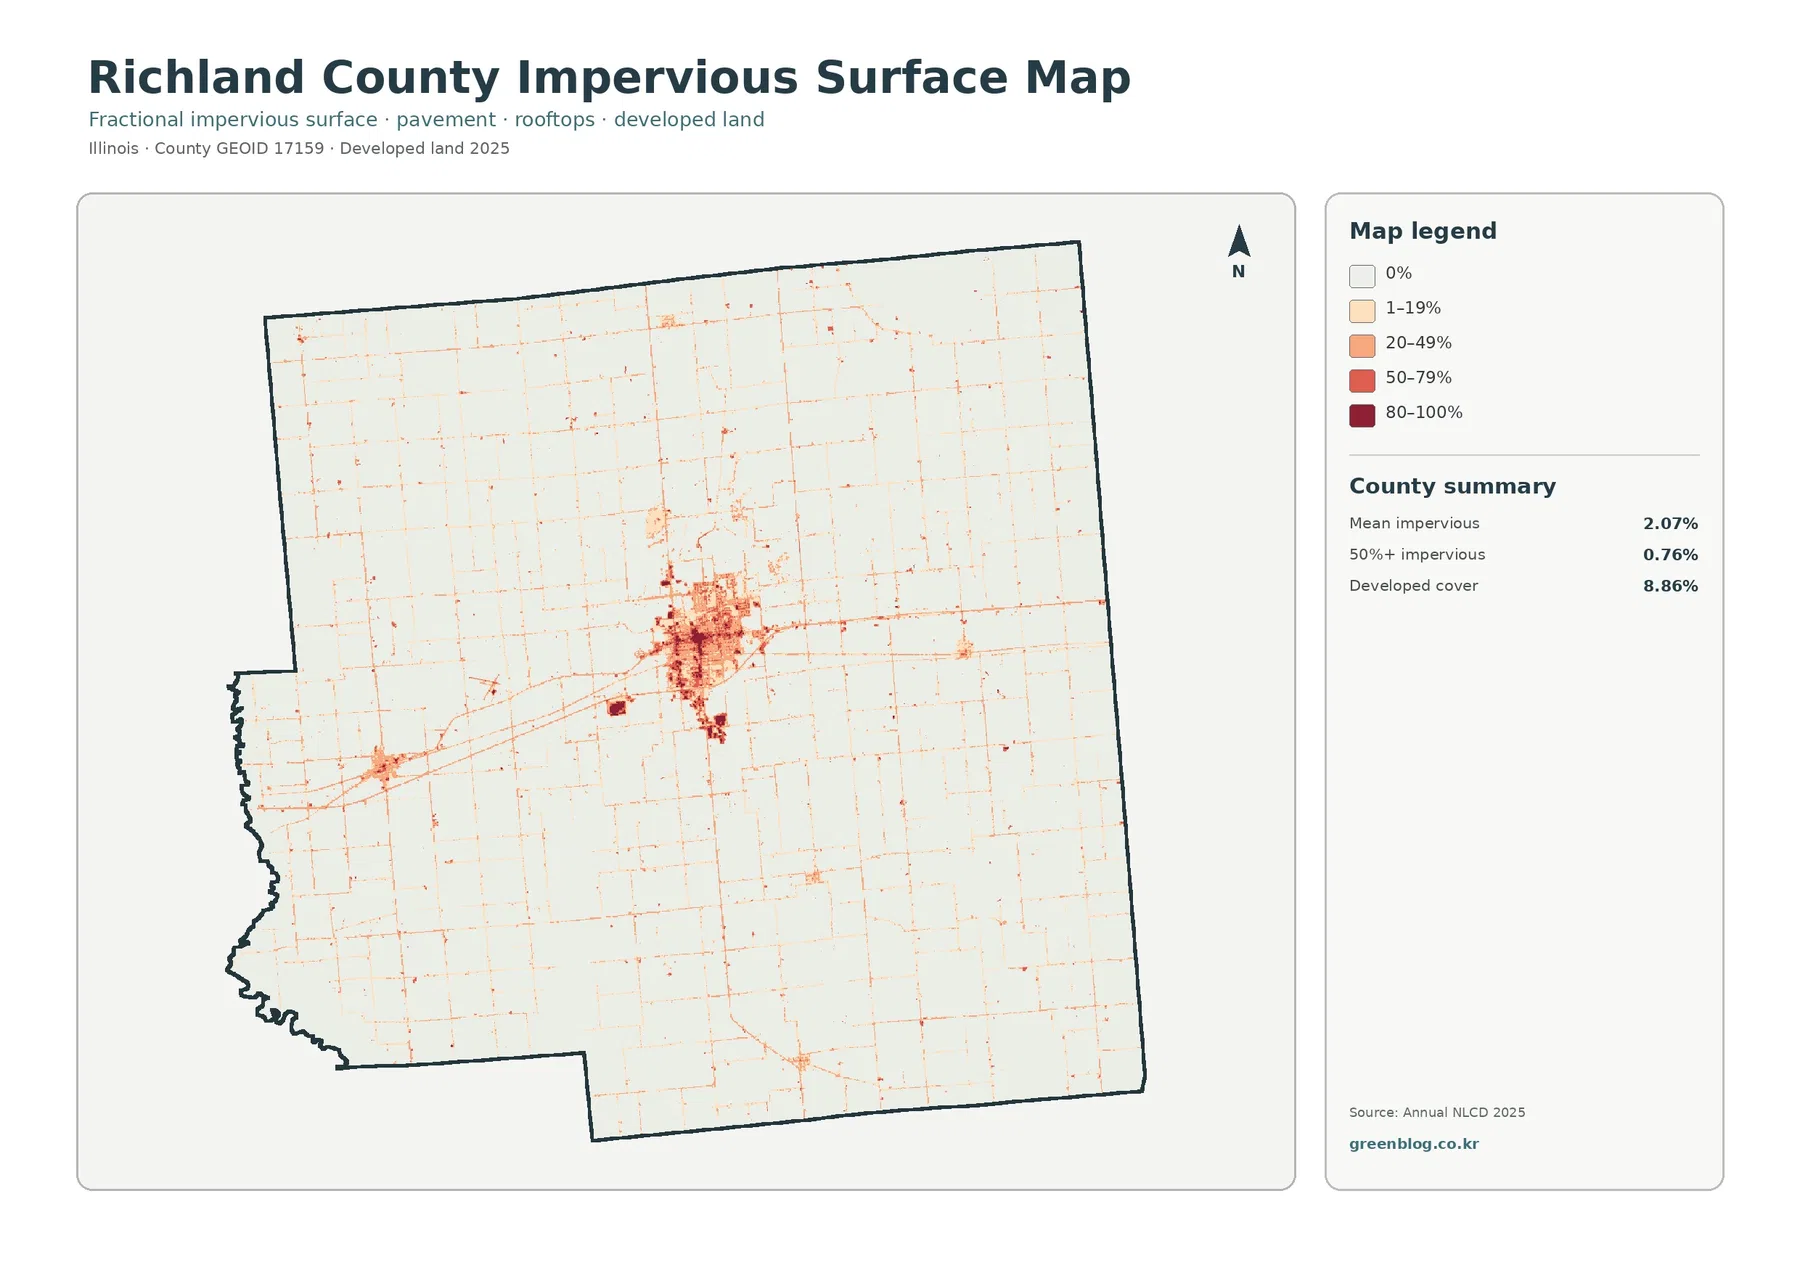
Impervious surface means pavement, rooftops, parking areas, and similar surfaces that do not readily absorb water. Richland County’s mean impervious value is 2.07%, and only 0.76% of the county is mapped at 50% impervious or higher. Those values are much lower than the 8.86% developed-land share because developed classes can include lawns, trees, soil, and other permeable surfaces around buildings and roads.
The darkest impervious colors are concentrated around Olney. Thin orange and red lines extend outward along transportation routes, while smaller clusters appear elsewhere in the county. Large farm areas stay very light. This view is useful when the question is not simply where development exists, but where hard surfaces are most concentrated within that developed footprint.
The impervious map should not be used as a flood map. A high percentage of hard surface can influence how rainfall moves across the ground, but actual flooding depends on topography, drainage infrastructure, soil, rainfall, stream conditions, and other factors. Around East Fork Lake, for example, this map can identify nearby hard surfaces, but it cannot tell a reader whether a particular road, neighborhood, or property will flood.
The southwest edge and eastern woods prevent the county average from telling the whole story
Richland County’s western and southwestern outline contains irregular bends rather than a simple rectangle. Near that edge, the land-cover map shows more frequent combinations of forest, wetlands, and small water features within the agricultural background. The northern part of the county looks different because broad agricultural blocks are more continuous. Both areas belong to a county with 73.98% agriculture, yet their local patterns are not interchangeable.
The east and southeast provide another contrast. Large farm areas remain common, but forest patches are more prominent and form some of the county’s strongest green concentrations. Moving from the Olney area toward those wooded sections changes the visual balance from built land and nearby water to agriculture mixed with more forest. This makes the four-map set useful for regional comparisons within one county rather than only county-to-county comparisons.
A map-based presentation can use these contrasts as three reference areas: the Olney–East Fork Lake area, the more continuous agricultural areas, and the more wooded east or southeast. That approach is more informative than repeating the countywide percentages in every section. It also gives readers a practical way to orient themselves without adding place names that are not printed on the land-cover artwork.
Which of the four maps should be used for a specific question?
For a general county profile, the 2025 land-cover map is the best starting point because it keeps agriculture, forest, development, wetlands, and water in one view. If the subject is the relationship between fields and woods, the forest-and-farmland map removes distractions and makes that contrast clearer. The impervious map is the better choice for discussing hard surfaces around Olney and along transportation lines. The change map belongs in any discussion that compares 1985 with 2025.
East Fork Lake is a good example of why map choice matters. The general land-cover view shows the lake, wetlands, forest, agriculture, and nearby development together. The forest-and-farmland view simplifies the surrounding landscape, while the impervious view shows which nearby developed surfaces are actually hard. The change map asks a different question entirely: which cells received a different class in the two comparison years.
For print or presentation use, one large map usually communicates more clearly than four reduced maps placed side by side. The downloadable JPGs are 2480×1754 pixels each, larger than the article previews, but image dimensions should not be confused with source-data detail. Enlarging the JPG does not reveal parcel boundaries or information finer than the underlying 30-meter classification.
What these land-cover maps can and cannot answer
Land cover describes what is physically covering the surface, such as crops, forest, water, wetlands, or developed material. It is not the same as zoning, ownership, legal land use, or building permission. A cell classified as agriculture does not prove that a parcel is legally restricted to farming, and a wetland-colored cell is not by itself a regulatory wetland determination.
This distinction is especially relevant in Richland County. A county memorandum states that the unincorporated portions of Richland County do not have a general county zoning ordinance, while separate rules address matters such as solar-farm development, floodplain construction, setbacks, subdivisions, and trailer parks. The land-cover maps cannot substitute for any of those rules. Current legal questions should be checked with the county or municipality.
The maps also represent specific dates. The current land-cover and impervious views use 2025 data, while the change map compares 1985 with 2025. Construction or vegetation change after the mapped year may not appear. Richland County provides GIS and map resources on its official website, which can be used alongside these land-cover images when more current administrative or road information is needed.
Frequently Asked Questions
What is the largest land-cover class in Richland County?
Agriculture is the largest 2025 class at 73.98%. Forest follows at 13.42%, while developed land covers 8.86%. The county is therefore strongly agricultural, but the Olney area, East Fork Lake, wetlands, and larger forest patches create important local exceptions to the countywide average.
Why does East Fork Lake stand out when water is only 0.62% of the county?
Water occupies a small share of the total county area, but it is concentrated rather than evenly distributed. East Fork Lake forms a large, recognizable water feature just north of Olney, with wetlands and forest around parts of its edge. A small countywide percentage can therefore be visually important when most of that class is clustered in a few places.
Does the 7.19% class-difference total mean 7.19% of Richland County was developed?
No. The mapped total includes several categories. Only 1.21% is identified as classified to developed, while other class difference is 4.40%, forest loss is 0.53%, and agricultural loss is 0.94%. Classification behavior and mixed 30-meter pixels can also contribute to differences, so the total should not be treated as a development rate.
Sources and Reference Data
- MRLC Annual NLCD Data – official access to Annual NLCD products
- USGS Annual NLCD Collection 1.2 – 2025 availability and 30-meter raster product details
- Illinois DNR East Fork Lake – verified Richland County location and lake information
- Richland County, Illinois – official county information, GIS, maps, and administrative resources
- Richland County Zoning Memorandum – county guidance on unincorporated zoning and related ordinances
- U.S. Census Bureau TIGER/Line – county boundary data
Map File Information
Download the four original JPG maps for Richland County to compare 2025 land cover, forest and farmland, impervious surface, and mapped class differences from 1985 to 2025.
- Included Files: Use only the versions confirmed in the article and supplied images
- File Type: Use the confirmed download contents
- Intended Use: Printing, education, presentations, and map-based projects
Related Maps
- Adams County Illinois Land Cover Map
- Alexander County Illinois Land Cover Map
- Bond County Illinois Land Cover Map
Green Map creates custom-edited map images using open geographic data sources such as geoBoundaries, Natural Earth, OpenStreetMap, and government open data.
These maps are edited visual materials, not raw data files, and are provided for education, documents, presentations, and graphic reference.