Moultrie County is overwhelmingly agricultural on the 2025 land-cover map, but the southwest corner breaks that pattern with the open water, wooded shoreline, and wetlands of the Lake Shelbyville area. Agriculture accounts for 82.05% of the mapped cover, followed by developed land at 7.60%, forest at 6.31%, water at 2.58%, and wetlands at 1.34%. The four maps on this page separate those current cover patterns from hard-surface development and long-term class differences.
The WebP images are convenient for on-page viewing, while the four original JPG maps are available together in the download box below. Use the general map for the countywide pattern, the forest-and-farmland view for the Lake Shelbyville edge, the impervious map for Sullivan and roads, and the change map when the question is how 1985 and 2025 classifications differ.
Table of Contents
A farm landscape with one unmistakable water-and-woods contrast
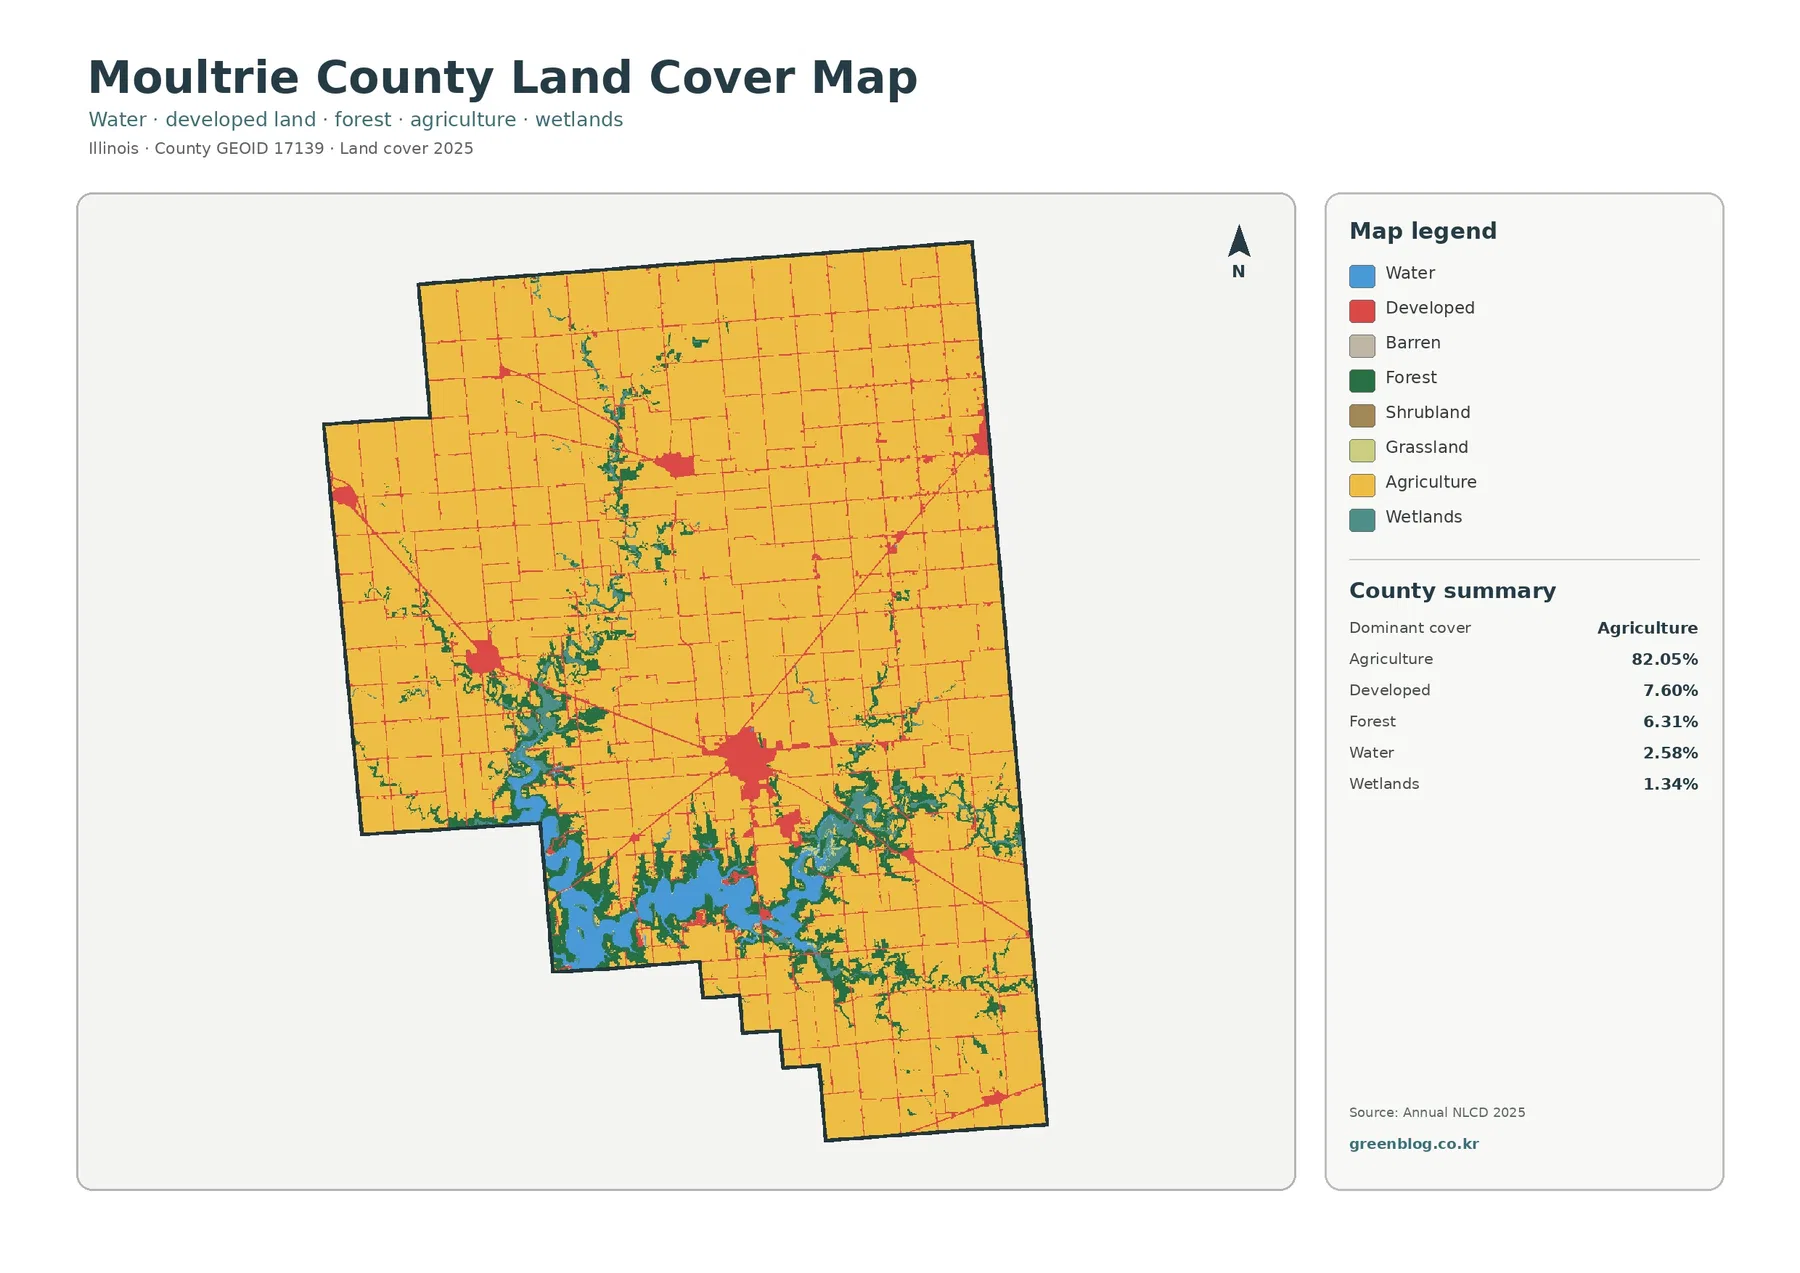
The first impression is a broad sheet of agricultural cover. Yellow fills most of northern, eastern, and central Moultrie County, with straight road lines crossing the fields and small developed patches interrupting them. At 82.05%, agriculture is not merely the largest class; it is the background against which every other feature is read. The most substantial developed cluster sits near the middle-south portion of the county and aligns with the Sullivan area, which the Illinois State Archives identifies as the county seat.
That farm dominance also has an independent agricultural context. The USDA 2022 Census of Agriculture county profile lists corn for grain and soybeans among Moultrie County’s leading crops by acreage. Those agricultural census acres are not the same measurement as Annual NLCD land-cover pixels, so the figures should not be combined. They do, however, help explain why the broad agricultural classification fits a county where row-crop farming is an important part of the landscape.
Move southwest and the map becomes much more varied. A large blue water body pushes into the county, dark green forest wraps around irregular shorelines, and teal wetlands appear in several adjoining pockets. Illinois Department of Natural Resources material places Lake Shelbyville in both Moultrie and Shelby counties and notes that the reservoir extends through the upper reaches near Sullivan and Bethany. That makes the southwest water complex a useful local reference rather than an anonymous blue patch on the map.
Water and wetlands make up only a small share of the county when measured as percentages, yet their location gives them much more visual importance. Water is 2.58% and wetlands 1.34%, but much of that cover is concentrated in the same southwestern area. This creates a sharp contrast with the northeast, where fields continue with few large interruptions. It is a good reminder that a county summary explains quantity, while the map explains where that quantity is located.
Lake Shelbyville turns a simple farm map into a patchwork of habitats
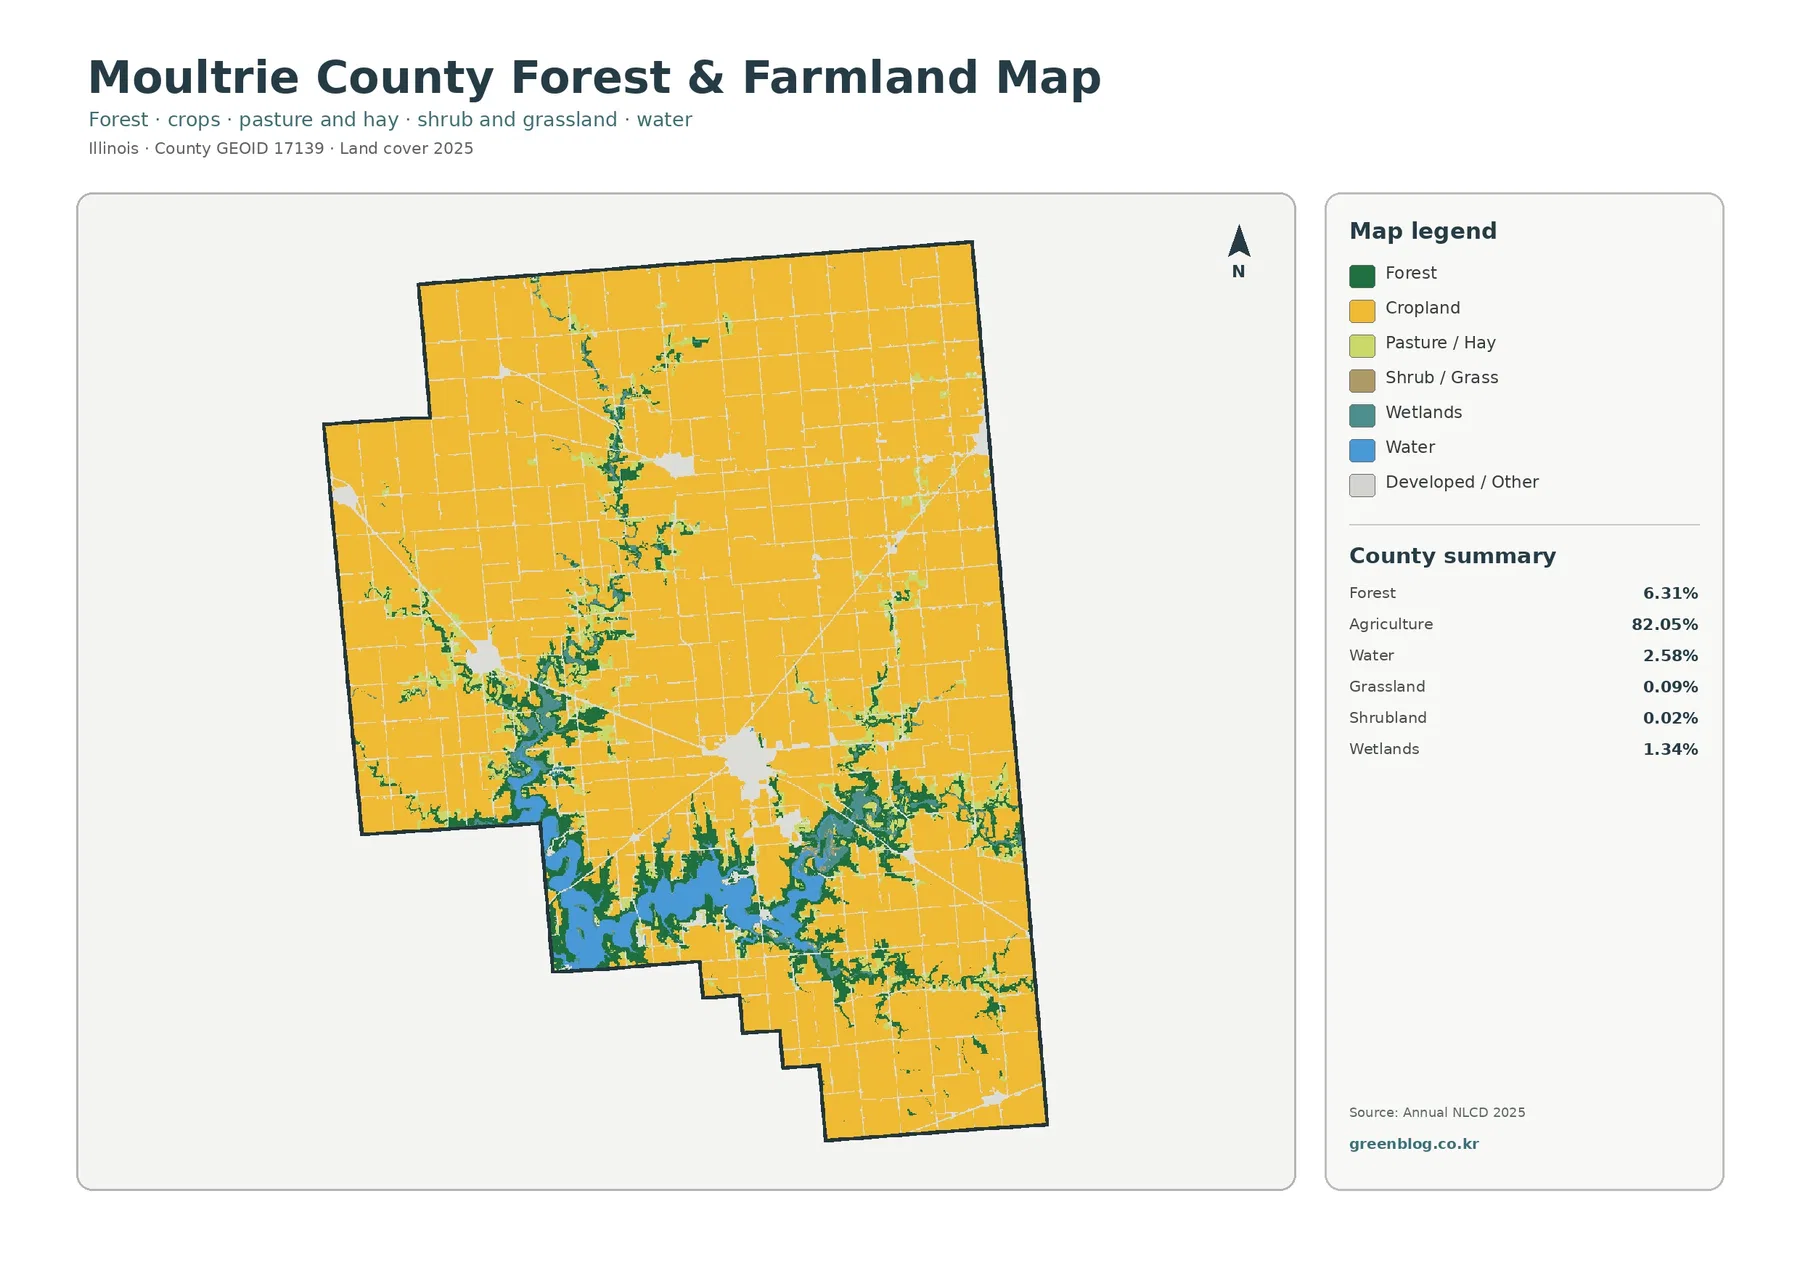
Removing the red developed class from the visual competition makes the southwest especially easy to read. Cropland still covers most of Moultrie County, but forest becomes a clear set of narrow fingers and shoreline bands rather than a countywide blanket. The largest connected wooded areas are tied to the Lake Shelbyville side of the county. Smaller green branches extend northward through the center and appear again in several eastern pockets.
The lake area is not just water bordered by one continuous forest strip. Blue coves and arms are separated by irregular green land, teal wetland pockets sit along some edges, and cropland resumes beyond those natural-cover zones. Illinois DNR describes the upper Lake Shelbyville project area as a mixture of forest, restored grassland, old fields, wetlands, rivers, streams, and cropland. That description matches the visual complexity of this part of the county without requiring the map to identify every habitat individually.
Forest accounts for 6.31% of the 2025 summary, so it is far smaller than agriculture in total area. Even so, the forest is geographically meaningful because it is clustered rather than evenly sprinkled. A narrow green corridor runs from the central part of the county toward the north, and more branches appear around the lake and toward the east. When a presentation needs to explain where wooded land persists inside a heavily farmed county, this map is more useful than a single percentage.
Grassland and shrubland are present in the legend but barely register in the county totals: 0.09% for grassland and 0.02% for shrubland. They should not be given the same editorial weight as agriculture, forest, water, or wetlands. On this particular county map, the strongest story is the contrast between broad cropland and the more diverse cover around Lake Shelbyville, not an attempt to build a long discussion around classes that occupy very little mapped area.
Sullivan becomes the clearest center when hard surfaces are isolated
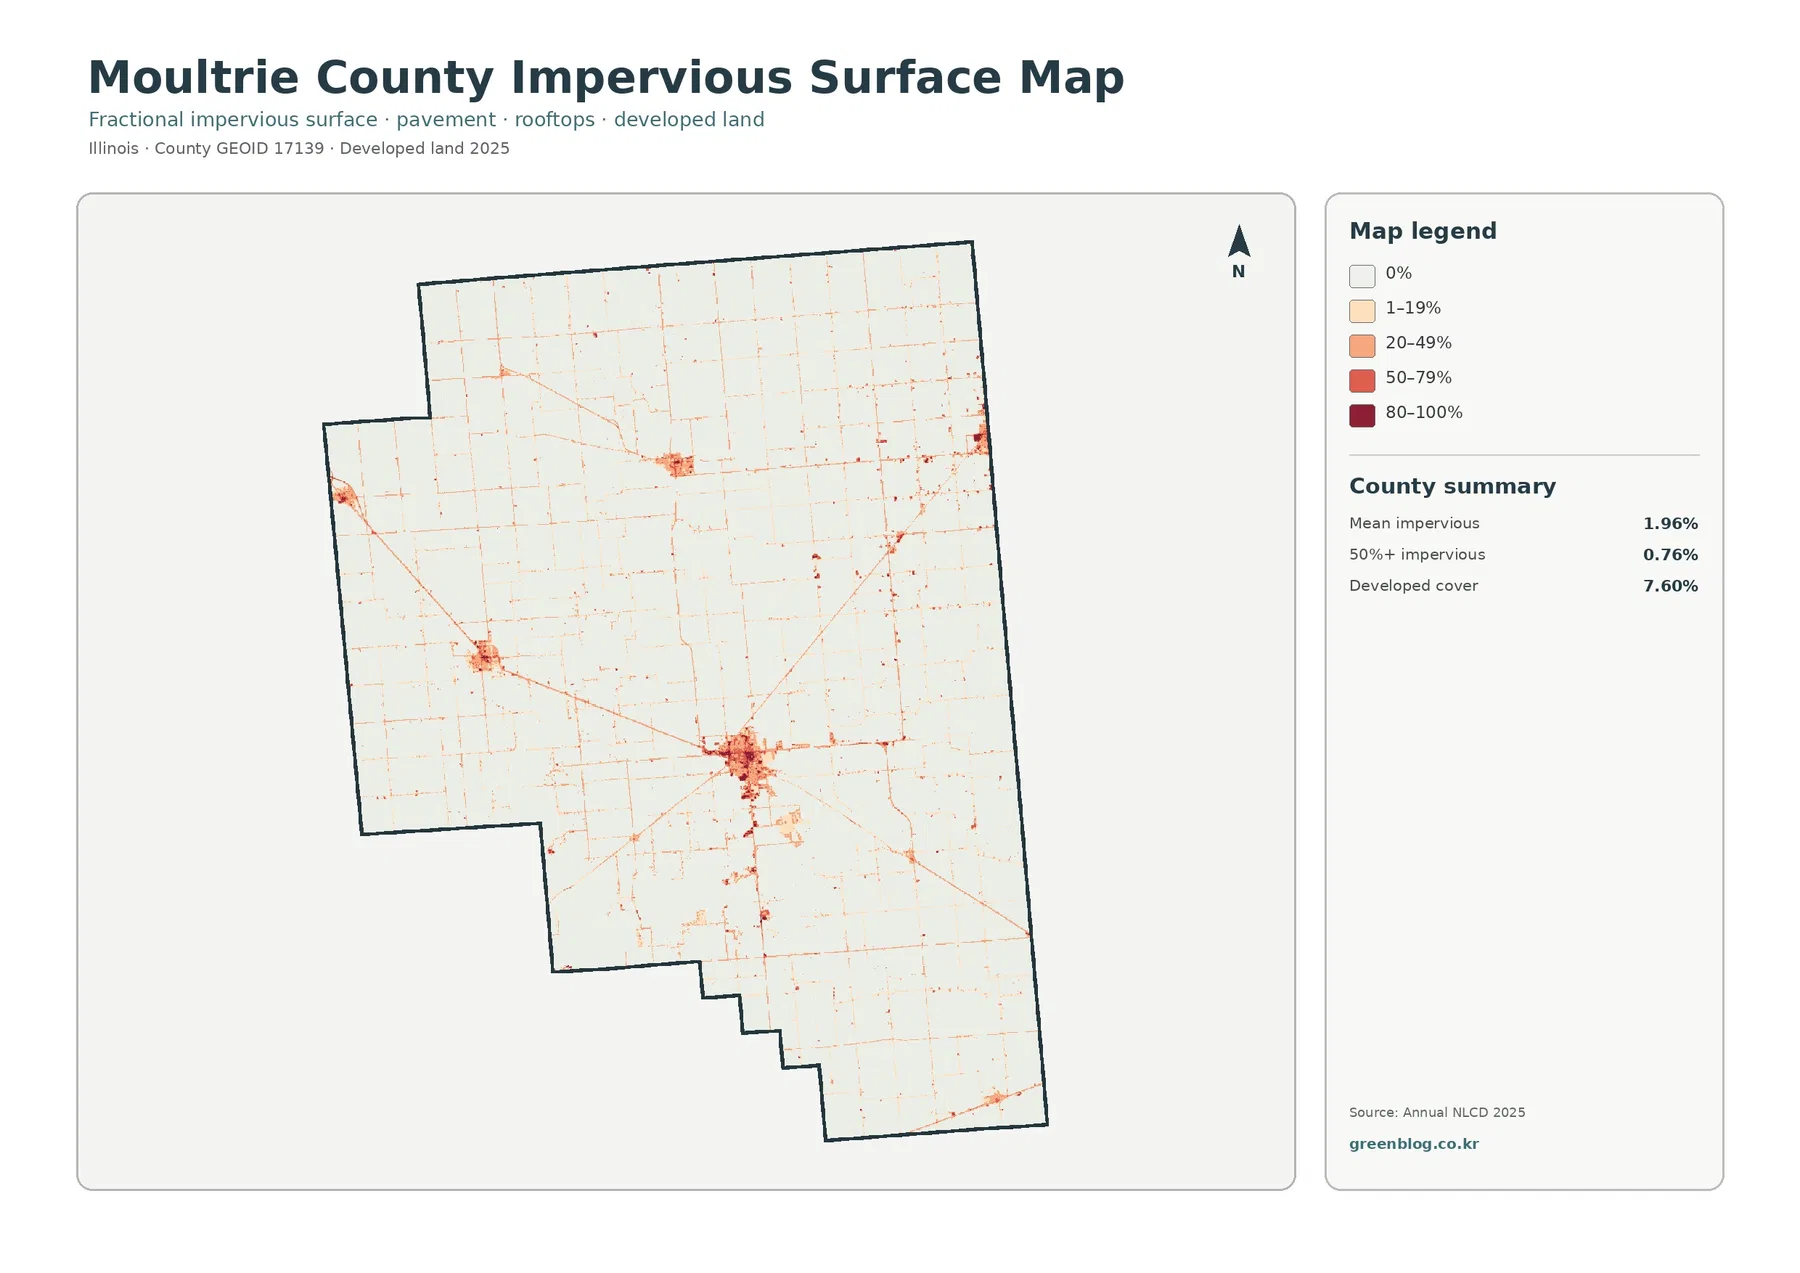
An impervious surface is a hard surface such as pavement, rooftops, or parking areas where water does not soak directly into the ground. Moultrie County’s mean impervious value is 1.96%, and 0.76% of the county is mapped above the 50% impervious level. Those figures are lower than the 7.60% developed-cover total because the two products measure different things. A developed land class may include lawns, trees, and other permeable ground, while the impervious map focuses on the fraction of hard surface within each mapped cell.
Sullivan is the most prominent cluster once the agricultural and forest colors are stripped away. The central-southern built area forms a compact concentration, with thin road lines extending outward in several directions. Smaller clusters appear to the west, north, and along the eastern side, but none occupies as much area. Across the farm interior, the road grid remains visible as fine lines rather than large blocks, which separates rural transportation surfaces from the county’s main built-up center.
This view is useful when the goal is not simply to label developed land but to distinguish the intensity of hard surfaces. A pale road crossing cropland is very different from a darker urban cell where roofs, streets, and parking surfaces occupy much more space. Sullivan shows that difference clearly. The map does not, however, measure stormwater problems or flood risk by itself. Drainage infrastructure, rainfall, soil, slope, and nearby water levels would all be needed for that kind of assessment.
The Lake Shelbyville side is a useful comparison. It looks visually complicated on the general land-cover map, yet most of it is light on the impervious map because water, forest, wetlands, and fields are not hard urban surfaces. Roads and small facilities can still appear as narrow or localized marks. Placing these two maps side by side helps prevent a common mistake: a place can have many land-cover classes without being highly developed.
The 1985–2025 map records limited, mixed class differences
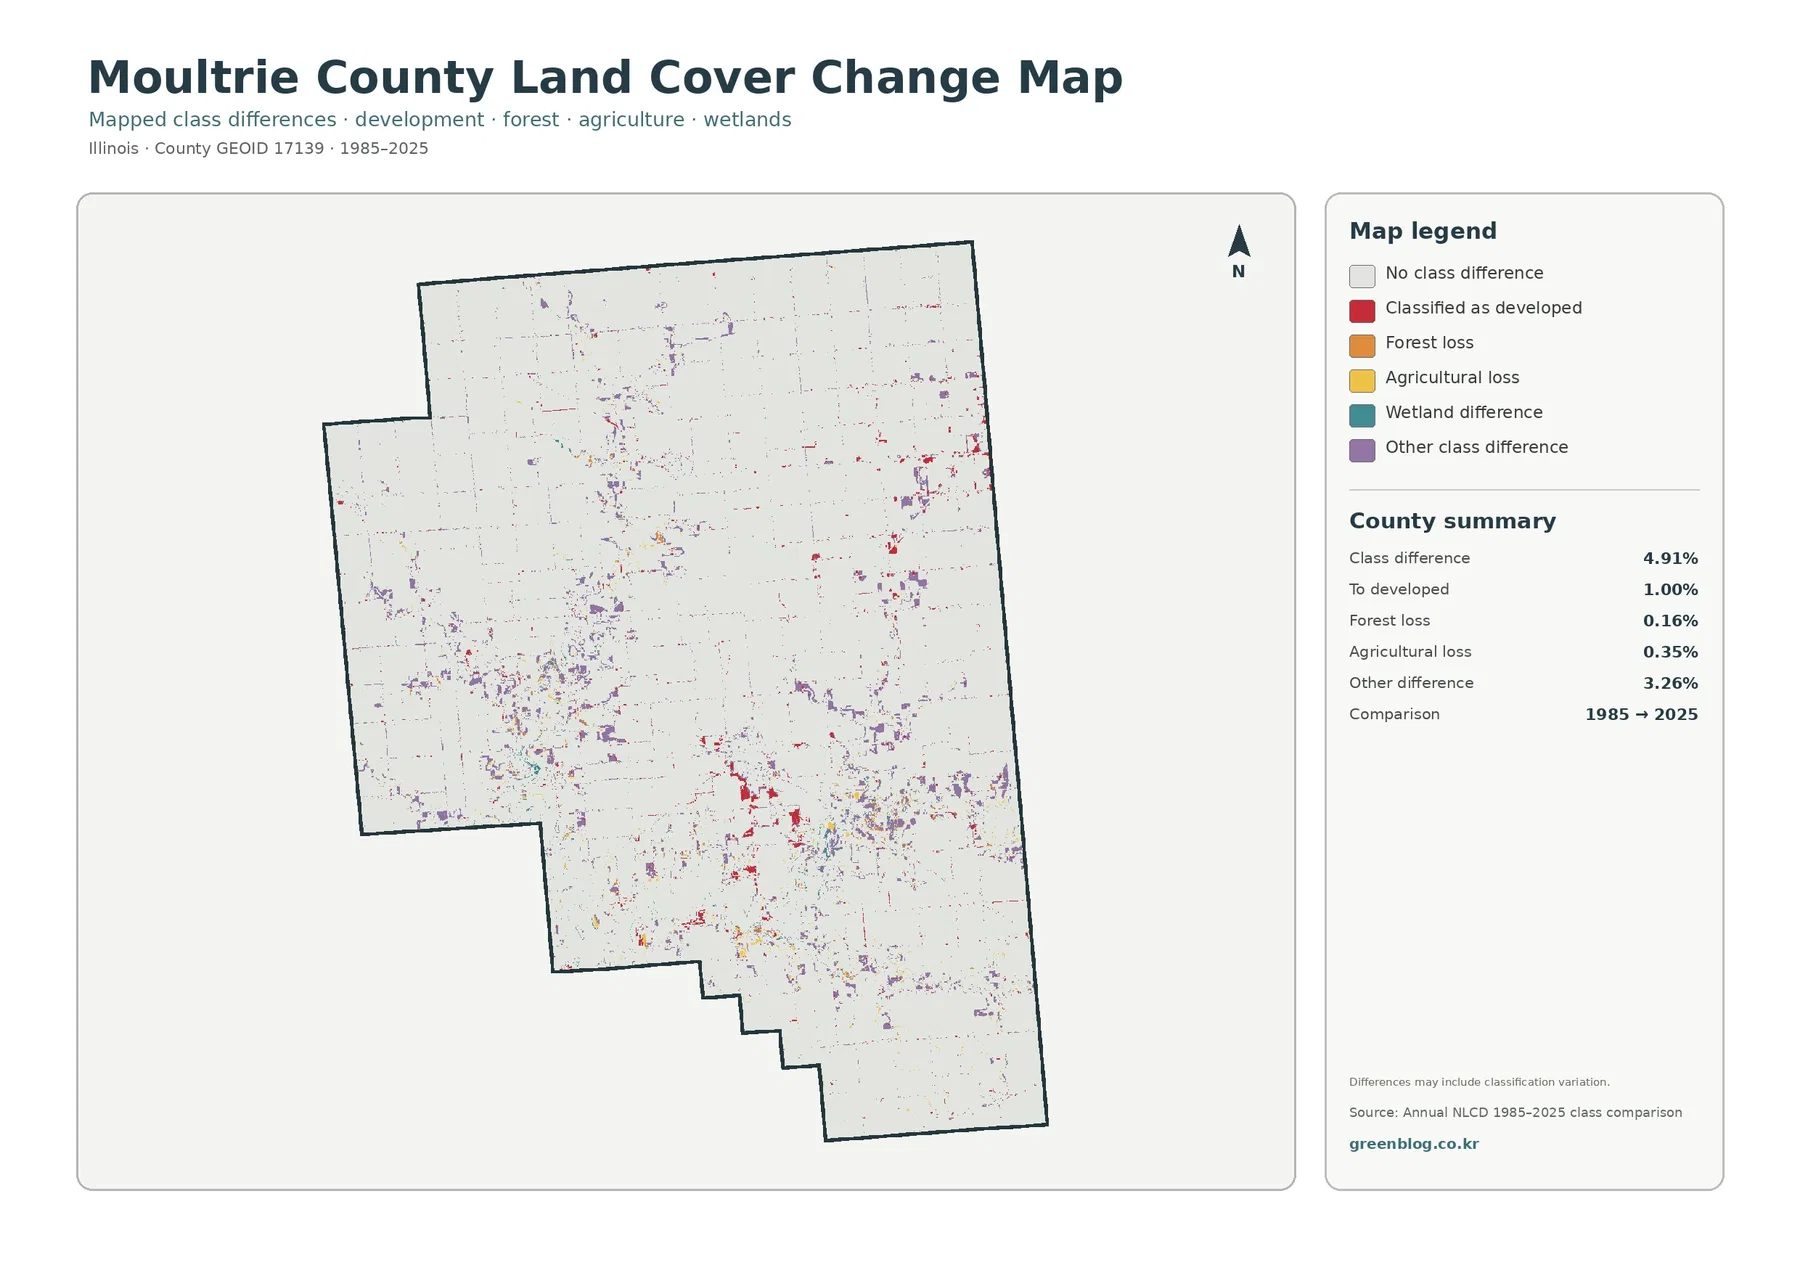
The change view is best read as a class-difference map rather than a simple map of development. Across Moultrie County, 4.91% of the area is shown with a different class between 1985 and 2025. The summary identifies 1.00% as classified to developed, 0.16% as forest loss, 0.35% as agricultural loss, and 3.26% as other class difference. The provided summary does not assign a separate percentage to every legend category, so the remaining classes should be described visually rather than estimated.
Red developed-change marks are most noticeable around the Sullivan area and at several smaller settlement or road-junction locations. They are visible, but they are not the dominant type of difference across the county. Purple other-class differences are more widespread, appearing as scattered patches from the lake region through the central and northern farm landscape. Small orange, yellow, and teal marks occur in more limited places.
The lake and its wooded margins deserve particular caution. Water edges, wetland margins, and narrow forest boundaries put several land-cover types into close contact. Satellite classification can shift along those edges when image date, vegetation condition, water level, or mixed pixels change. A mixed pixel is simply a mapped cell that contains more than one real surface. For that reason, a colored patch on the change map should not automatically be labeled as clearing, construction, or farmland conversion without another source.
There is also a time-scale limitation. The comparison jumps from 1985 to 2025 rather than showing every year in between. It cannot identify whether a change happened early in that forty-year span, very recently, or more than once. Annual NLCD data or historical aerial imagery would be needed to narrow down timing. Used carefully, this map is a strong screening tool for locating areas that deserve a closer look, not a parcel-level history of land use.
Reading the four maps together without confusing cover, use, and ownership
The strongest way to use the set is to keep the questions separate. The 2025 general map asks what currently covers the ground. The forest-and-farmland map simplifies that answer so agriculture and natural cover can be compared. The impervious product asks where hard surfaces are concentrated. The 1985–2025 map asks where two classifications differ. None of them is a zoning map, parcel map, ownership record, or statement about what can legally be built.
For an agricultural presentation, begin with the 82.05% countywide figure and the broad field pattern. The USDA county profile can then supply crop context, such as the large corn and soybean acreages reported in the 2022 agricultural census. Keep those data sources labeled separately: agricultural census acreage and satellite-derived land-cover classes are related to the same landscape but are calculated for different purposes.
For a water or habitat topic, the southwest is the better starting point. The general map shows the full mix of water, wetland, forest, agriculture, and development, while the forest-and-farmland map makes the shoreline pattern easier to follow. Illinois DNR material on Lake Shelbyville adds useful local context because it describes a project area containing forests, wetlands, rivers, streams, grasslands, and cropland. That source-backed context is more informative than treating every green or teal patch as a generic map symbol.
For development, shift attention to Sullivan and compare the red general-map class with the impervious surface values. The two will not match perfectly, and that is expected. Developed land can contain permeable yards and trees, while an impervious percentage responds more directly to hard surfaces. This distinction is especially useful in a county where the built-up footprint is small compared with agriculture but still forms a recognizable center.
Scale and classification limits matter at farm and shoreline edges
Annual NLCD is a raster product, meaning the landscape is represented in a grid of cells rather than legal parcel polygons. Narrow streams, farm lanes, small wooded strips, and individual buildings may be generalized or absorbed into the dominant class of a cell. Along Lake Shelbyville, a single cell can contain water, trees, wet ground, and shoreline, which makes some boundaries appear simpler than they are on the ground.
The same caution applies in farm country. A field edge may include a drainage ditch, grassy margin, small tree line, and road, but the map cannot reproduce each narrow feature as a separate legal boundary. Zooming in on the image does not create new source detail. Parcel decisions, drainage work, site design, or ownership questions require current local records, surveys, or higher-resolution imagery in addition to this countywide land-cover set.
The original JPG files are 2480 by 1754 pixels. They preserve the supplied map detail and are useful when the on-page WebP preview is too small for a legend or fine road line. The asset manifest does not certify them as meeting a full A3 high-resolution reference, so they should be test-printed at the intended size before being used for a large-format handout. The files are provided at their original package resolution rather than artificially enlarged.
Choosing the right JPG for a class, report, or local reference
Choose the general 2025 land-cover map when one image needs to summarize Moultrie County. Choose the forest-and-farmland map when the subject is the contrast between the farm interior and Lake Shelbyville’s wooded and wet margins. The impervious map is the clearest option for Sullivan and the road network. Use the 1985–2025 difference map when a project needs to identify places for further historical review, while keeping the 4.91% total in the context of classification uncertainty.
If all four maps are used, avoid shrinking them into one crowded panel. A more readable sequence is countywide cover first, then the Lake Shelbyville landscape, followed by Sullivan’s impervious pattern and finally the class-difference map. Because every image uses the same county boundary, the reader can return to the same locations and understand why one place looks different under each mapping question.
Frequently Asked Questions
What is the dominant land cover in Moultrie County?
Agriculture is the dominant 2025 cover at 82.05%. Developed land accounts for 7.60%, forest 6.31%, water 2.58%, and wetlands 1.34%. The countywide total is strongly agricultural, but the southwest Lake Shelbyville area concentrates much of the water, woodland, and wetland cover in one visually distinct part of the county.
Why does the Lake Shelbyville part of the county look so different from the northeast?
The southwest contains a large reservoir, wooded shoreline, wetland pockets, and adjoining fields, while much of the northeast is continuous agricultural cover. Illinois DNR describes the upper Lake Shelbyville project area as a mix of forests, wetlands, rivers, streams, grasslands, and cropland, which provides local context for the varied colors seen there.
Does the 4.91% change figure mean that 4.91% of Moultrie County was developed?
No. The map reports 4.91% total class difference between 1985 and 2025, but only 1.00% is categorized as classified to developed. Other class difference is 3.26%, forest loss is 0.16%, and agricultural loss is 0.35%. Some differences can also reflect classification variation, so the total should not be treated as a direct measure of urban growth.
Map File Information
The download contains four original JPG maps for Moultrie County, covering 2025 land cover, forest and farmland, impervious surface/developed land, and 1985–2025 class differences.
- Included Files: Use only the versions confirmed in the article and supplied images
- File Type: Use the confirmed download contents
- Intended Use: Printing, education, presentations, and map-based projects
Related Maps
- Adams County Illinois Land Cover Map
- Alexander County Illinois Land Cover Map
- Bond County Illinois Land Cover Map
Sources and References
- MRLC Annual NLCD Data
- USGS Annual NLCD Land Cover Classification
- U.S. Census Bureau TIGER/Line boundary data
- USDA 2022 Census of Agriculture: Moultrie County Profile
- Illinois DNR: Lake Shelbyville and Shelbyville State Fish and Wildlife Area
- Illinois State Archives: Moultrie County
Green Map creates custom-edited map images using open geographic data sources such as geoBoundaries, Natural Earth, OpenStreetMap, and government open data.
These maps are edited visual materials, not raw data files, and are provided for education, documents, presentations, and graphic reference.