Morgan County is overwhelmingly agricultural in the 2025 land-cover summary, but the map is not a single uninterrupted farm sheet. Agriculture accounts for 78.80% of the county, while forest covers 10.95% and developed land 8.19%. The large developed concentration around Jacksonville, wooded branching corridors in the southern half, and the water-and-wetland edge along the west make the county easier to understand when the four supplied maps are read together.
The WebP images on this page are intended for quick viewing. One ZIP download contains the four original JPG maps: general land cover, forest and farmland, impervious surface and developed land, and mapped 1985–2025 class differences. Start with the general map for the countywide pattern, then switch to the specialized view that matches the question you want to answer.
Table of Contents
A farm-dominated county with three very different visual zones
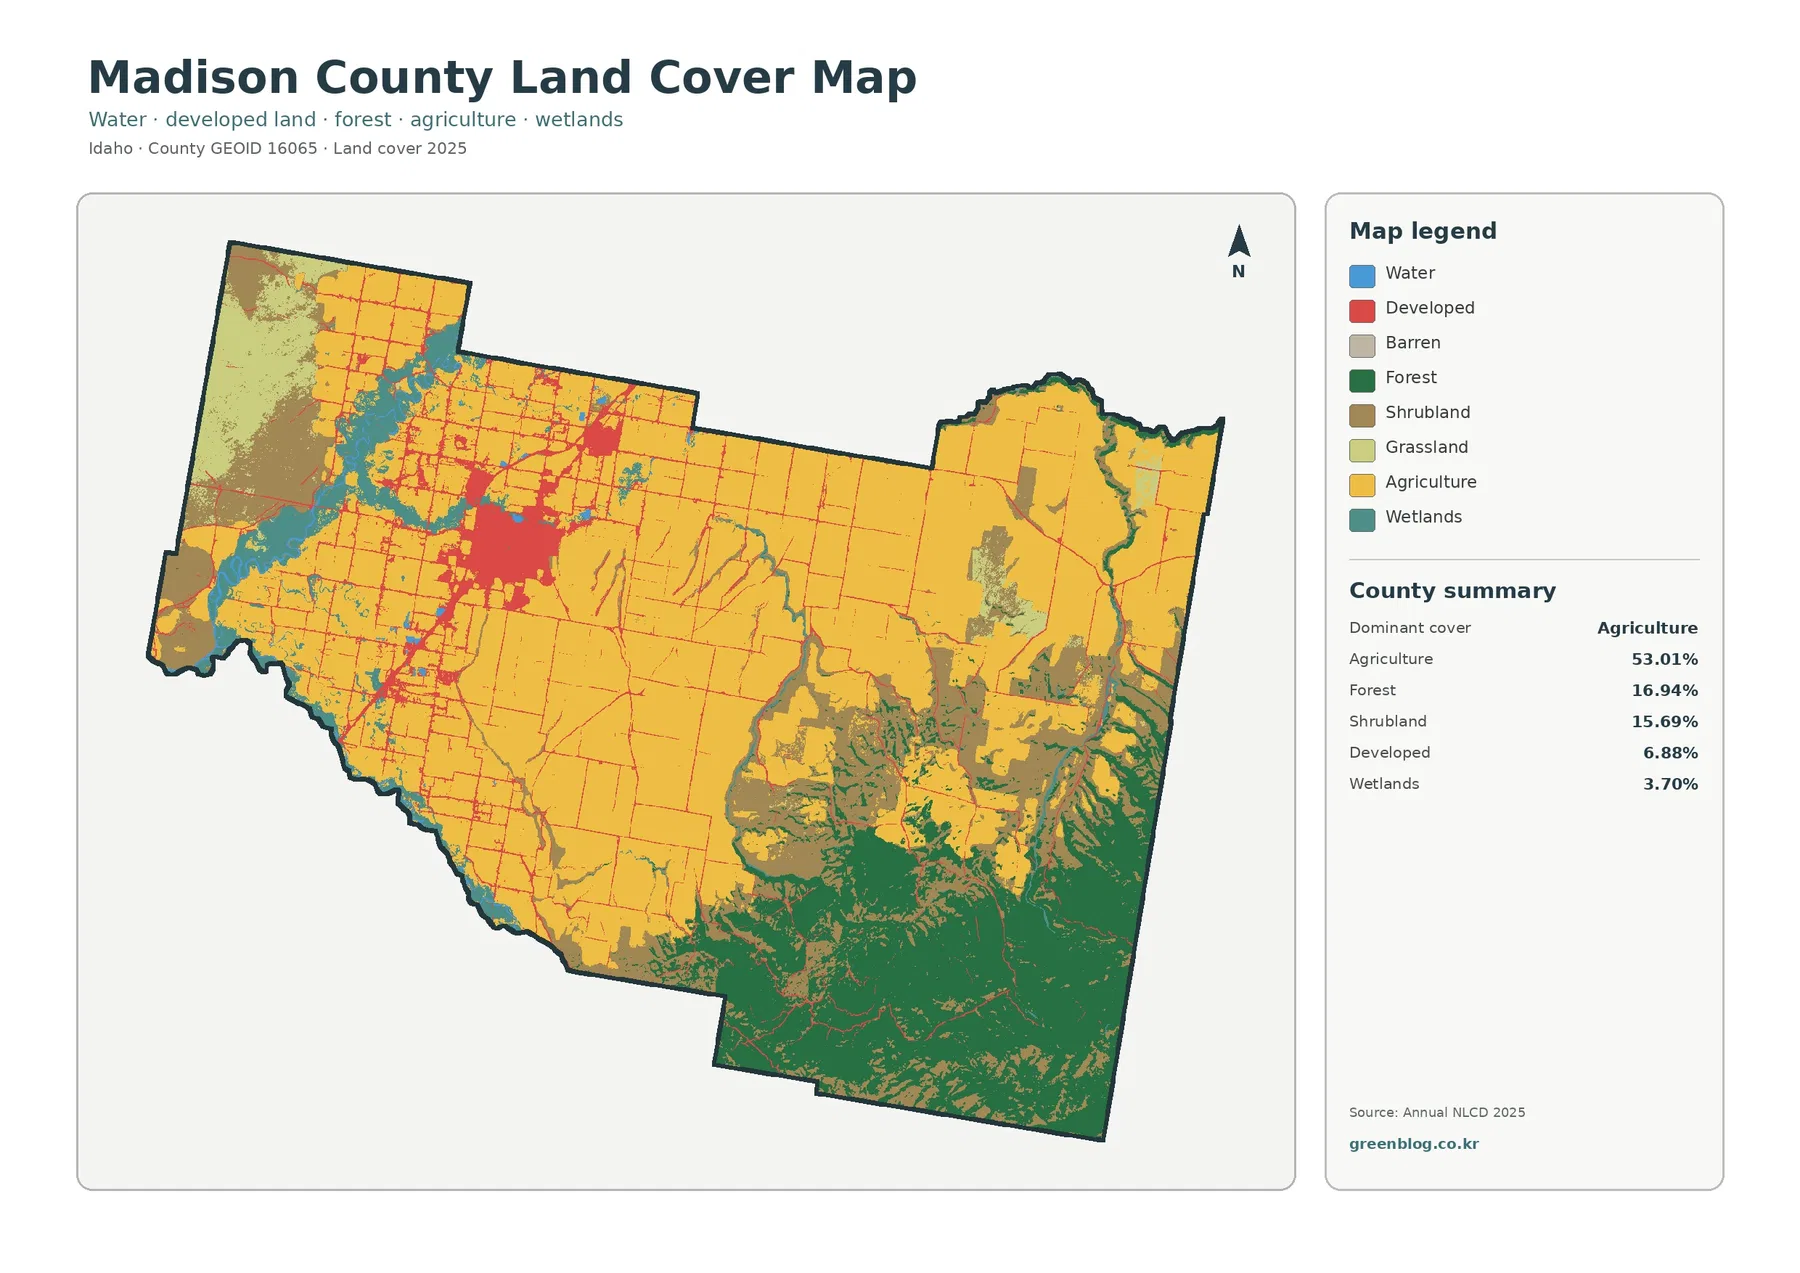
The broad interior is the first thing that stands out. Yellow agricultural cover fills most of northern, eastern, central, and southeastern Morgan County. Long straight edges and a fine road grid cross these farm areas, producing a much simpler texture than the forested corridors. The county is therefore correctly described as agriculture-dominated, but that description misses several strong local contrasts that become clear at full map scale.
Jacksonville forms the largest developed cluster near the center of the county. State and county sources identify Jacksonville as the county seat, and its footprint is much larger on the supplied maps than the smaller built-up places elsewhere in Morgan County. Development spreads outward from the core along several road directions, while isolated smaller clusters appear toward the western edge and in the southern half.
The western projection has a different mix of cover. Morgan County’s official hazard-mitigation plan describes the Illinois River as part of the county’s western boundary. On the land-cover map, water and wetlands become much more visible at that edge, alongside farming and a compact developed area. This narrow river-side section contrasts sharply with the broad agricultural interior and is one of the most useful places to compare all four map products.
The 2025 land-cover map puts 78.80% agriculture in context
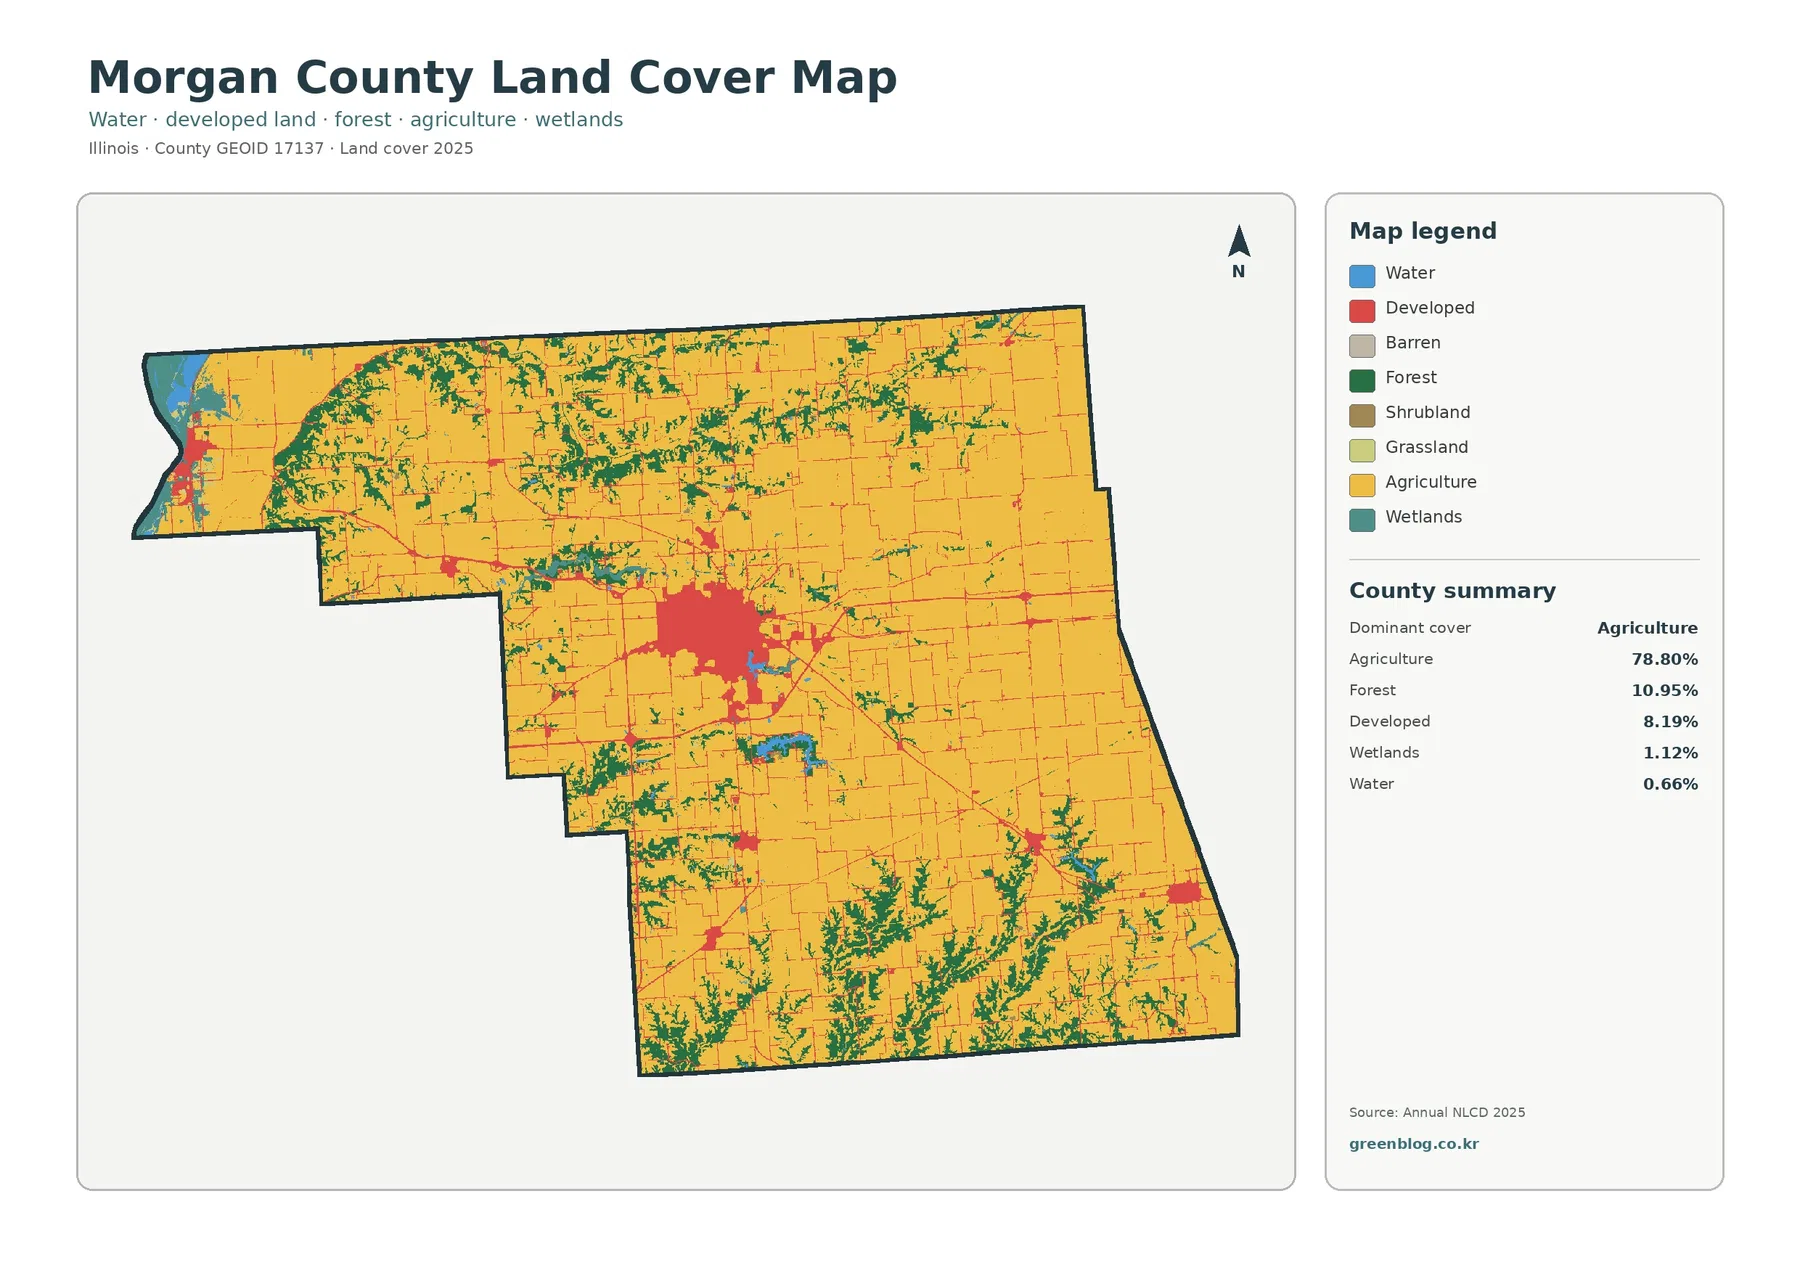
Agriculture at 78.80% is the dominant class by a wide margin. Forest is the second-largest class at 10.95%, and developed land accounts for 8.19%. Wetlands represent 1.12% and water 0.66%. Those last two percentages look small in a countywide summary, yet their western concentration gives them much more geographic importance than the raw percentages alone suggest.
The forest pattern is especially useful for breaking the county into recognizable parts. A broad curved wooded area appears in the northwest, smaller branches cross the north-central interior, and numerous narrow wooded corridors become more common in the south. These southern corridors repeatedly split the agricultural cover instead of forming one continuous forest block. By contrast, much of the northeast and east has larger, simpler agricultural expanses.
Developed land is concentrated rather than evenly distributed. Jacksonville occupies the most prominent red area, with thinner extensions following roads away from the main cluster. Smaller red patches appear at several distant points. The developed category should not be read as a legal city boundary, zoning district, or parcel designation. It is a land-cover classification that can include combinations of buildings, pavement, lawns, and other altered surfaces.
Forest and farmland become clearer when development is simplified
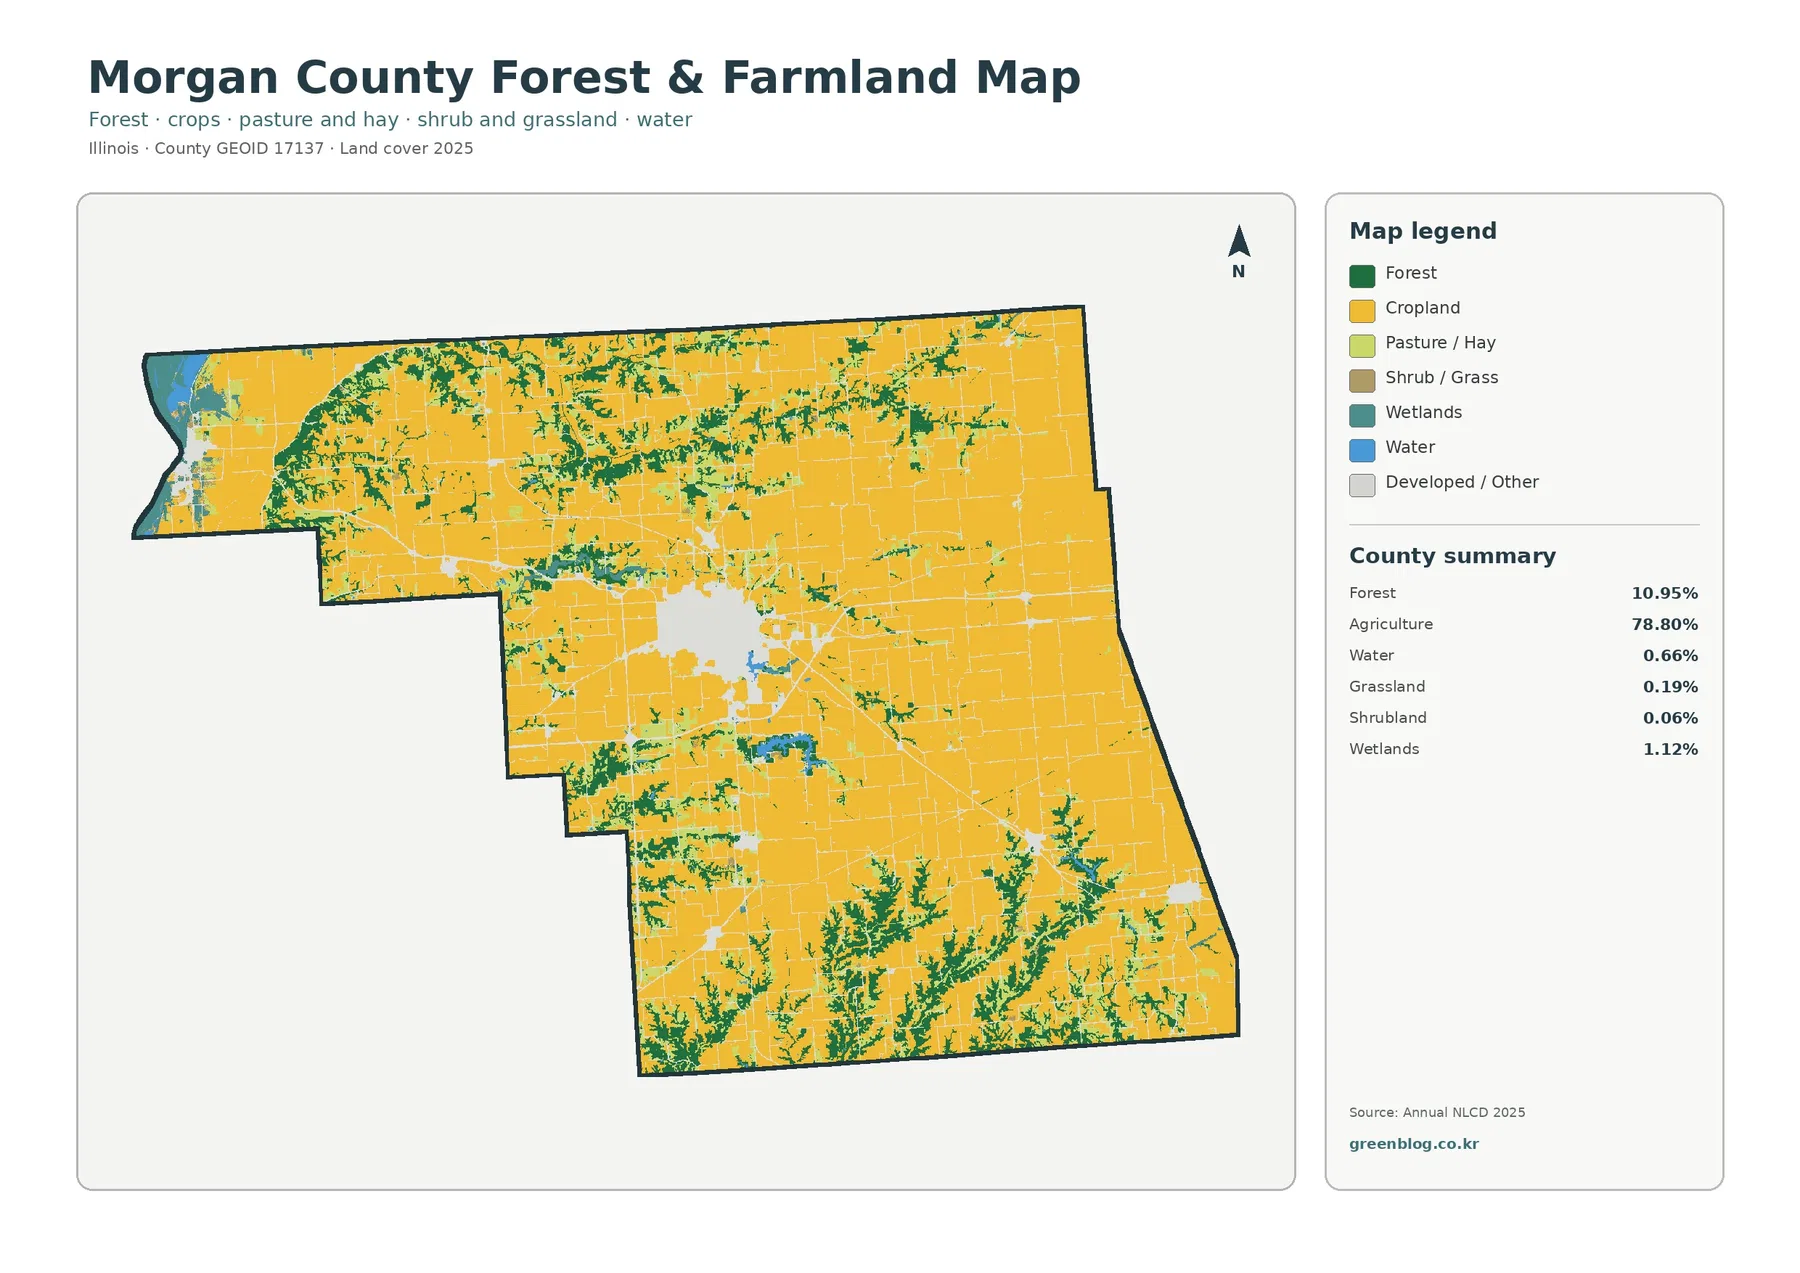
The forest-and-farmland map removes much of the visual competition from the developed classes. Cropland becomes the broad background, while forest appears as distinct green branches and patches. The contrast is strongest in the southern part of the county, where wooded corridors cut repeatedly through farm country. A second important wooded concentration curves across the northwest, creating a very different pattern from the large open farm blocks farther east.
This map is useful when the subject is rural landscape structure rather than settlement. With agriculture at 78.80% and forest at 10.95%, the countywide balance is obvious, but the location of forest is more informative than the percentage alone. Green cover is not spread evenly. It tends to form connected or semi-connected branches, while agricultural cover occupies the larger spaces between them.
Water and wetlands are easiest to notice at the far west. The Illinois River side contains the county’s clearest water concentration, with wetland cover nearby. A smaller compact water feature also appears southeast of the main Jacksonville developed area. Because water is only 0.66% and wetlands 1.12% in the summary, a table could make them seem insignificant. Their mapped locations show why small classes can still define a particular edge or corridor.
Jacksonville stands out on the impervious-surface map
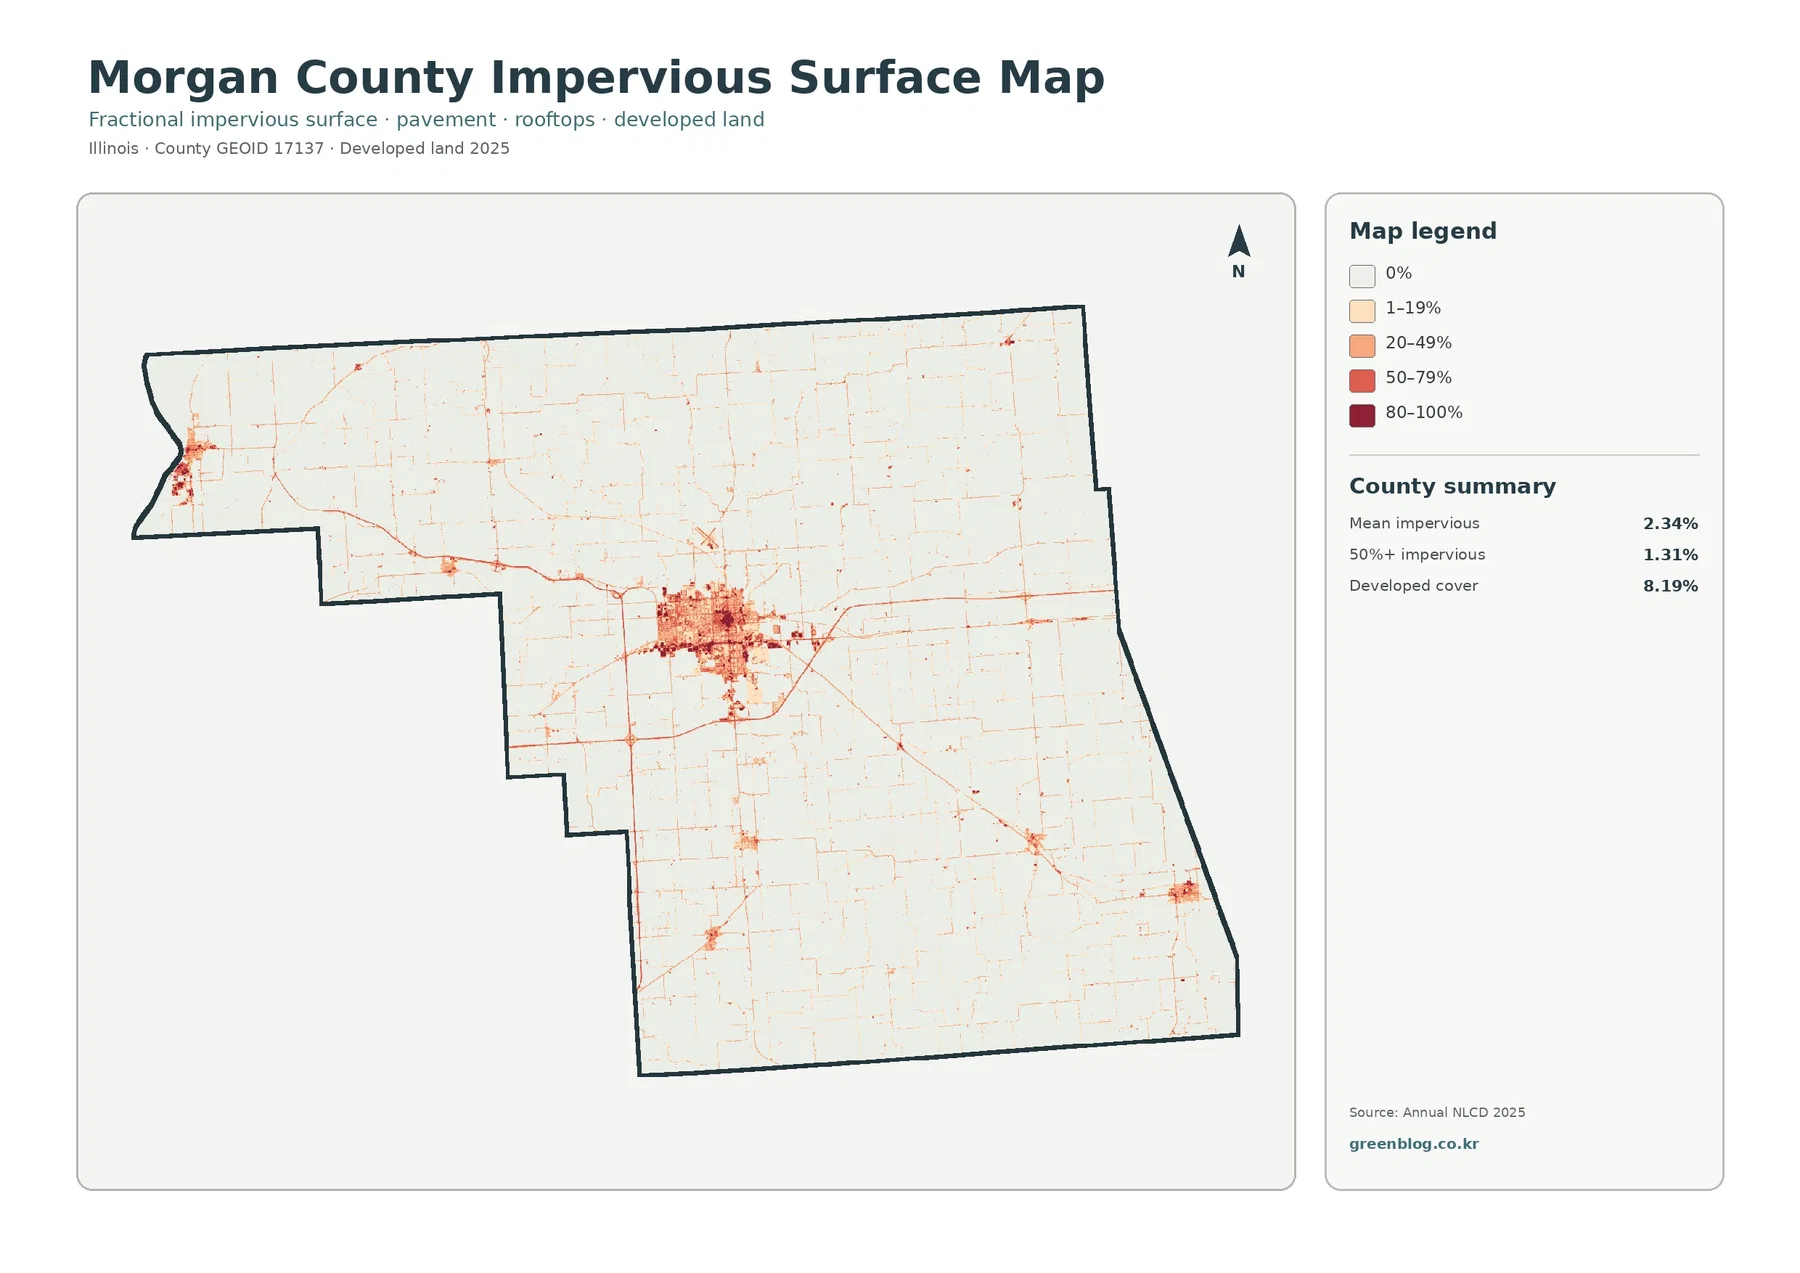
The impervious map answers a narrower question than the general developed-land class. Morgan County has a mean impervious value of 2.34%, and 1.31% of the county is mapped at 50% impervious or higher. Developed cover is 8.19%, which is larger because a developed land-cover class can include lawns, trees, soil, and other permeable surfaces mixed with buildings and pavement. Impervious percentage focuses on the hard fraction within those areas.
Jacksonville produces the strongest concentration. The urban grid forms a dense central patch, and several roads extend from it as thin linear traces. This makes the map particularly useful for distinguishing a broad developed category from actual hard-surface intensity. A residential edge can be classified as developed while still appearing relatively light on the impervious map if much of the ground remains lawn, vegetation, or another permeable surface.
Impervious cover can be relevant to runoff discussions, but this map is not a flood-risk map. Darker cells mean a larger share of hard surface, not a confirmed drainage problem. Flooding depends on rainfall, elevation, soil, drainage systems, stream levels, and other factors. The map is appropriate for general planning context or environmental education, but site design and regulatory decisions require local engineering and parcel-level information.
What the 1985–2025 class-difference map actually says
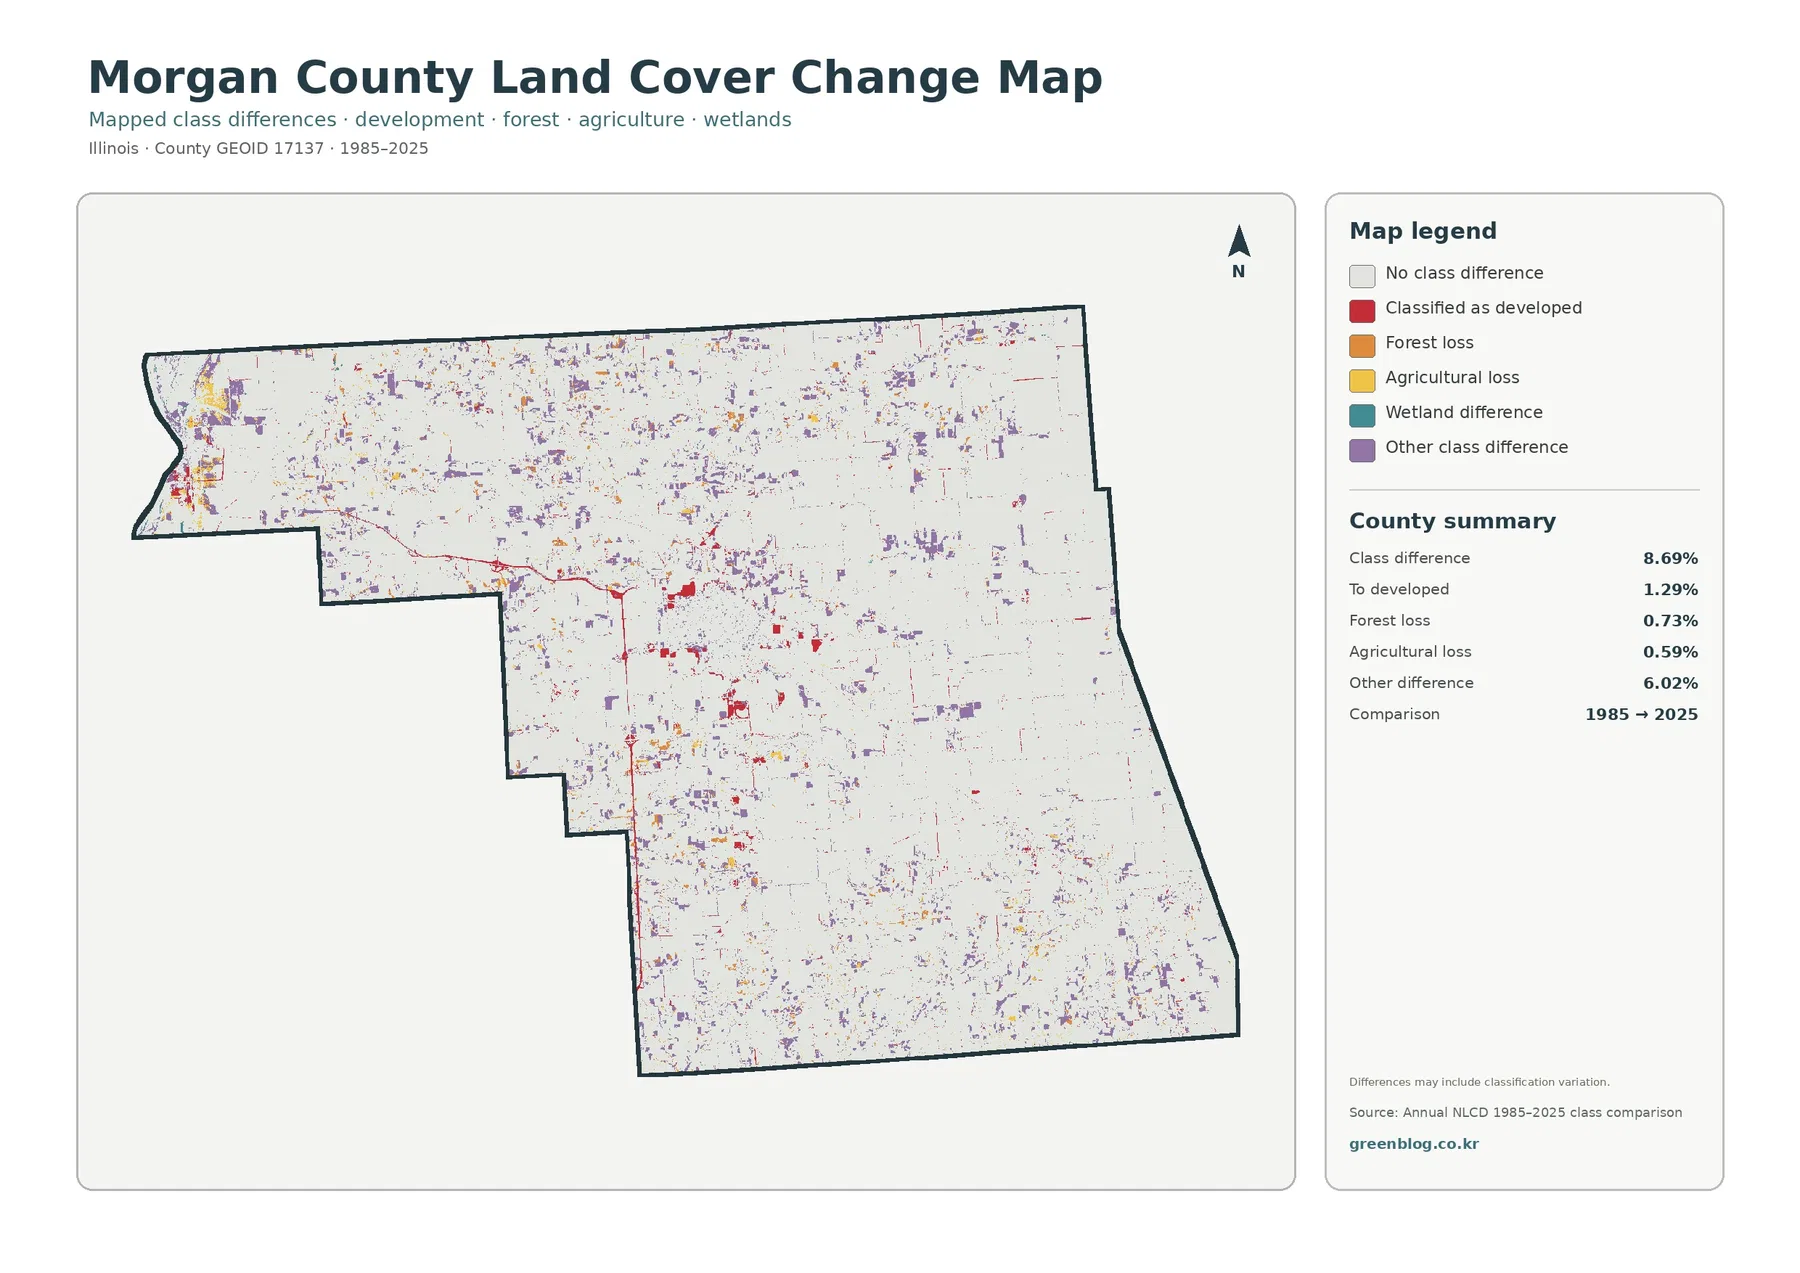
The change product compares two classification years rather than presenting a continuous forty-year history. In Morgan County, 8.69% of the mapped area is shown with a class difference. The summary identifies 1.29% as becoming classified as developed, 0.73% as forest loss, 0.59% as agricultural loss, and 6.02% as other class difference. The large “other” share is an important caution against describing every colored cell as a confirmed land-use conversion.
Developed-change marks are more noticeable around Jacksonville and along a number of road or settlement areas. The western river-side section also contains clusters of difference. Purple other-class differences are scattered much more broadly across the county, often as small patches or narrow shapes. Forest-loss and agricultural-loss colors occur in several places, but neither category approaches the countywide extent of the general other-difference class.
Classification differences can arise from real landscape change, but image timing, classification rules, mixed pixels, and edge effects can also contribute. A field margin, wooded strip, or wet area may be assigned differently between years without representing a single dramatic event. For that reason, the map works best as a screening tool for finding places that deserve closer inspection. Historical aerial photography or local records are needed to confirm what happened and when.
Reading the Illinois River edge, Jacksonville, and the wooded south together
Jacksonville provides a different comparison. On the general map it is the largest developed cluster. On the impervious map it becomes the strongest hard-surface concentration, with roads clearly radiating into surrounding farm country. The change map adds a time-comparison layer, showing developed classification differences around parts of the urban area. The forest-and-farmland map, by contrast, intentionally reduces the visual weight of development so rural cover can be compared more easily.
The southern half is the best place to examine forest geometry. Green cover appears in branching, irregular corridors separated by broad agricultural spaces. The impervious map is comparatively quiet there except for roads and smaller built nodes. This contrast makes southern Morgan County useful for explaining why “mostly agricultural” does not mean “uniformly agricultural.” The forest share is only about one-ninth of the county, yet its location creates strong visual divisions in the landscape.
Land cover is not zoning, ownership, or a parcel survey
Annual NLCD land cover classifies what is physically covering the ground from remotely sensed information and supporting data. It is different from legal land use. An agricultural-colored cell does not establish a farm’s ownership, crop rights, or zoning. A developed-colored cell does not determine a municipal boundary or whether construction is permitted. Morgan County’s GIS and planning resources are the appropriate places to look for local administrative layers.
The maps also use raster cells, which generalize the landscape. A cell can contain several real-world surfaces, such as a road edge, grass, trees, and a building. Small streams, narrow tree rows, isolated structures, or fine parcel boundaries may therefore look simplified or disappear at this scale. Enlarging the JPG does not create detail that was absent from the source classification.
Choosing the right JPG for a report, class, or presentation
Use the 2025 general land-cover JPG when you need one image that summarizes the county. It is the best choice for showing the 78.80% agricultural majority together with Jacksonville, forest, wetlands, and water. Choose the forest-and-farmland version when the discussion is specifically about rural cover, wooded corridors, or the contrast between farm blocks and natural vegetation.
The impervious-surface JPG is more appropriate for an urban-development discussion because it separates low and high hard-surface percentages. The change JPG belongs in a time-comparison section, especially when the 8.69% class-difference summary is explained with its limitations. All four maps use the same county outline, so placing them on consecutive slides or pages makes location-to-location comparison straightforward.
Frequently Asked Questions
What is the dominant land cover in Morgan County?
Agriculture is the dominant 2025 class at 78.80%. Forest follows at 10.95% and developed land at 8.19%. Wetlands account for 1.12% and water 0.66%. The western Illinois River edge makes the smaller water and wetland classes more visible than their countywide percentages might suggest.
Why does Jacksonville appear much darker on the impervious map?
Jacksonville is the county’s largest concentrated developed area. The impervious map emphasizes rooftops, pavement, parking areas, and roads, so the city core forms a much stronger cluster than the surrounding agricultural landscape. Developed cover and impervious percentage are related but not identical measures.
Does the 8.69% class-difference figure mean that much land was permanently converted?
No. The map compares the 1985 and 2025 classifications, and 6.02% is labeled as other class difference. Real land-cover change can contribute, but classification variation and mixed pixels can also affect the result. Historical imagery or local records are needed to confirm a specific conversion.
Map File Information
Download four original JPG maps for Morgan County: 2025 land cover, forest and farmland, impervious surface and developed land, and the 1985–2025 class-difference map.
- Included Files: Use only the versions confirmed in the article and supplied images
- File Type: Use the confirmed download contents
- Intended Use: Printing, education, presentations, and map-based projects
Related Maps
- Adams County Illinois Land Cover Map
- Alexander County Illinois Land Cover Map
- Bond County Illinois Land Cover Map
Sources and References
- MRLC Annual NLCD Data
- USGS Annual NLCD Land Cover Classification
- U.S. Census Bureau TIGER/Line Shapefiles
- Morgan County GIS
- Morgan County Multi-Jurisdictional Natural Hazards Mitigation Plan
Green Map creates custom-edited map images using open geographic data sources such as geoBoundaries, Natural Earth, OpenStreetMap, and government open data.
These maps are edited visual materials, not raw data files, and are provided for education, documents, presentations, and graphic reference.