Montgomery County is overwhelmingly agricultural on the 2025 land-cover map, yet the county is not visually uniform. Broad farm blocks dominate the north, center, and east, while wooded drainage lines become much more prominent toward the south. The Litchfield area, Lake Lou Yaeger, Hillsboro, Coffeen Lake, and several smaller towns create distinct clusters of water, forest, and developed cover within that agricultural setting.
This page compares four views of the same county: 2025 land cover, forest and farmland, impervious surface and developed land, and mapped class differences from 1985 to 2025. The four original JPG maps are available together in one ZIP, so the set can be used for county reference, classroom work, presentations, environmental comparison, or a closer look at one particular pattern.
Table of Contents
A 77.23% agricultural county with very different northern and southern patterns
The county summary identifies agriculture as the dominant 2025 cover at 77.23%. Forest accounts for 13.07%, developed land 8.20%, water 1.02%, and barren land 0.28%. Those percentages explain the overall balance, but location matters just as much. Agriculture forms large, continuous blocks through much of the northern extension and the eastern half, whereas forest becomes more branched and frequent across southern drainage corridors and around major lakes.
Montgomery County’s official website lists communities including Hillsboro, Litchfield, and Nokomis, and the map contains strong developed clusters in the same general parts of the county. Litchfield forms the broadest cluster in the southwest. Hillsboro appears as another clear concentration farther east, while Nokomis is represented by a smaller developed area toward the northeastern side. Raymond, Farmersville, Coffeen, and other smaller settlements appear at a very different scale from the two largest clusters.
Water and forest add the most obvious breaks in the farm pattern. Lake Lou Yaeger lies northeast of Litchfield and appears as a long blue feature bordered by a much more wooded landscape than the surrounding fields. Coffeen Lake creates another conspicuous water-and-forest combination in the southeast. Between and around these lakes, green forest follows many narrow drainage lines, producing irregular shapes that contrast sharply with the straighter edges of farm fields and roads.
The local Soil and Water Conservation District describes soil, water, forest, grassland, wetland, and agricultural conservation as central parts of its work. That local context is useful when reading the map, but the colored classes should not be confused with legal land use. Annual NLCD classifies what covers the ground. It does not establish parcel ownership, zoning, development rights, or regulated wetland boundaries.
The general 2025 map shows where the farm majority is interrupted
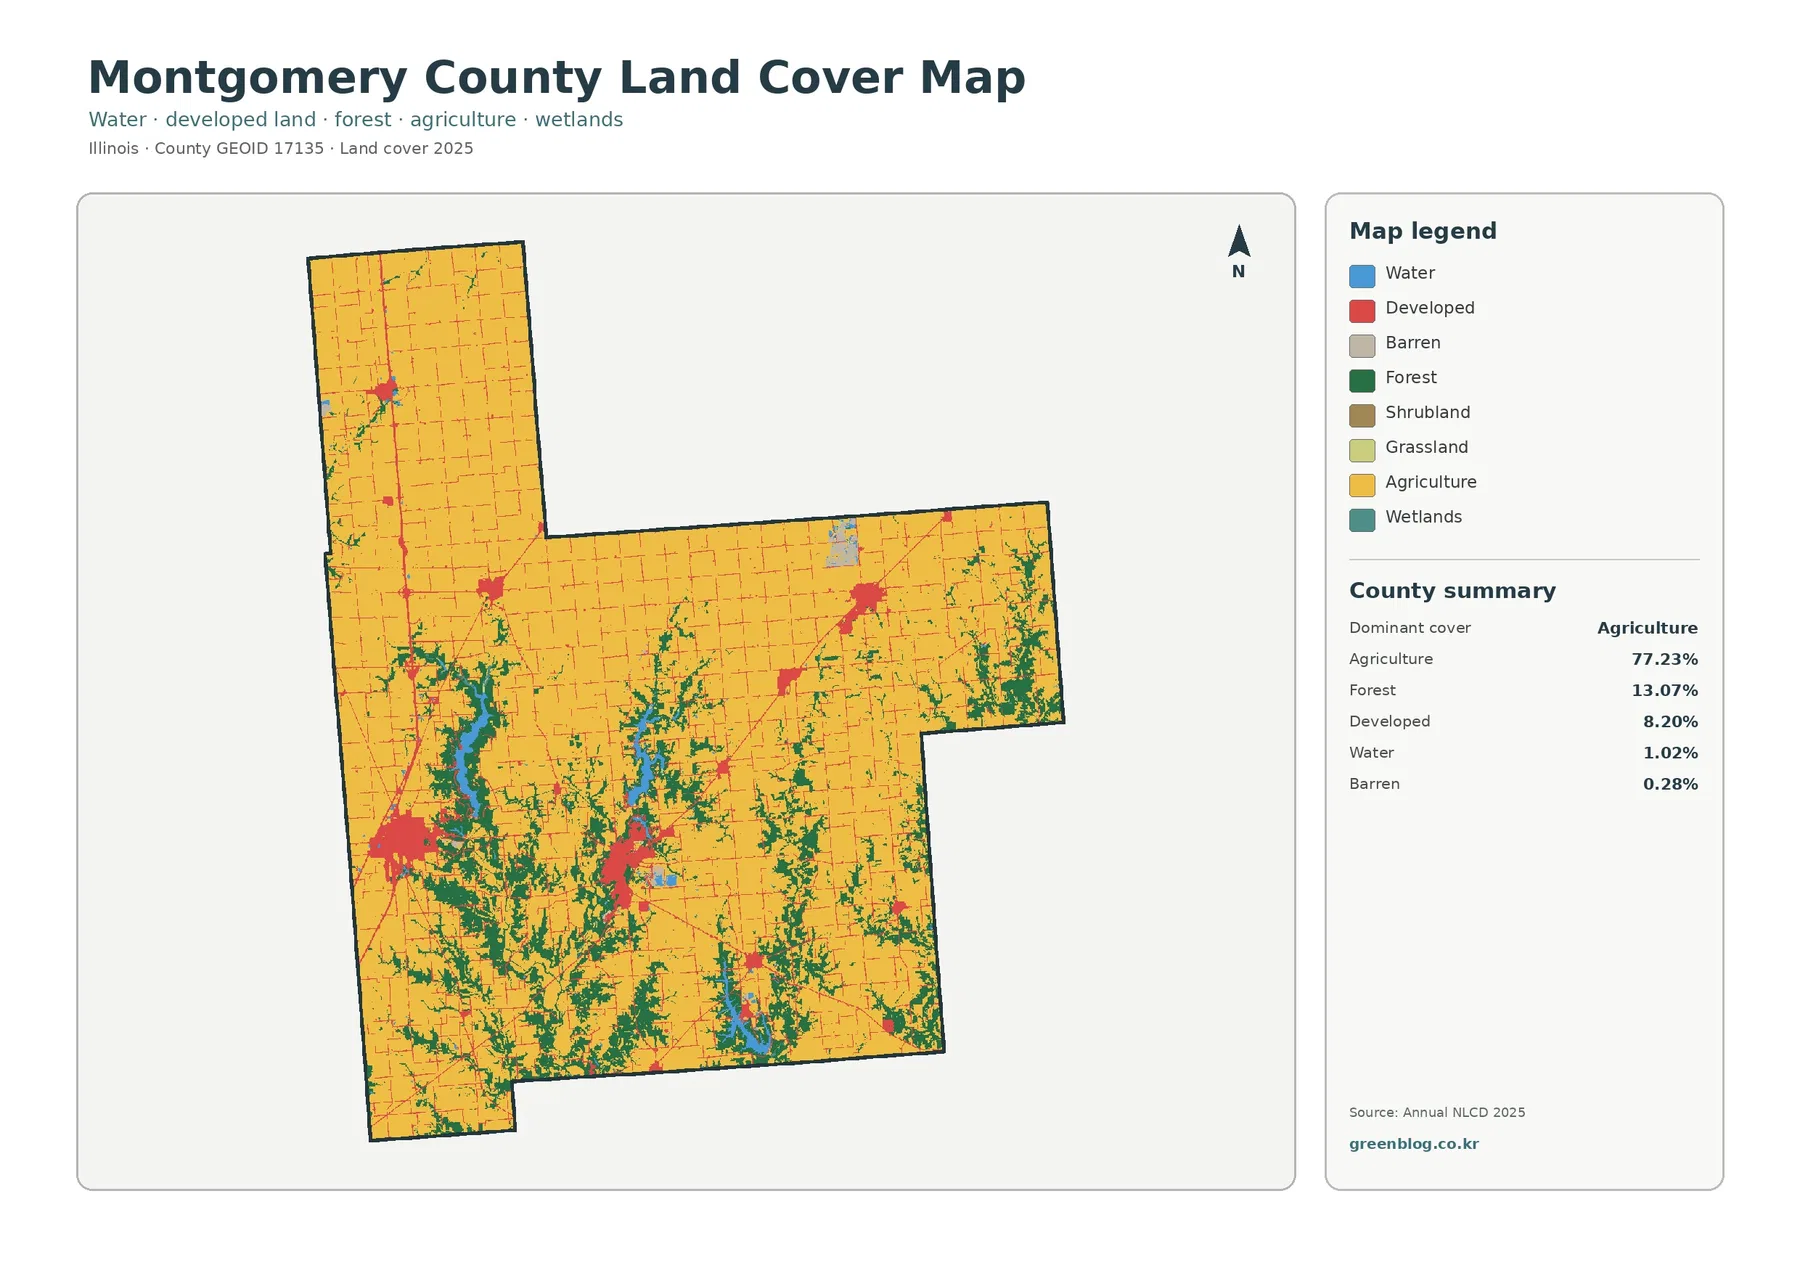
Agriculture is the first thing the eye notices because yellow fills most of the county. In the northern extension, fields create large uninterrupted areas with only thin road lines and small settlement patches breaking the pattern. Similar farm dominance continues across the east. The southern half is more visually complicated, with forest splitting fields into smaller pieces and blue water appearing beside some of the largest green areas.
Forest does not occupy one single block. Green cover wraps around Lake Lou Yaeger, branches away from the lake along drainage lines, and becomes increasingly common across the south-central portion of the county. Additional wooded corridors appear in the southeast around Coffeen Lake and along smaller streams. This scattered but connected pattern explains why a 13.07% countywide forest share can still be visually important across a large portion of the map.
The 1.02% water share is modest in percentage terms, yet the two largest lake features are easy to find. The City of Litchfield identifies Lake Lou Yaeger as a major local lake and recreation area, while the Illinois Department of Natural Resources manages Coffeen Lake State Fish and Wildlife Area near Coffeen. Their locations provide useful reference points for interpreting the map because both water bodies sit within noticeably wooded surroundings rather than in the county’s broadest open farm blocks.
Developed land at 8.20% appears as town clusters, smaller settlement patches, and thin lines associated with the road network. That number should not be treated as the area covered by buildings or pavement alone. Developed NLCD classes can include lawns, trees, and other vegetation mixed with built surfaces, so the impervious map is a better choice when the question is specifically about hard surfaces such as roads, rooftops, and parking areas.
Litchfield and Hillsboro stand out when the map measures hard surface instead of land-cover class
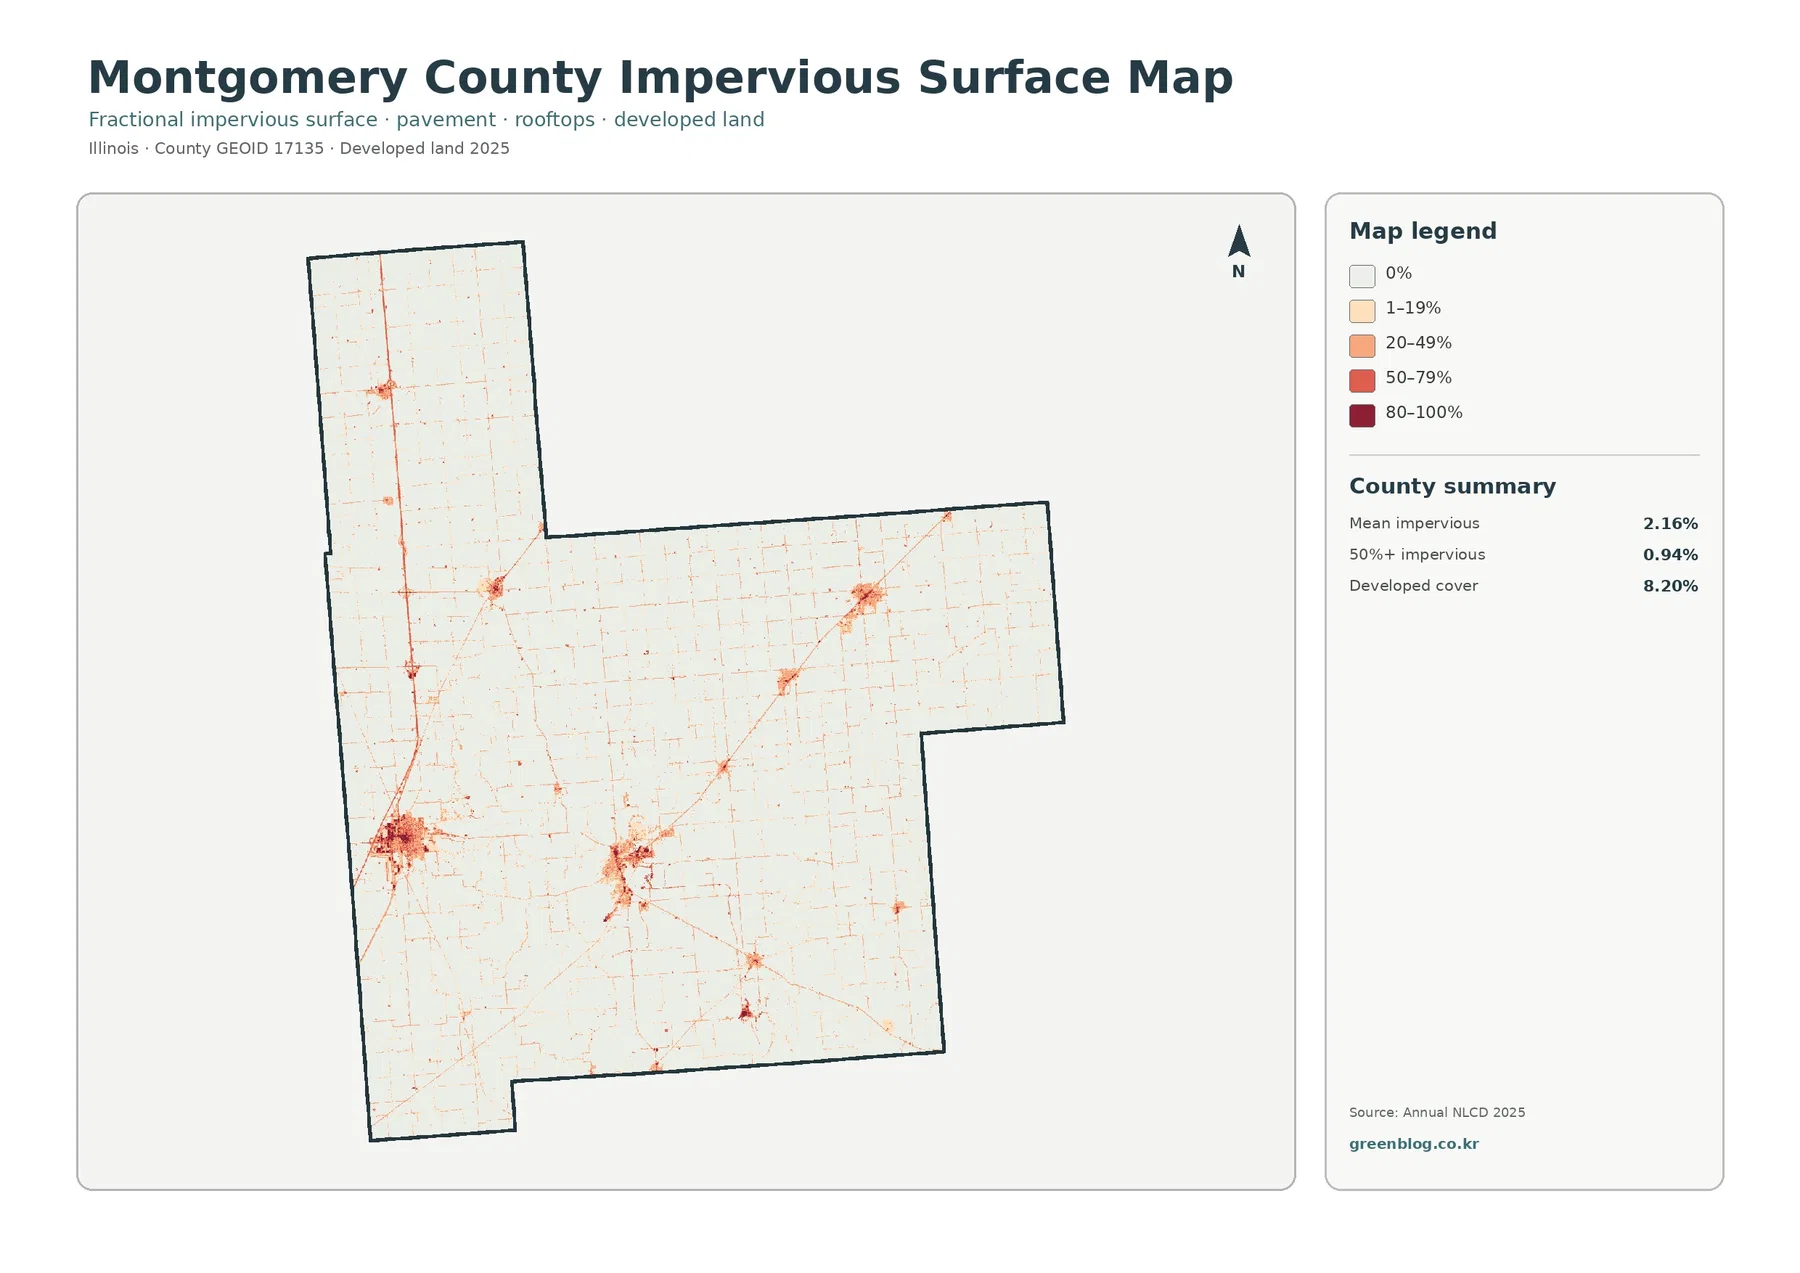
Impervious surface means pavement, rooftops, parking lots, and similar surfaces that do not readily absorb rainfall. Montgomery County’s mean impervious value is 2.16%, and 0.94% of the county is mapped in cells with more than 50% impervious cover. Those figures are much lower than the 8.20% developed-land share because a developed land-cover class can contain a mixture of built and vegetated surfaces.
The southwest cluster around Litchfield is the most prominent concentration of darker impervious values. Hillsboro forms another strong group in the south-central part of the county. Nokomis appears as a smaller concentration to the northeast, and Raymond and Farmersville can be placed among the smaller town-scale clusters farther north and west. Coffeen and other communities appear more modestly, which makes the difference in settlement scale immediately visible.
Outside the towns, the county looks pale, but the road network remains visible as a fine mesh of narrow lines. Straight rural roads cross the agricultural blocks in a regular pattern, while larger connections extend between settlement clusters. This is one reason the impervious map adds information that the general land-cover map cannot: it separates the intensity of hard surface from the broader developed class and makes paved transportation surfaces easier to see.
Dark impervious values do not identify flood risk, drainage capacity, or zoning. A paved commercial area and a dense residential block may both produce high values, yet their stormwater systems and local topography can differ. The same caution applies near Lake Lou Yaeger and Coffeen Lake. The map can compare built surface with surrounding water and forest, but site-level runoff or development decisions require more detailed engineering, soil, elevation, and local administrative information.
Removing the urban colors makes the wooded drainage network much easier to follow
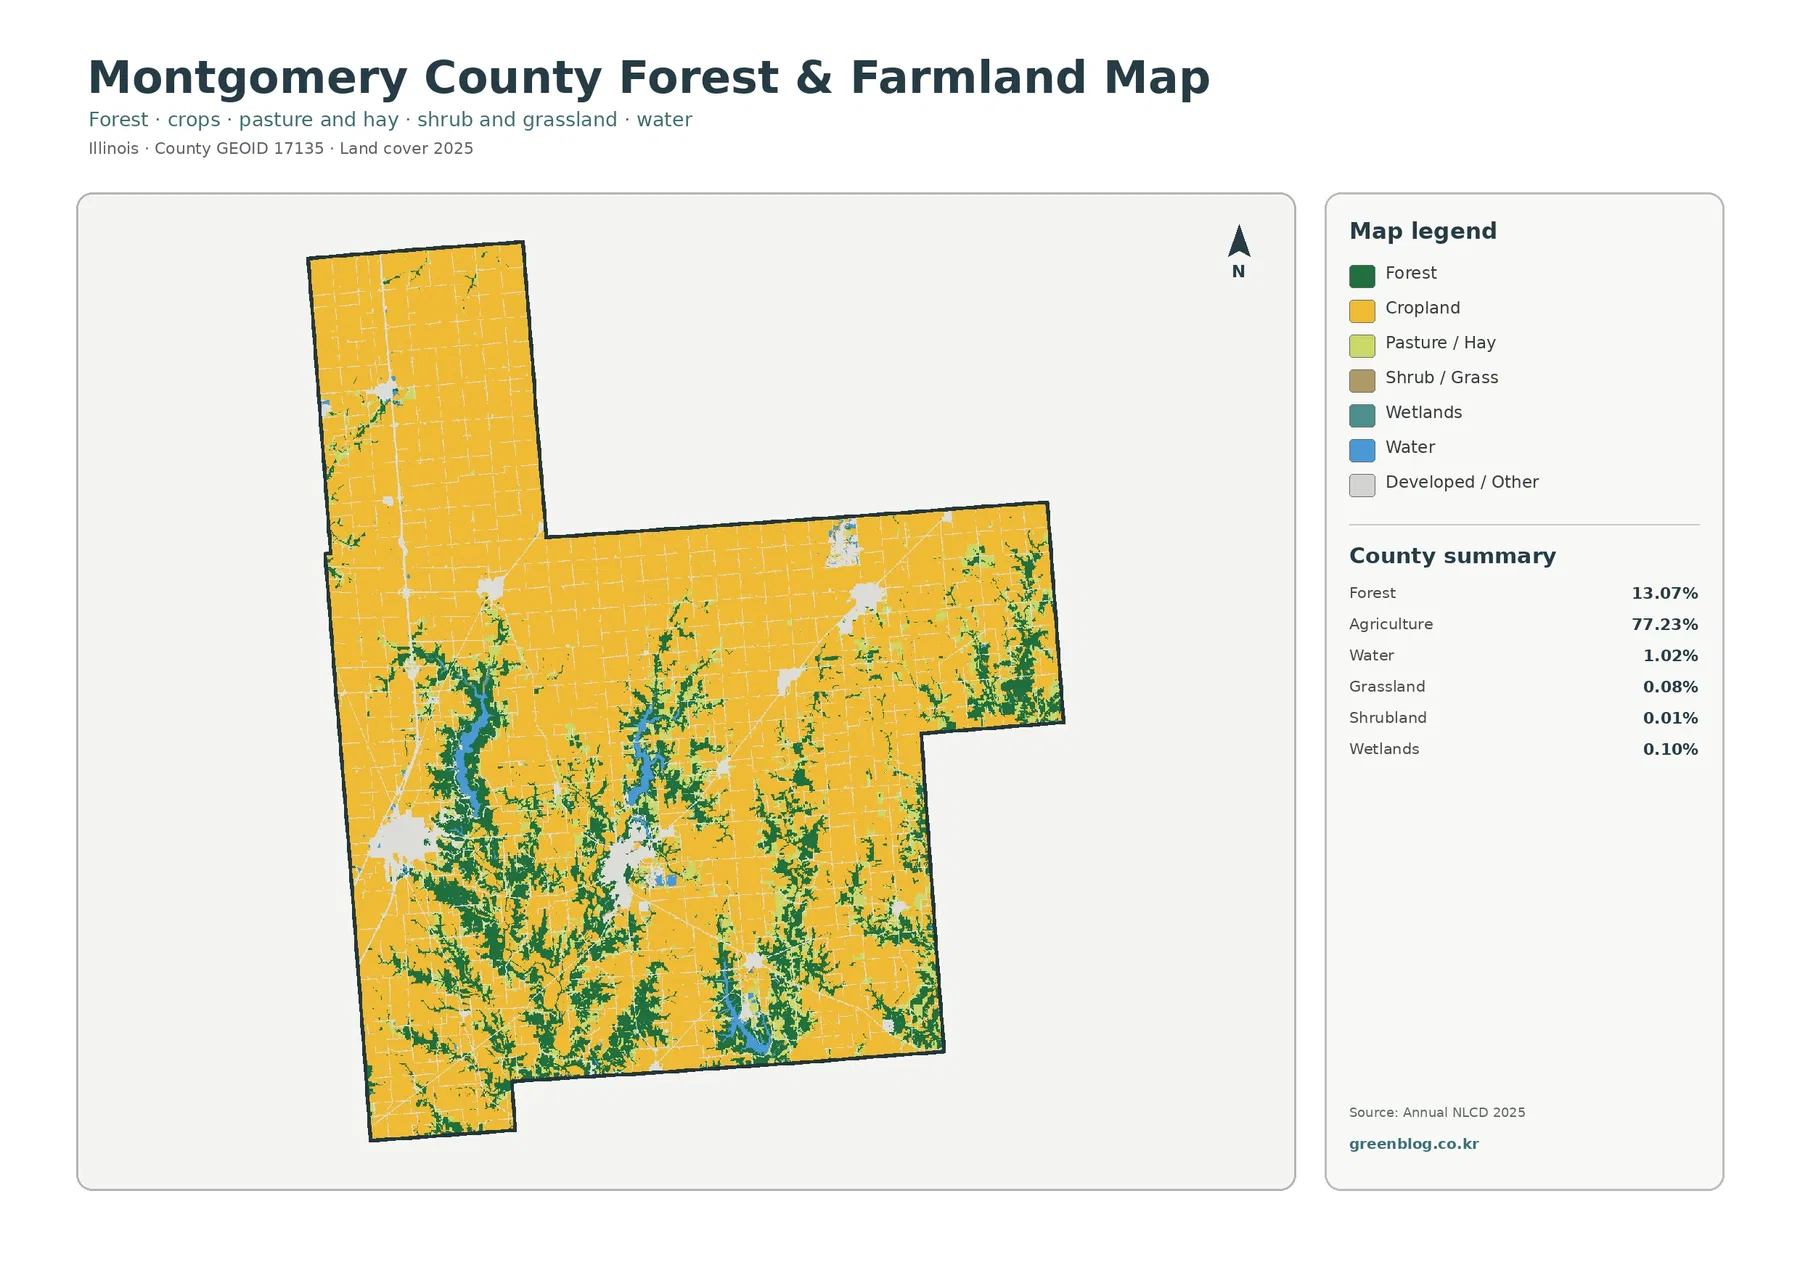
The forest-and-farmland version simplifies the county enough to make the farm-to-forest contrast more obvious. Cropland forms the large yellow background, especially across the north and east. In the southwest, the landscape changes around Lake Lou Yaeger, where forest follows the irregular shoreline and continues outward along valleys. That green network is much easier to trace here than on the general map because developed land and several minor categories are visually reduced.
South of the broad northern farm areas, wooded cover repeatedly branches through agricultural land instead of forming straight boundaries. Some corridors are narrow, while others widen into sizable patches. This pattern is useful for teaching the difference between a countywide percentage and a spatial distribution: 13.07% forest sounds small beside 77.23% agriculture, but the forest is spread across many locations that divide and frame the farm landscape.
Coffeen Lake provides a second good example. The lake’s blue shape sits within green cover in the southeast, and Illinois DNR describes oak-hickory forest around the site. The map cannot identify individual tree species, but the official description confirms that a substantial wooded setting exists around the water body. Nearby agricultural blocks then provide a strong contrast between managed cropland and natural cover at the county scale.
Minor classes are present but should not be overstated. The map summary gives grassland at 0.08%, shrubland at 0.01%, and wetlands at 0.10%. These values are small enough that many individual patches are difficult to interpret at full-county scale. They become more useful when someone already knows where to look, especially around water and mixed vegetation, but they should not be used to claim precise parcel-level habitat boundaries.
Most of the 1985–2025 difference is not mapped as new development
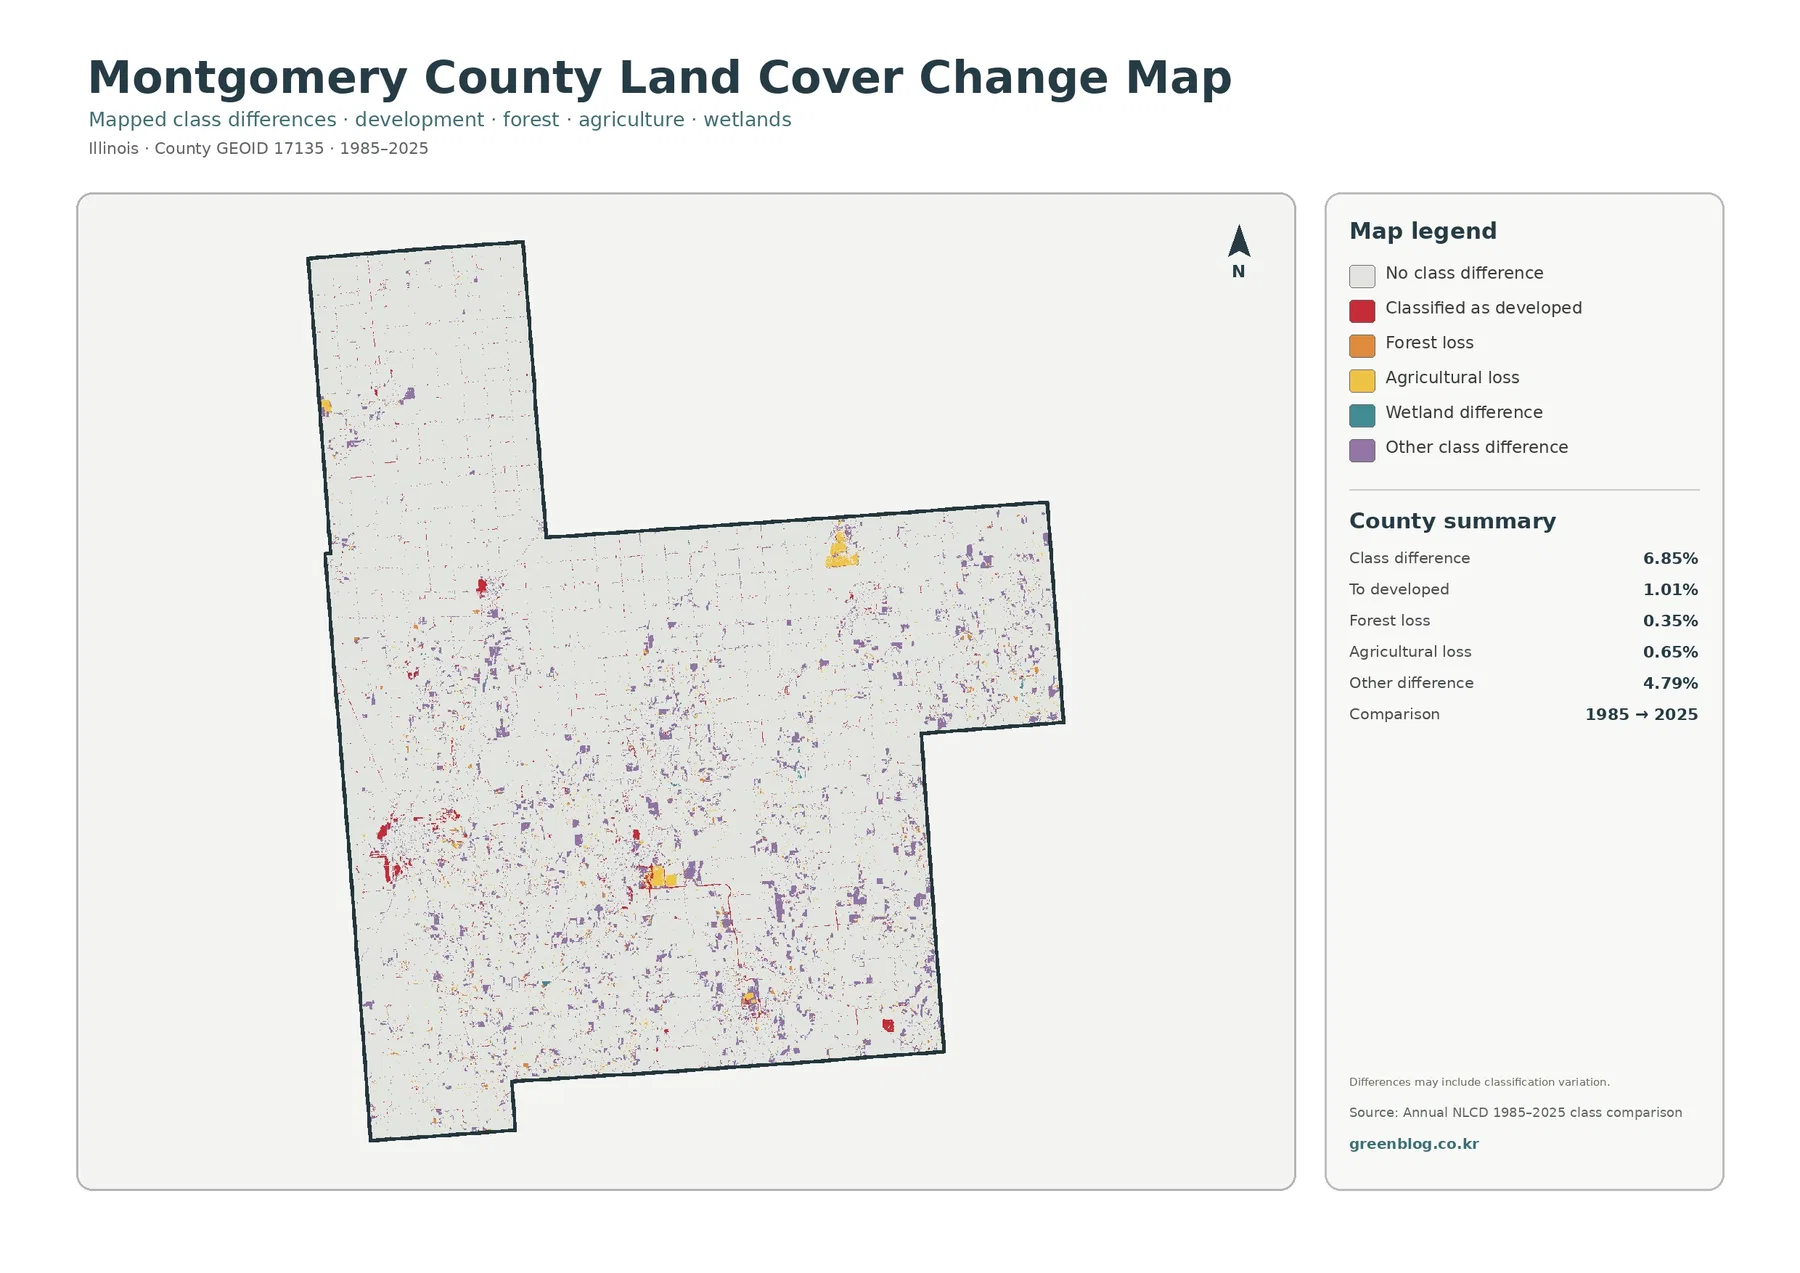
The change summary reports class differences across 6.85% of the county. Change to developed accounts for 1.01%, forest loss 0.35%, agricultural loss 0.65%, and other class difference 4.79%. Wetland difference is included in the legend, but the summary does not provide a separate percentage for it. The total therefore cannot be described as a 6.85% increase in development or a single type of land conversion.
Red cells classified as change to developed appear around Litchfield, Hillsboro, Nokomis, and several smaller settlement areas. Some thin red features also follow roads. Comparing those cells with the current impervious map is useful because the two layers answer different questions. One records a change in broad land-cover class between two dates; the other measures the fraction of hard surface mapped in 2025.
Purple “other class difference” is the largest reported component at 4.79%. That matters because it warns against a simple before-and-after story. A cell may move between agricultural and grass-like classes or between forest and another vegetated class without representing a large permanent land conversion. Image timing, crop condition, wetness, and classification methods can also influence the assigned class, especially near narrow boundaries and water.
The southern half contains many small change patches where forest, agriculture, and water occur close together. Lake margins and branching drainage corridors are especially sensitive to the scale of the 30-meter raster. If a specific field, woodland, or lakeshore property matters, intermediate aerial photographs and local records are a better way to confirm what actually happened and when. The change map is best used to locate areas that deserve closer investigation.
Use one map as the main view, then add a second map to answer a narrower question
For a general Montgomery County profile, the 2025 land-cover map is the strongest starting point because it puts agriculture, forest, development, and water on one page. The Lake Lou Yaeger area is particularly effective for comparison: the general map shows water, forest, agriculture, and nearby Litchfield development within a compact part of the county, so viewers can understand several classes without moving to a different geographic area.
When the subject is agriculture and natural cover, the forest-and-farmland map removes much of the urban visual noise. It works well for comparing the simpler northern farm blocks with the more dissected southern landscape. A teacher or presenter can trace how wooded corridors branch through fields, then switch back to the general map to see where those same corridors meet towns or water.
For settlement and transportation, the impervious layer should come first. It clearly separates Litchfield and Hillsboro from smaller communities while preserving the fine rural road network. If the question changes to long-term land-cover difference, the 1985–2025 map becomes more useful, but its legend must remain visible so development, forest loss, agricultural loss, wetland difference, and other class difference are not mistakenly combined.
Printing all four maps at a very small size can make subtle colors and thin roads difficult to distinguish. A clearer approach is to enlarge the map that carries the main message and use one or two additional maps for comparison. This is especially important for the change map, where small colored cells have different meanings. The original JPG files are large enough for detailed on-screen viewing, but enlargement does not create information beyond the source classification.
What a 30-meter classification can explain, and what still requires local data
Annual NLCD is designed for consistent land-cover mapping across broad areas. Its raster structure uses square grid cells, and the land-cover products are commonly represented at 30-meter resolution. A narrow tree line, farm lane, small pond, lawn, and crop field can therefore influence nearby cells without each feature receiving a perfectly surveyed boundary. Mixed pixels are simply cells that contain or are influenced by more than one kind of surface.
That generalization is not a flaw when the goal is county-scale comparison. It allows the same classification system to be used across Montgomery County and elsewhere. Problems arise only when the map is asked to do a parcel map’s job. The forest edge is not a property line, a wetland color is not a regulatory determination, and a developed class does not establish what a municipality permits on a site.
The observation year matters as well. A new building, road project, field conversion, tree removal, or change in water level after the 2025 dataset will not appear here. Conversely, a difference shown between 1985 and 2025 does not reveal its exact date or cause. The four-map set is most dependable for seeing broad distribution, comparing map themes, and identifying locations where more detailed current information may be worthwhile.
What is included in the four-map JPG set
The ZIP contains one original JPG for each view used on this page: the 2025 land-cover map, the forest-and-farmland map, the impervious-surface and developed-land map, and the 1985–2025 land-cover-change map. Each image measures 2480×1754 pixels. The general map is the best overview, while the other three are designed for more focused comparisons.
Choose the forest-and-farmland version for the southern wooded corridors and lake surroundings, the impervious layer for town and road surfaces, or the change map when the two-date comparison is central to the discussion. If a project uses more than one map, keep the same county orientation and comparable display size so viewers can move between layers without losing their location.
Frequently Asked Questions
What is the dominant land cover in Montgomery County?
Agriculture is the dominant 2025 class at 77.23%. Forest is the second-largest listed class at 13.07%, followed by developed land at 8.20%. The distribution is not uniform, however. Forest and water are much more conspicuous around Lake Lou Yaeger, Coffeen Lake, and southern drainage corridors than they are across the broad northern farm blocks.
Why does the impervious map look much lighter than the developed-land map?
Developed land can include a mixture of buildings, pavement, lawns, trees, and other vegetation within a developed setting. Impervious surface measures the fraction of hard surface more directly. Montgomery County has 8.20% developed cover, but its mean impervious value is 2.16%, so most of the county remains very light on the impervious map outside towns and roads.
Does the 6.85% change value mean that 6.85% of the county was developed after 1985?
No. The 6.85% figure represents all mapped class differences between 1985 and 2025. Only 1.01% is summarized as change to developed. Forest loss is 0.35%, agricultural loss 0.65%, and other class difference 4.79%, with wetland difference also shown in the legend. The total should not be treated as a development-growth rate.
Map File Information
Download the four original Montgomery County, Illinois JPG maps in one ZIP: 2025 land cover, forest and farmland, impervious surface and developed land, and 1985–2025 land-cover change.
- Included Files: Use only the versions confirmed in the article and supplied images
- File Type: Use the confirmed download contents
- Intended Use: Printing, education, presentations, and map-based projects
Related Maps
- Adams County Illinois Land Cover Map
- Alexander County Illinois Land Cover Map
- Bond County Illinois Land Cover Map
Sources and References
- MRLC Annual NLCD Data
- USGS Annual NLCD Land Cover Classification
- Montgomery County, Illinois official website
- Montgomery County Soil and Water Conservation District
- Illinois DNR Coffeen Lake State Fish and Wildlife Area
- City of Litchfield – Lake Lou Yaeger
Green Map creates custom-edited map images using open geographic data sources such as geoBoundaries, Natural Earth, OpenStreetMap, and government open data.
These maps are edited visual materials, not raw data files, and are provided for education, documents, presentations, and graphic reference.