Monroe County in southwestern Illinois has a land-cover pattern that changes noticeably from west to east. Broad farm fields occupy much of the Mississippi River floodplain and the eastern part of the county, while a wide band of forest follows the bluffs and broken uplands between them. The 2025 summary reports 60.54% agriculture, 20.71% forest, 10.38% developed land, 5.34% wetlands, and 2.88% water.
This page compares the current land-cover map with a forest-and-farmland view, an impervious-surface map, and a 1985–2025 class-difference map. The four original JPG maps are available together in one download, so you can use the view that best fits a county overview, a river-and-bluff comparison, a Waterloo or Columbia development example, or a long-term change discussion.
Table of Contents
A county split between river-bottom farming, wooded bluffs, and growing town clusters
The county’s official website describes Monroe County as a place of fertile farmland and rolling hills, with Waterloo as the county seat and Columbia, Valmeyer, Maeystown, and Fults among its communities. Those names help orient the maps. Columbia lies near the northern edge, Waterloo is near the center, Valmeyer sits close to the western bluff line, and Fults is farther south along that same river-facing landscape. The Mississippi River forms the western side of the county.
Seen as a whole, Monroe County does not look like one uniform farm county. Yellow agricultural cover spreads across the western lowland, the eastern projection, and large parts of the north and southeast. Between those areas, forest forms a broad, branching green belt. Water and wetlands hug the Mississippi side, while developed land gathers most strongly around the northern Columbia area and the central Waterloo area. The result is a clear three-part contrast: low river-bottom land in the west, wooded bluffs and dissected uplands through the interior, and extensive farm country beyond them.
The Illinois Department of Natural Resources gives useful local context for the wooded western belt. White Rock Nature Preserve lies above the Mississippi floodplain near Valmeyer and includes upland forest within a larger bluff conservation corridor. Farther south, Fults Hill Prairie Nature Preserve contains upland forest, hill prairie, limestone features, and steep terrain near the river bluffs. Those official descriptions match the broad concentration of forest visible along the western and south-central part of the land-cover maps without requiring the map itself to show terrain contours.
Impervious surface separates Waterloo and Columbia from the surrounding farm landscape
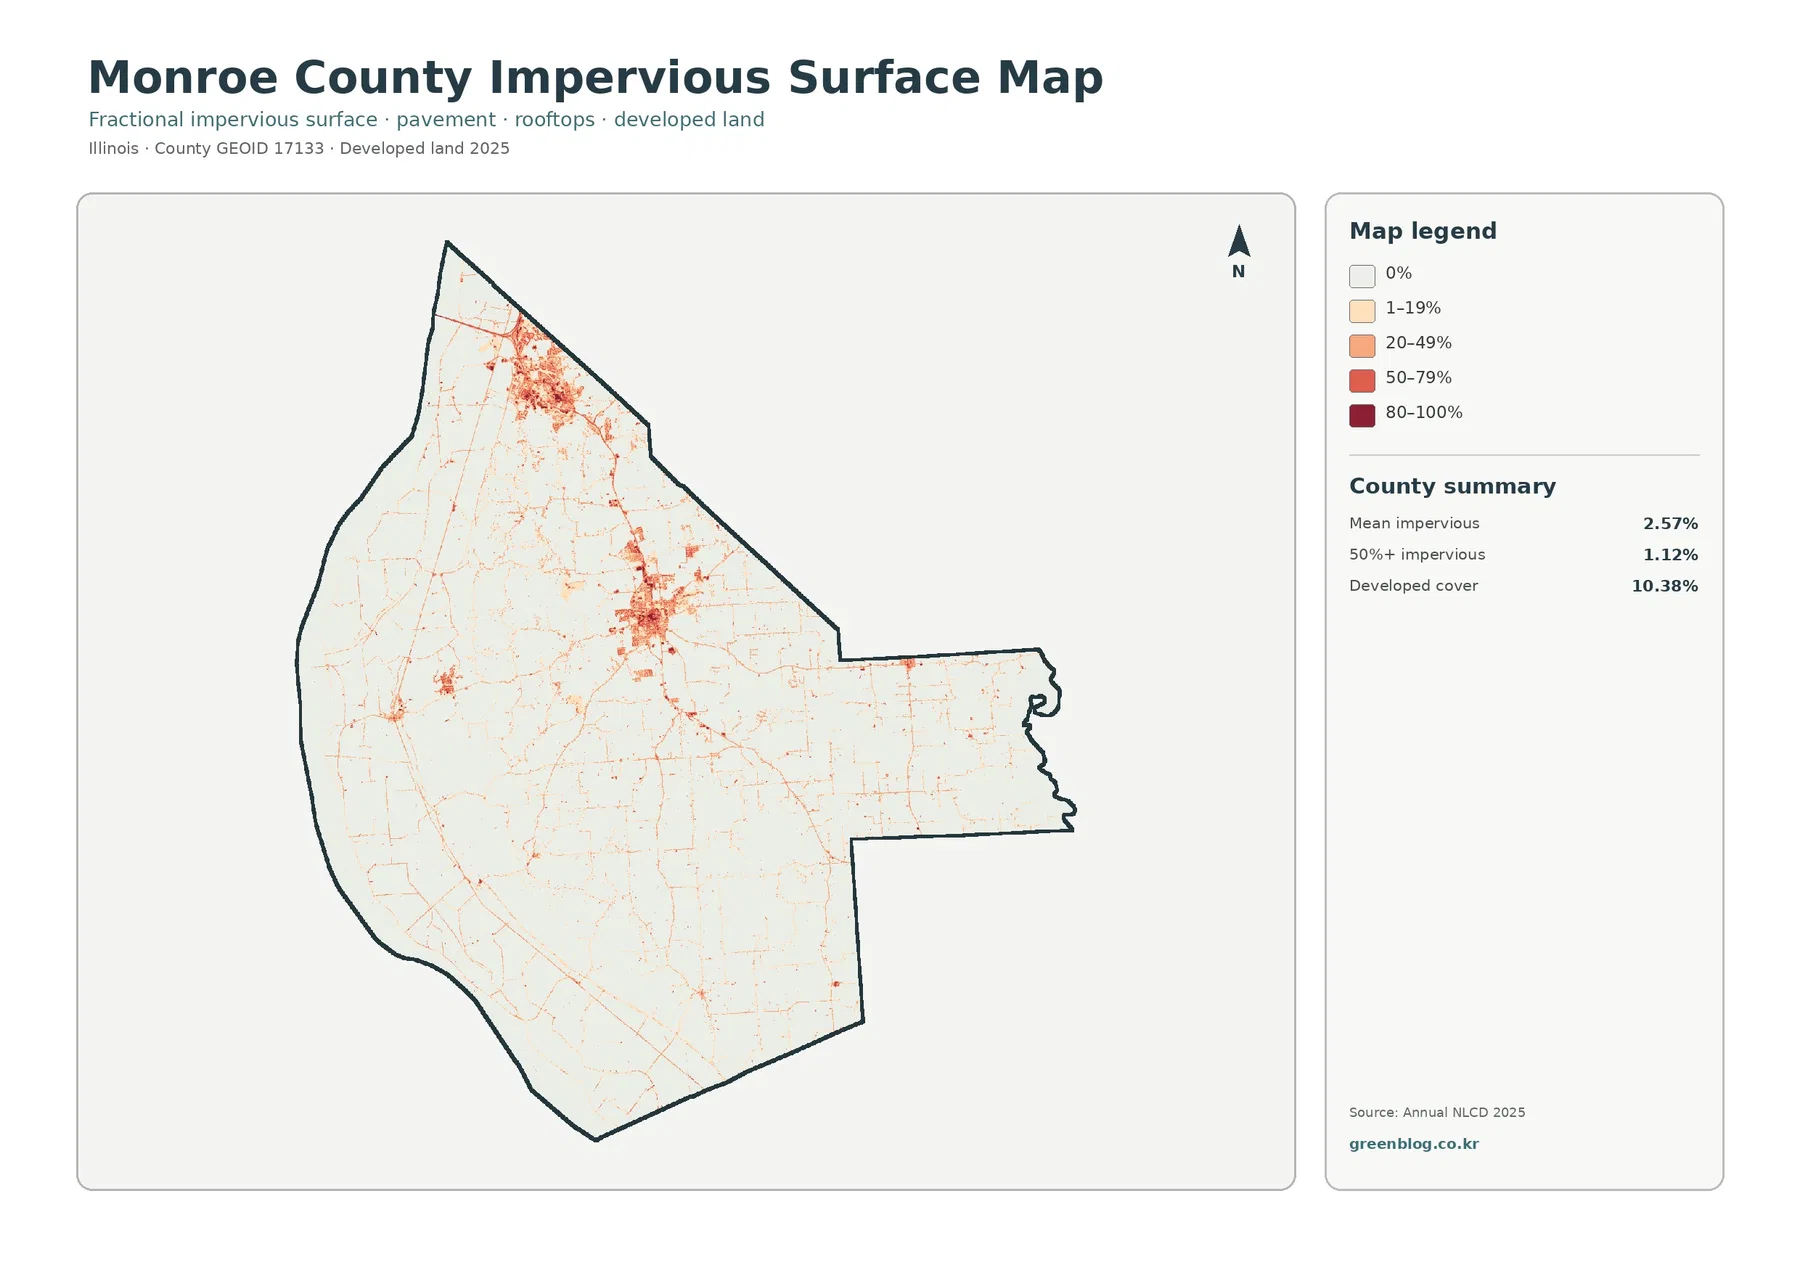
Impervious surface means pavement, rooftops, parking areas, and other hard surfaces that keep most rainfall from soaking directly into the ground. Monroe County’s mean impervious value is 2.57%, and 1.12% of the mapped cells have more than 50% impervious cover. Those countywide numbers are modest, but the map shows that hard surfaces are far from evenly distributed.
The largest northern concentration appears around Columbia. A second major cluster sits near Waterloo, where darker cells spread through the built-up area and connect to several road corridors. The country between and around the two cities is much lighter, so the contrast with surrounding agricultural land is easy to see. Smaller developed groups appear near Valmeyer and other settlements, but they cover much less space than the Waterloo and Columbia concentrations.
Across the rest of the county, roads show up as fine lines passing through pale rural cells. This is especially useful in the western floodplain and the eastern agricultural projection, where the general land-cover map is dominated by farm colors. The impervious map brings out the transportation grid and small built surfaces without confusing them with an entire developed-land class. It is a good reminder that “developed land” can include lawns and other permeable cover, while the impervious layer is focused more narrowly on hard surface.
The impervious map should not be used as a zoning or building-permit map. A dark cell tells you that a high share of the surface is hard or paved; it does not tell you whether the property is residential, commercial, industrial, or legally available for development. It also does not include drainage capacity, levee conditions, flood elevation, or parcel ownership. Those questions require local planning, engineering, and property records.
The 2025 map shows why the 60.54% agriculture figure is only the starting point
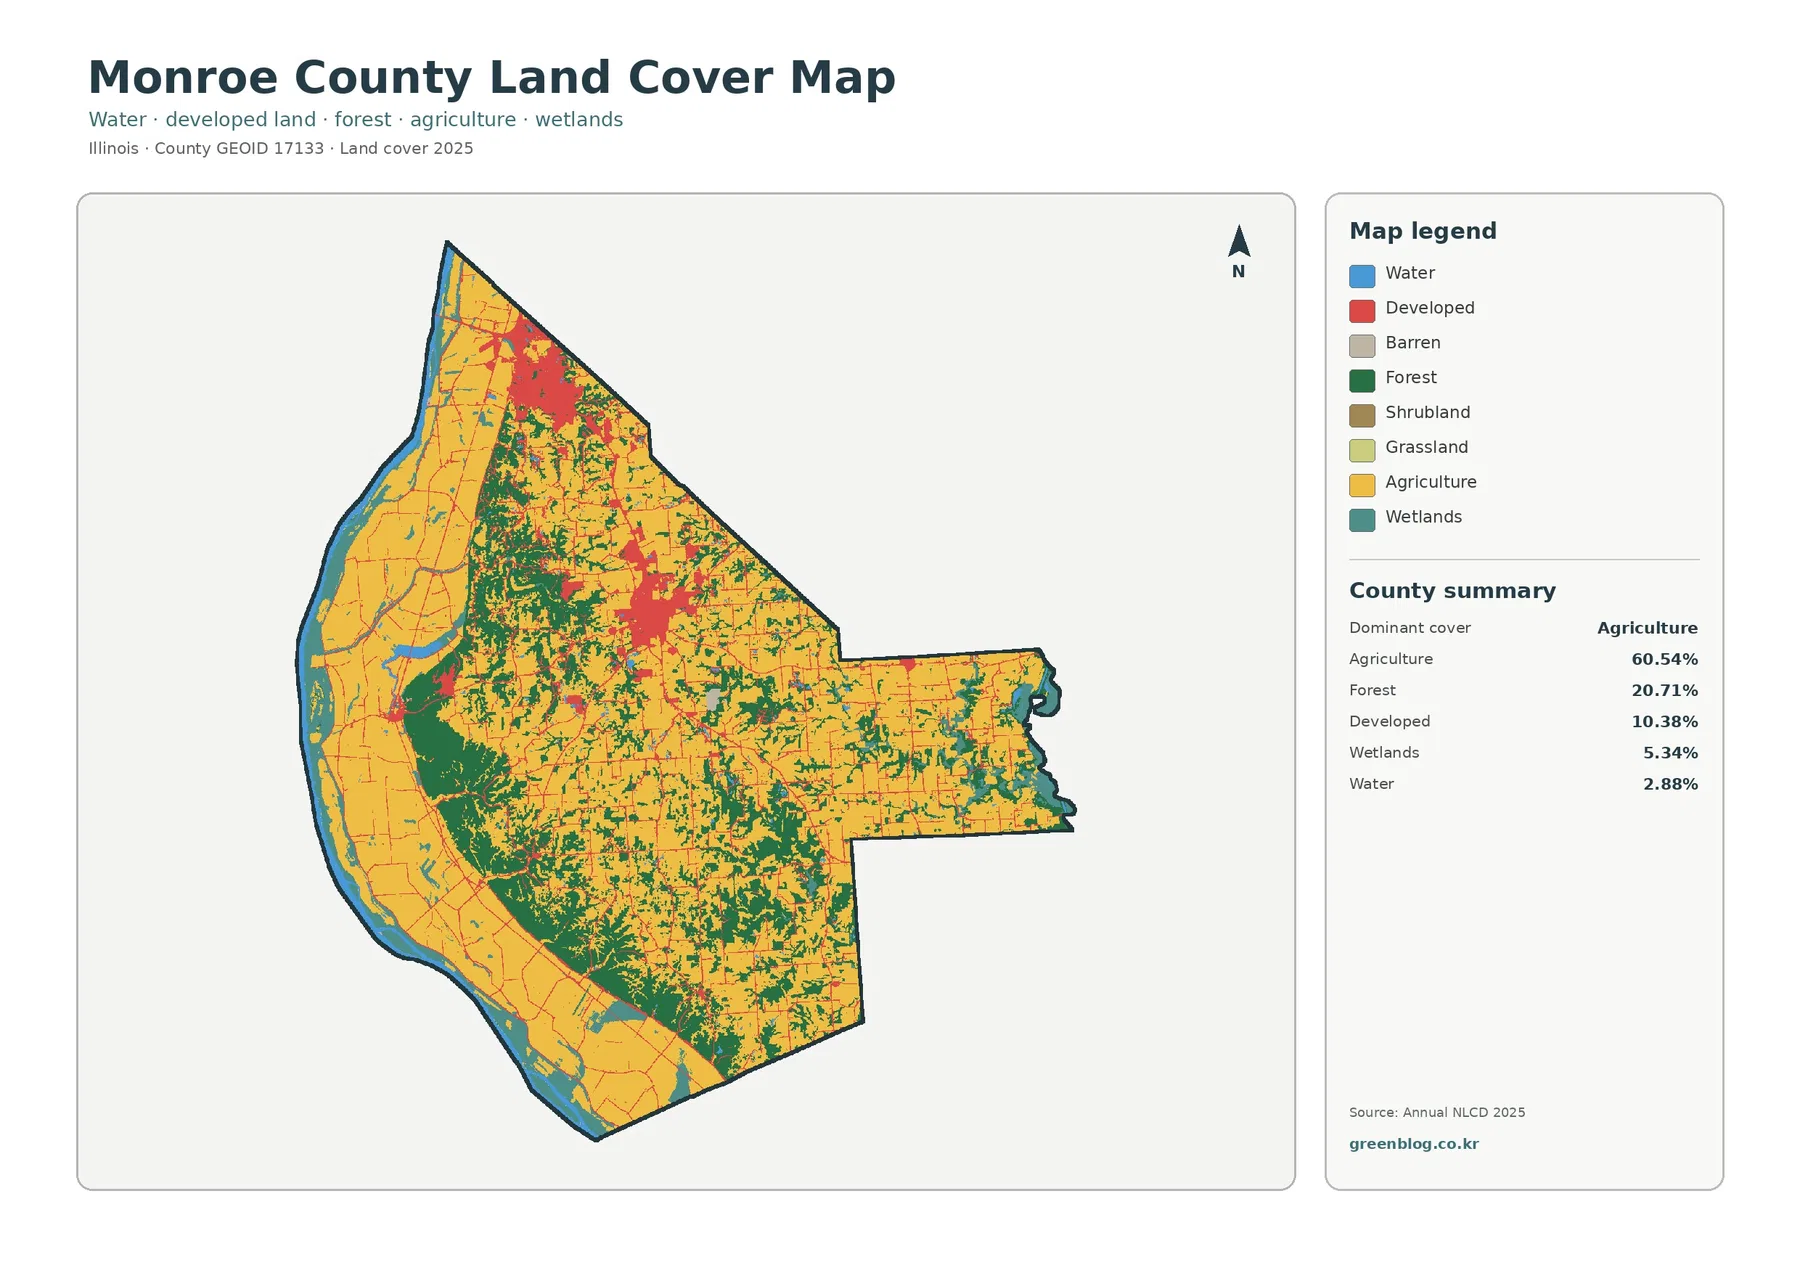
Agriculture covers 60.54% of Monroe County, making it the dominant class by a wide margin. Large yellow blocks fill the western river plain, much of the eastern section, and substantial areas in the north and south. Yet the map never becomes a single sheet of farm color. Forest breaks the agricultural pattern in a broad interior belt, while water and wetlands introduce another set of colors along the Mississippi side. This makes location just as important as the countywide percentage.
Forest accounts for 20.71%, a substantial share for a county where farming is the dominant class. The darkest green cover is especially extensive from the Valmeyer-area bluffs southward, with additional forest spreading through central and southern drainage corridors. Narrower wooded branches also cut into the farm country farther east. Instead of forming one isolated block, the forest cover changes from large connected areas near the bluffs to thinner, winding strips through the agricultural interior.
Developed land makes up 10.38%. The general map highlights Columbia in the north and Waterloo near the center, then shows smaller developed patches near other communities and roads. The land-cover class is broader than the impervious map because developed categories can include open space and vegetation within settled areas. Comparing the two maps is more informative than treating either as a complete picture of urban land.
Wetlands cover 5.34% and water 2.88%. Both are strongly associated with the western river side, where blue and teal areas run along the Mississippi and extend into low-lying land behind the main channel. The Illinois DNR describes a large Mississippi River State Fish and Wildlife Area with wetland management along the river valley. That regional context supports what the county map shows: the western edge contains a much more complicated mixture of farm fields, water, wetlands, and forest than the interior farm blocks.
These classes describe land cover, not legal land use. A satellite-based classification asks what covers the ground—crops, trees, water, wetland vegetation, or developed surfaces—not who owns the land or what a zoning ordinance permits there. That distinction is particularly important along the Mississippi floodplain, where a mapped wetland class is not the same thing as an official regulatory wetland boundary.
Forest and farmland meet most sharply along the western bluff belt
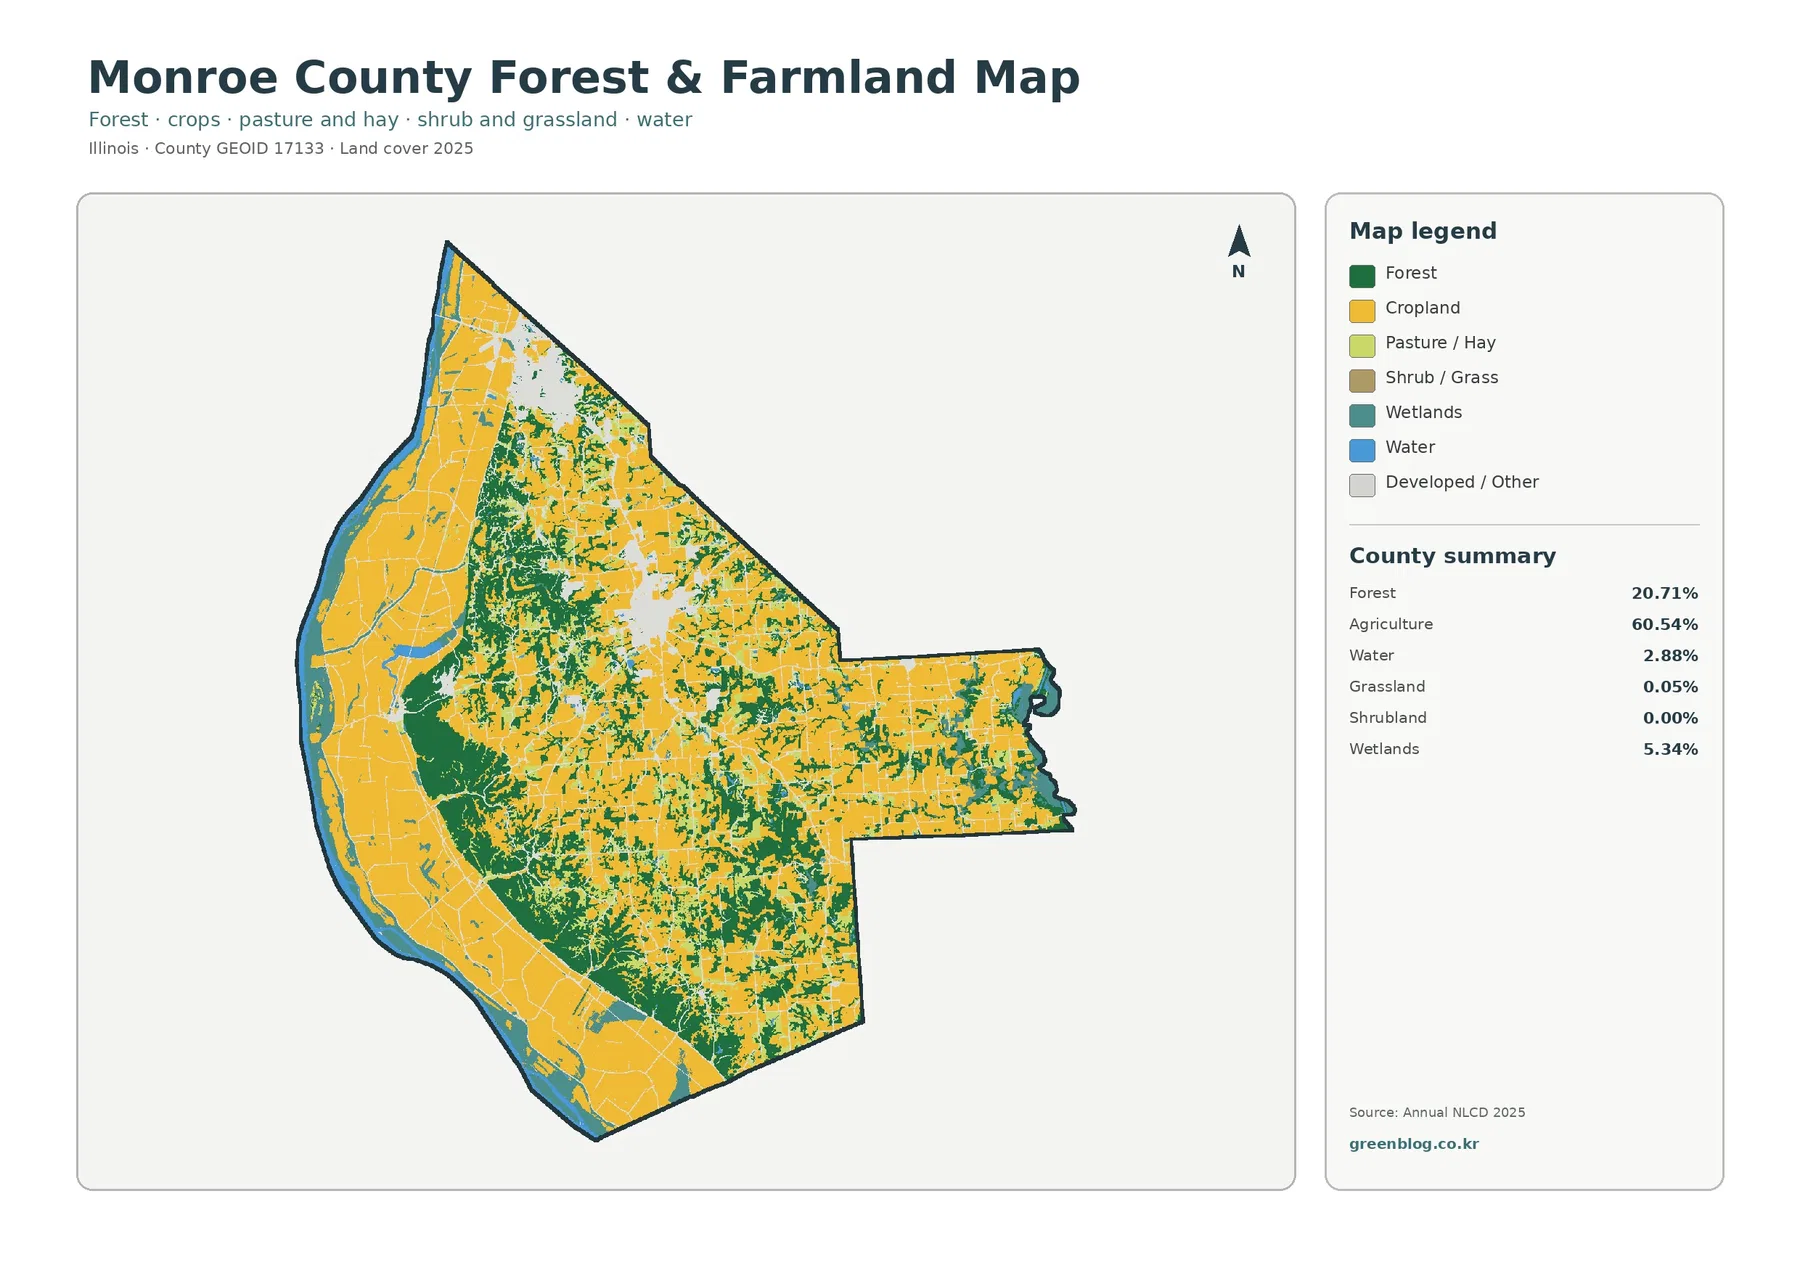
The forest-and-farmland view removes some of the visual competition from developed classes and makes the west-to-east transition easier to follow. Cropland fills much of the Mississippi floodplain, but a broad green forest zone rises just inland of it. Near Valmeyer and farther south toward Fults, that wooded area becomes one of the largest connected natural-cover features on any of the four maps.
Farther east, agriculture again becomes the main background. Forest remains visible as branching bands along small valleys and drainage lines, particularly through the central and southern parts of the county. These thin green corridors matter because they show that the 20.71% forest share is not confined to one preserve or one river bluff. Wooded cover also threads through the farm landscape well away from the Mississippi edge.
Water and wetlands are easiest to place when this map is compared directly with the general land-cover view. The blue and teal classes are concentrated on the western side, often beside cropland and near forested bluff margins. In the eastern part of the county, water and wetland areas are much smaller and more scattered. A classroom exercise can use this contrast to show how the same dominant agricultural class occurs in two very different surroundings.
Annual NLCD products classify the landscape in 30-meter raster cells. A raster cell is simply one square unit in the map grid. If a narrow tree line, small pond, farm road, and crop field all fall within or near the same cells, some small features may be generalized into the dominant mapped class. For that reason, the forest edge on this county-scale map should not be treated as a surveyed property or vegetation boundary.
The 1985–2025 comparison highlights development near towns but also many non-development class differences
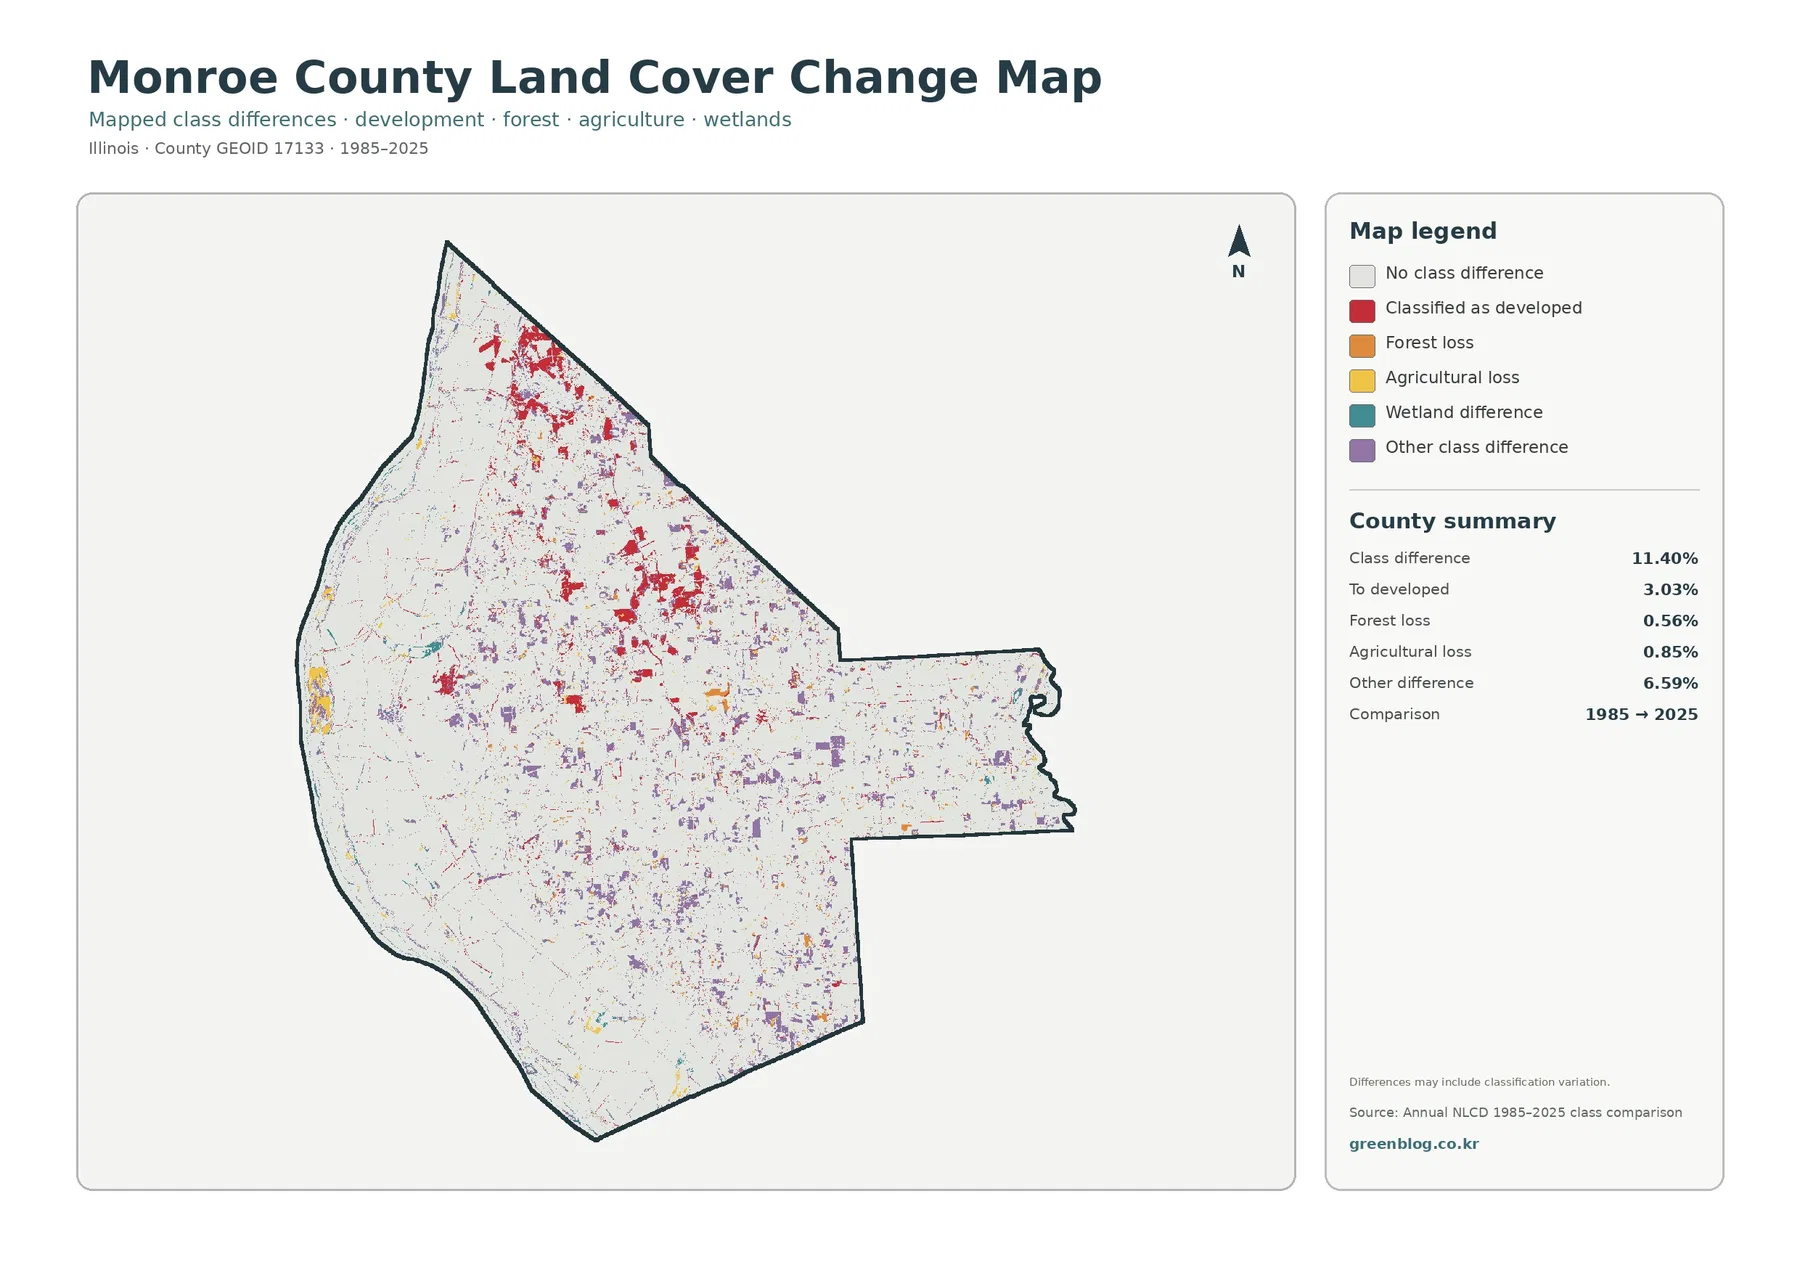
The change map reports that 11.40% of cells had a different mapped class between 1985 and 2025. The summary identifies 3.03% as change to developed, 0.56% as forest loss, 0.85% as agricultural loss, and 6.59% as other class difference. Wetland differences are also shown in the legend, but the map summary does not provide a separate percentage for that category. The total should therefore be read as class difference, not as an 11.40% development increase.
Red developed-change cells are most conspicuous near Columbia in the north and around Waterloo in the center. Smaller red patches follow roads and appear near other settlements. Comparing this map with the current impervious-surface layer helps separate two questions: where hard surfaces are concentrated now, and where the broad land-cover classification differs from the 1985 class.
The Mississippi side contains a more mixed set of change colors. Agricultural-loss, wetland-difference, and other-difference cells appear near the river-bottom landscape, while forest-loss cells are scattered in smaller patches. River levels, wet conditions, crop state, image timing, and classification methods can all influence how some lowland cells are assigned. The map itself notes that differences may include classification variation, so small patches should not automatically be described as permanent land conversion.
The “other class difference” category is the largest reported component at 6.59%. That alone is a reason to use caution with simple before-and-after claims. If a specific forest, farm, or wetland parcel matters, the next step should be to check intermediate-year aerial photographs or more detailed local records. This map is most useful for locating areas that deserve a closer look, not for assigning a cause and date to every colored pixel.
Four ways to use the set without making the maps say more than they do
For a general county profile, start with the 2025 land-cover map. It shows the agricultural majority, the bluff-forest belt, river wetlands and water, and the Waterloo–Columbia development pattern in one view. For a natural-cover discussion, switch to the forest-and-farmland map, where the transition from Mississippi floodplain crops to wooded bluffs is easier to see.
If the topic is settlement or built surface, the impervious map is the better first choice. It shows Waterloo and Columbia as the strongest clusters and reveals the rural road network with much less visual noise. For long-term comparison, use the 1985–2025 map, but keep its legend visible so viewers can distinguish development classification from forest loss, agricultural loss, wetland difference, and the broader other-difference category.
The western side of the county is a useful place to compare maps side by side. On the general map, the Mississippi floodplain contains agriculture, water, wetlands, and forest. On the forest-and-farmland version, the broad contrast between crop fields and the bluff woods is stronger. The impervious map then shows how little hard surface occupies most of that same lowland compared with Waterloo and Columbia.
At the county scale, these maps work well for teaching, presentation graphics, regional comparison, and choosing areas for more detailed research. They are not substitutes for parcel surveys, wetland determinations, zoning maps, floodplain engineering, or current site inspections. Enlarging the JPG can make labels and patterns easier to see, but it cannot create details that were not present in the original 30-meter classification.
What is included in the Monroe County JPG download
The ZIP contains one original JPG for each map used on this page: 2025 land cover, forest and farmland, impervious surface and developed land, and 1985–2025 land-cover change. Each image is 2480×1754 pixels. Choose the general map for an overview, the forest-and-farmland map for the bluff transition, the impervious map for town and road surfaces, or the change map when the two-date comparison is the main subject.
Frequently Asked Questions
What is the largest land-cover class in Monroe County?
Agriculture is the largest 2025 class at 60.54%. Forest is second at 20.71%, followed by developed land at 10.38%, wetlands at 5.34%, and water at 2.88%. The countywide percentages are useful, but the western bluff and Mississippi River areas have a much more forested and wetland-rich mix than the agricultural average suggests.
Why is so much forest concentrated near Valmeyer and Fults?
Those communities are close to the Mississippi River bluff corridor. Illinois DNR descriptions of White Rock and Fults Hill Prairie identify upland forest, steep bluff terrain, hill prairie, and other natural communities in that part of Monroe County. The land-cover maps show the same general area as one of the county’s broadest concentrations of forest.
Does the 11.40% change figure mean Monroe County became 11.40% more developed?
No. The 11.40% figure is the share of mapped cells whose land-cover class differed between 1985 and 2025. The map separately reports 3.03% classified as change to developed, 0.56% forest loss, 0.85% agricultural loss, and 6.59% other class difference. Classification variation can also contribute to some mapped differences.
Map File Information
Download the four original Monroe County, Illinois JPG maps in one ZIP: 2025 land cover, forest and farmland, impervious surface and developed land, and 1985–2025 land-cover change.
- Included Files: Use only the versions confirmed in the article and supplied images
- File Type: Use the confirmed download contents
- Intended Use: Printing, education, presentations, and map-based projects
Related Maps
- Adams County Illinois Land Cover Map
- Alexander County Illinois Land Cover Map
- Bond County Illinois Land Cover Map
Sources and References
- MRLC Annual NLCD Data — annual land-cover and related datasets
- USGS Annual NLCD Land Cover Classification — class definitions and the 30-meter mapping framework
- U.S. Census Bureau TIGER/Line Shapefiles — county boundary reference
- Monroe County, Illinois official website — county and community background including Waterloo, Columbia, and Valmeyer
- Illinois DNR White Rock Nature Preserve — bluff-corridor upland forest and hill-prairie context
- Illinois DNR Fults Hill Prairie Nature Preserve — forest, hill prairie, limestone features, and bluff landscape near Fults
Green Map creates custom-edited map images using open geographic data sources such as geoBoundaries, Natural Earth, OpenStreetMap, and government open data.
These maps are edited visual materials, not raw data files, and are provided for education, documents, presentations, and graphic reference.