Jo Daviess County, Illinois has a farm-dominant 2025 land-cover mix, but the western half is broken up by extensive forest and a broad water margin. Agriculture accounts for 62.38% of the county, forest 23.96%, developed land 7.27%, wetlands 2.73%, and water 2.30%. The eastern side contains larger continuous agricultural blocks, while forest becomes denser and more branching toward the center and west.
Four map views are included on this page: overall land cover, forest and farmland, impervious/developed land, and 1985–2025 class differences. The four original JPG maps are also available in one download. Together they help separate the county’s present surface pattern from the distribution of hard surfaces and from cells whose classifications differ between the two comparison years.
Table of Contents
A western water margin and dense wooded branches distinguish the county from its broader eastern farm blocks
Agricultural cover fills much of the east and northeast, where yellow fields form broad, relatively continuous areas. Moving westward, dark green forest appears more frequently and in larger connected pieces. Along the western boundary, blue water forms a long, wide strip that sharply contrasts with the fields farther inland. The countywide 62.38% agriculture figure therefore hides a strong east-to-west change in map texture.
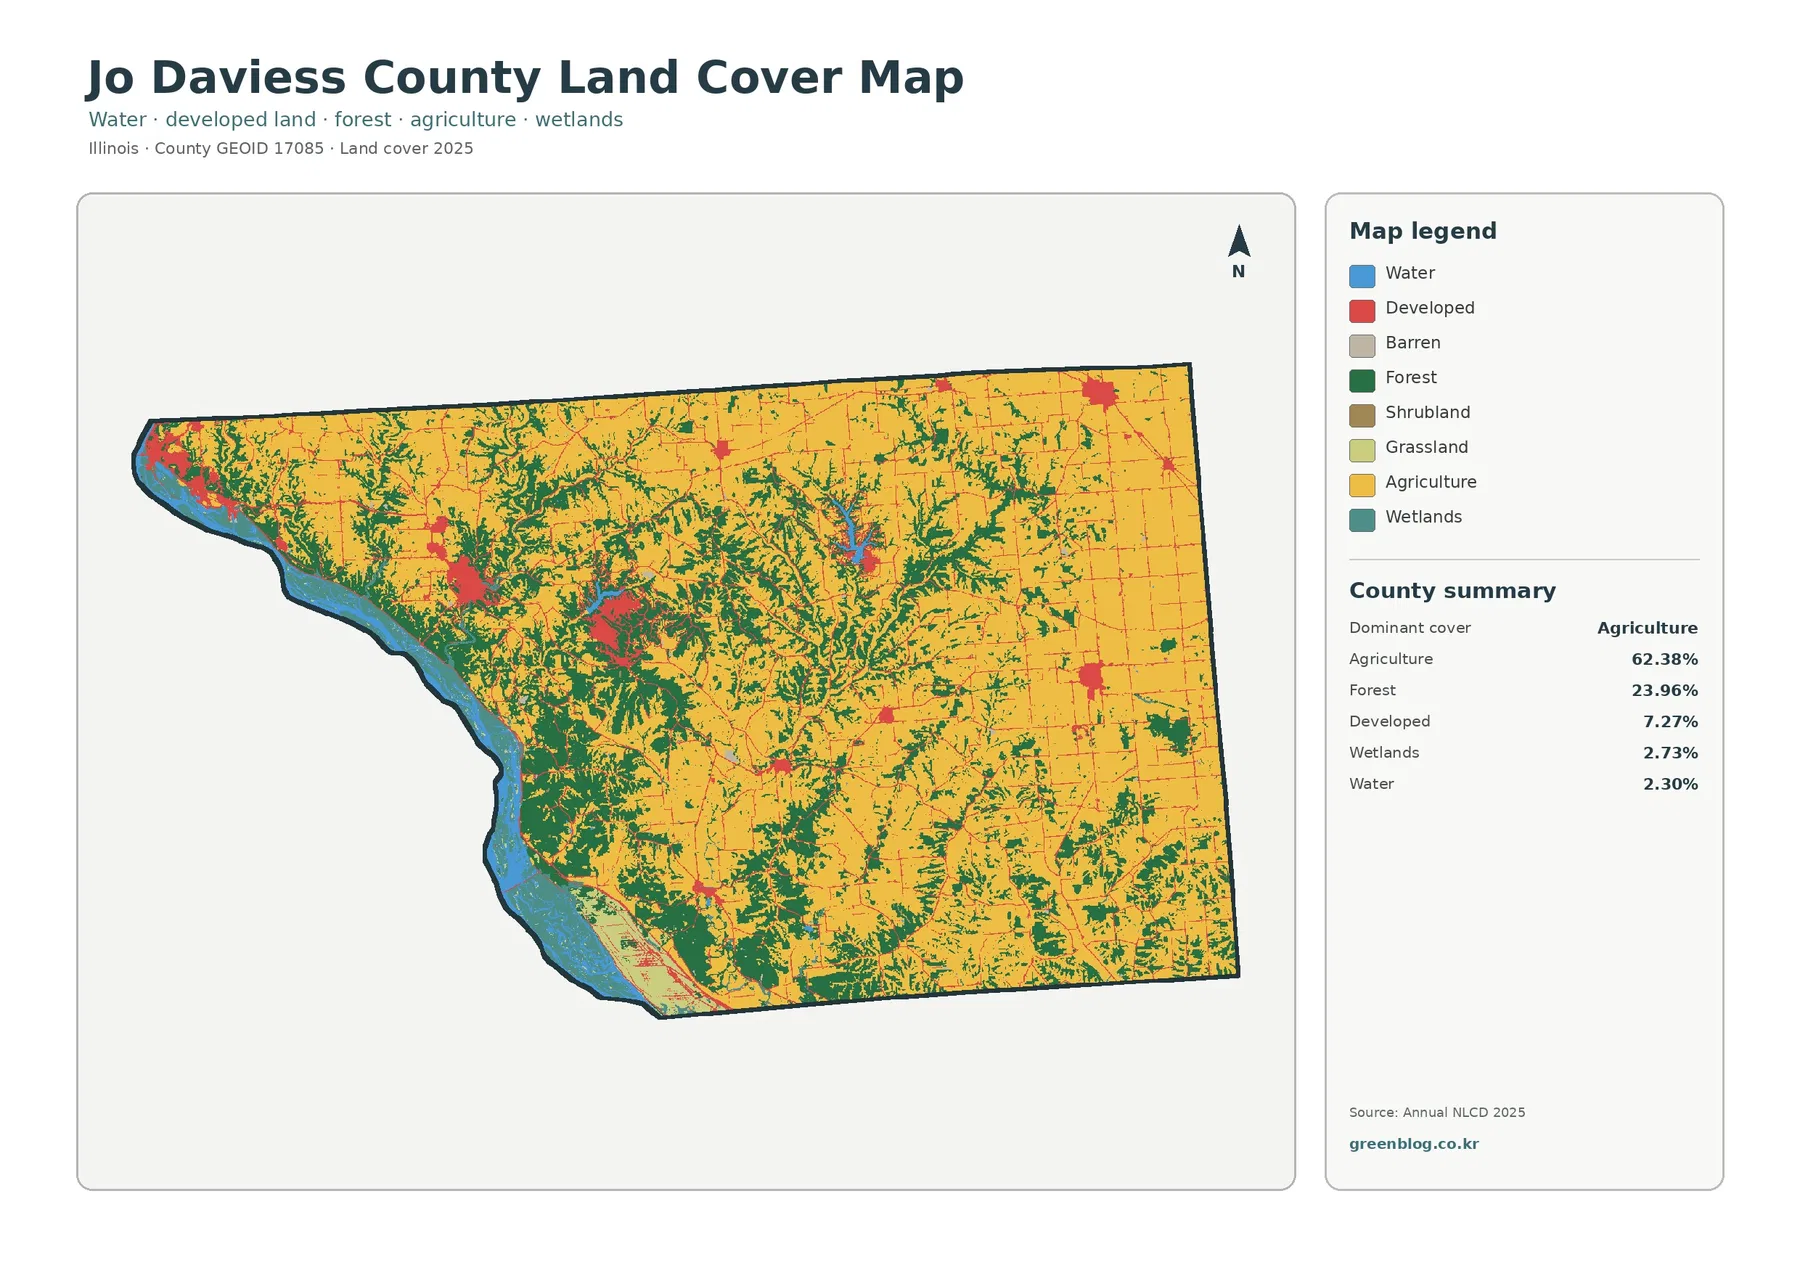
Forest is especially prominent through the western and central parts of the county. Some wooded areas form broad blocks near the western side, while others narrow into branching strips that cut through agricultural land. North-central and south-central areas also contain frequent wooded pieces. Farther east, forest is generally more fragmented and agricultural fields become more continuous.
Wetlands make up 2.73% of the summary and appear most noticeably near the western water edge, with smaller patches scattered elsewhere. Water covers 2.30%, but its long boundary feature gives it greater visual importance than the percentage alone suggests. These mapped wetland and water classes describe surface cover; they should not be treated as legal wetland boundaries, flood zones, or parcel limits.
The forest-and-farmland view clarifies how wooded corridors cut through a 62.38% agricultural landscape
The forest-and-farmland map removes much of the developed-land color and makes the relationship between fields and woods easier to follow. Agriculture remains the largest class, yet green forest forms a dense network across the west and center. The east contains wider yellow blocks with fewer interruptions, while the middle of the county has a more intricate mix of field patches and branching forest.
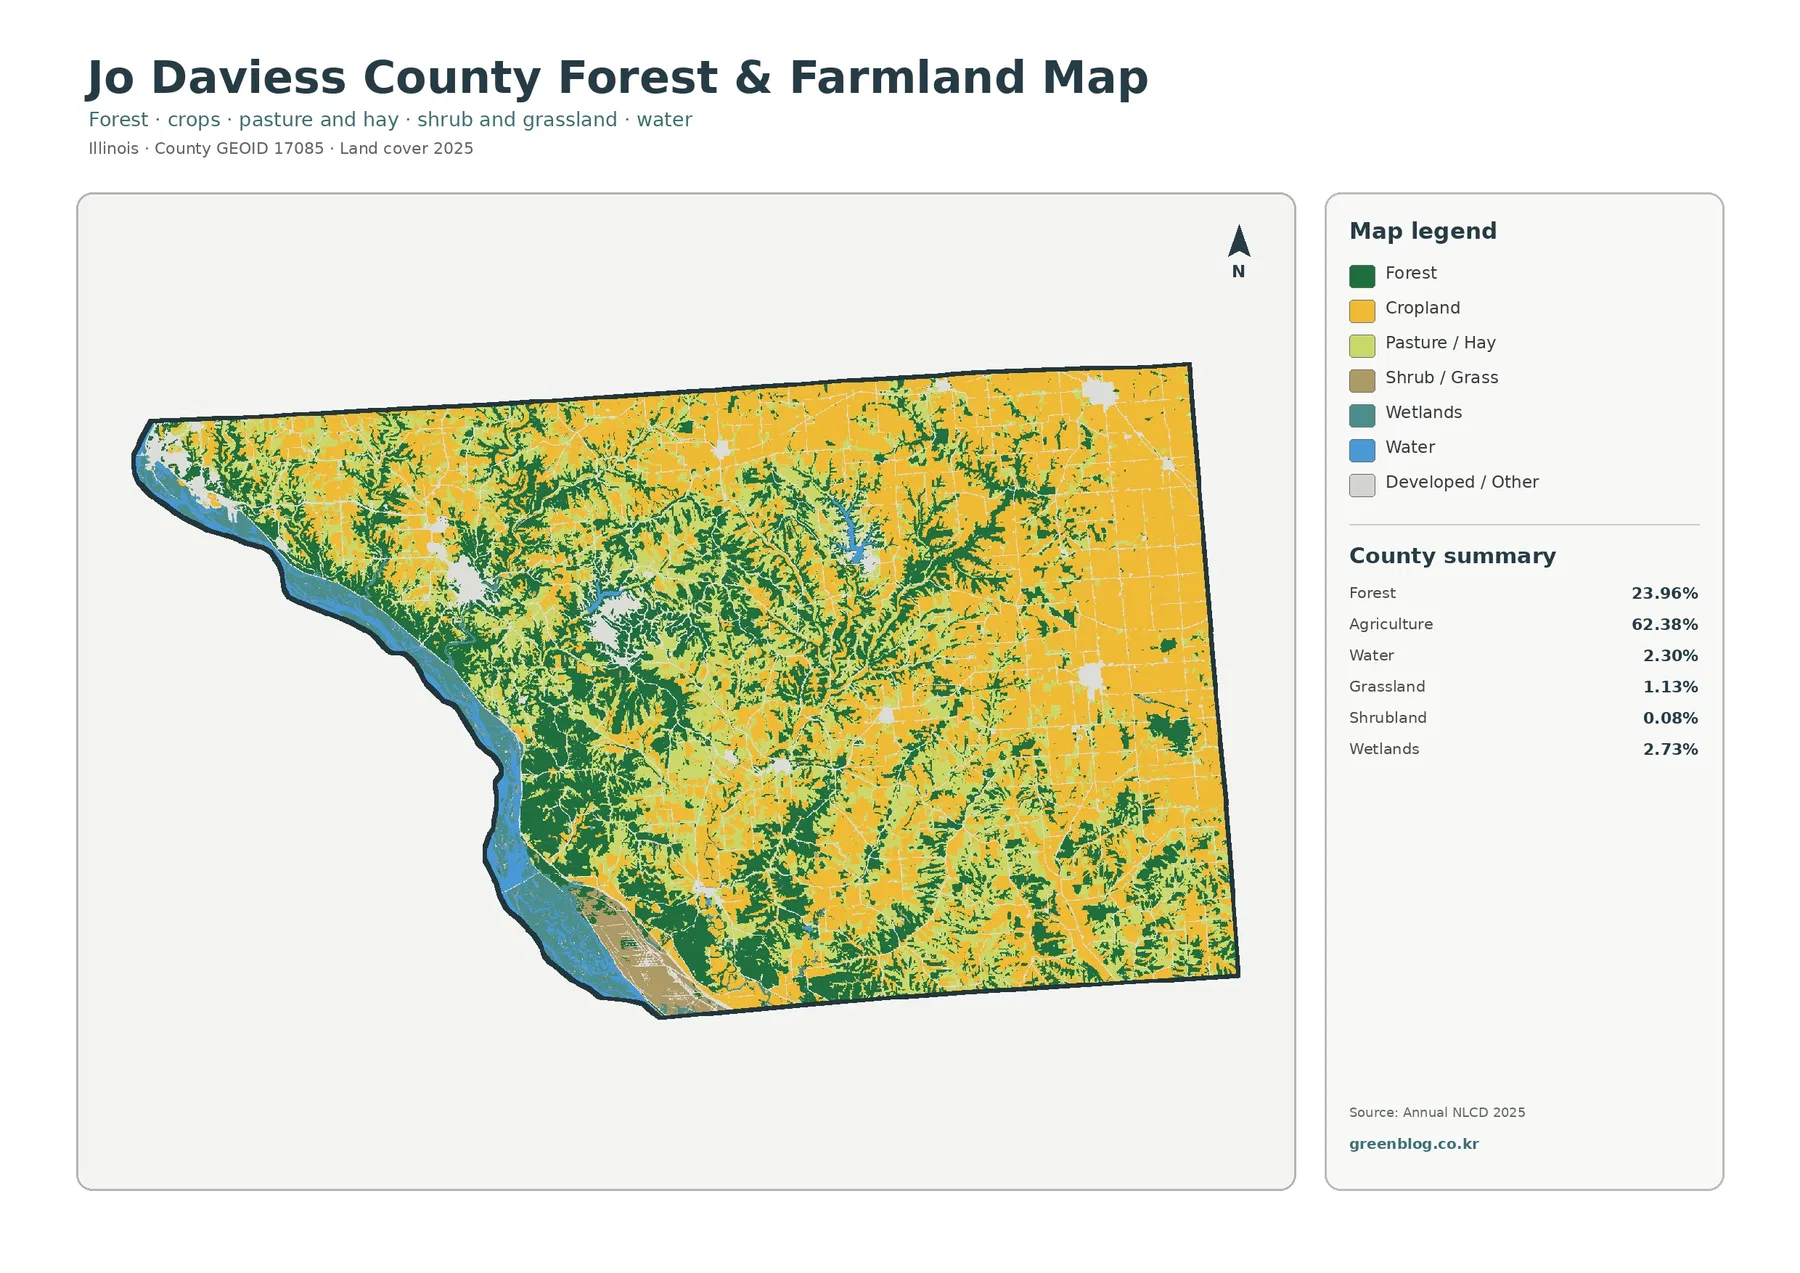
The western half is not simply forested; farmland remains present between wooded strips and near the water margin. Central areas show the most interlocking pattern, with green branches repeatedly dividing agricultural blocks. In the east, fields are generally larger and more rectangular, although smaller wooded pieces remain along internal corridors and edges.
Grassland is listed at 1.13% and shrubland at only 0.08%. Neither class is large enough to define the countywide landscape, although grassland patches appear in small pockets among fields and woods. Forest and agriculture are therefore the most useful classes for explaining the county’s internal pattern, with water and wetlands adding an important western contrast.
Built surfaces form several separated nodes rather than one continuous urban belt
Developed land accounts for 7.27% of the county, but it is spread among several distinct clusters. Strong developed concentrations appear near the far western side, in the west-central area, near the middle, and at smaller points toward the north and east. Thin developed lines follow roads between these centers. Large spaces between them remain agricultural or wooded.
Impervious surface is a narrower measure that focuses on hard surfaces such as pavement, parking areas, and rooftops. Jo Daviess County has a mean impervious value of 1.52%, and 0.53% of the county reaches 50% impervious or greater. These numbers are much lower than the 7.27% developed-land share because developed land-cover classes can still contain lawns, trees, soil, and other permeable surfaces.
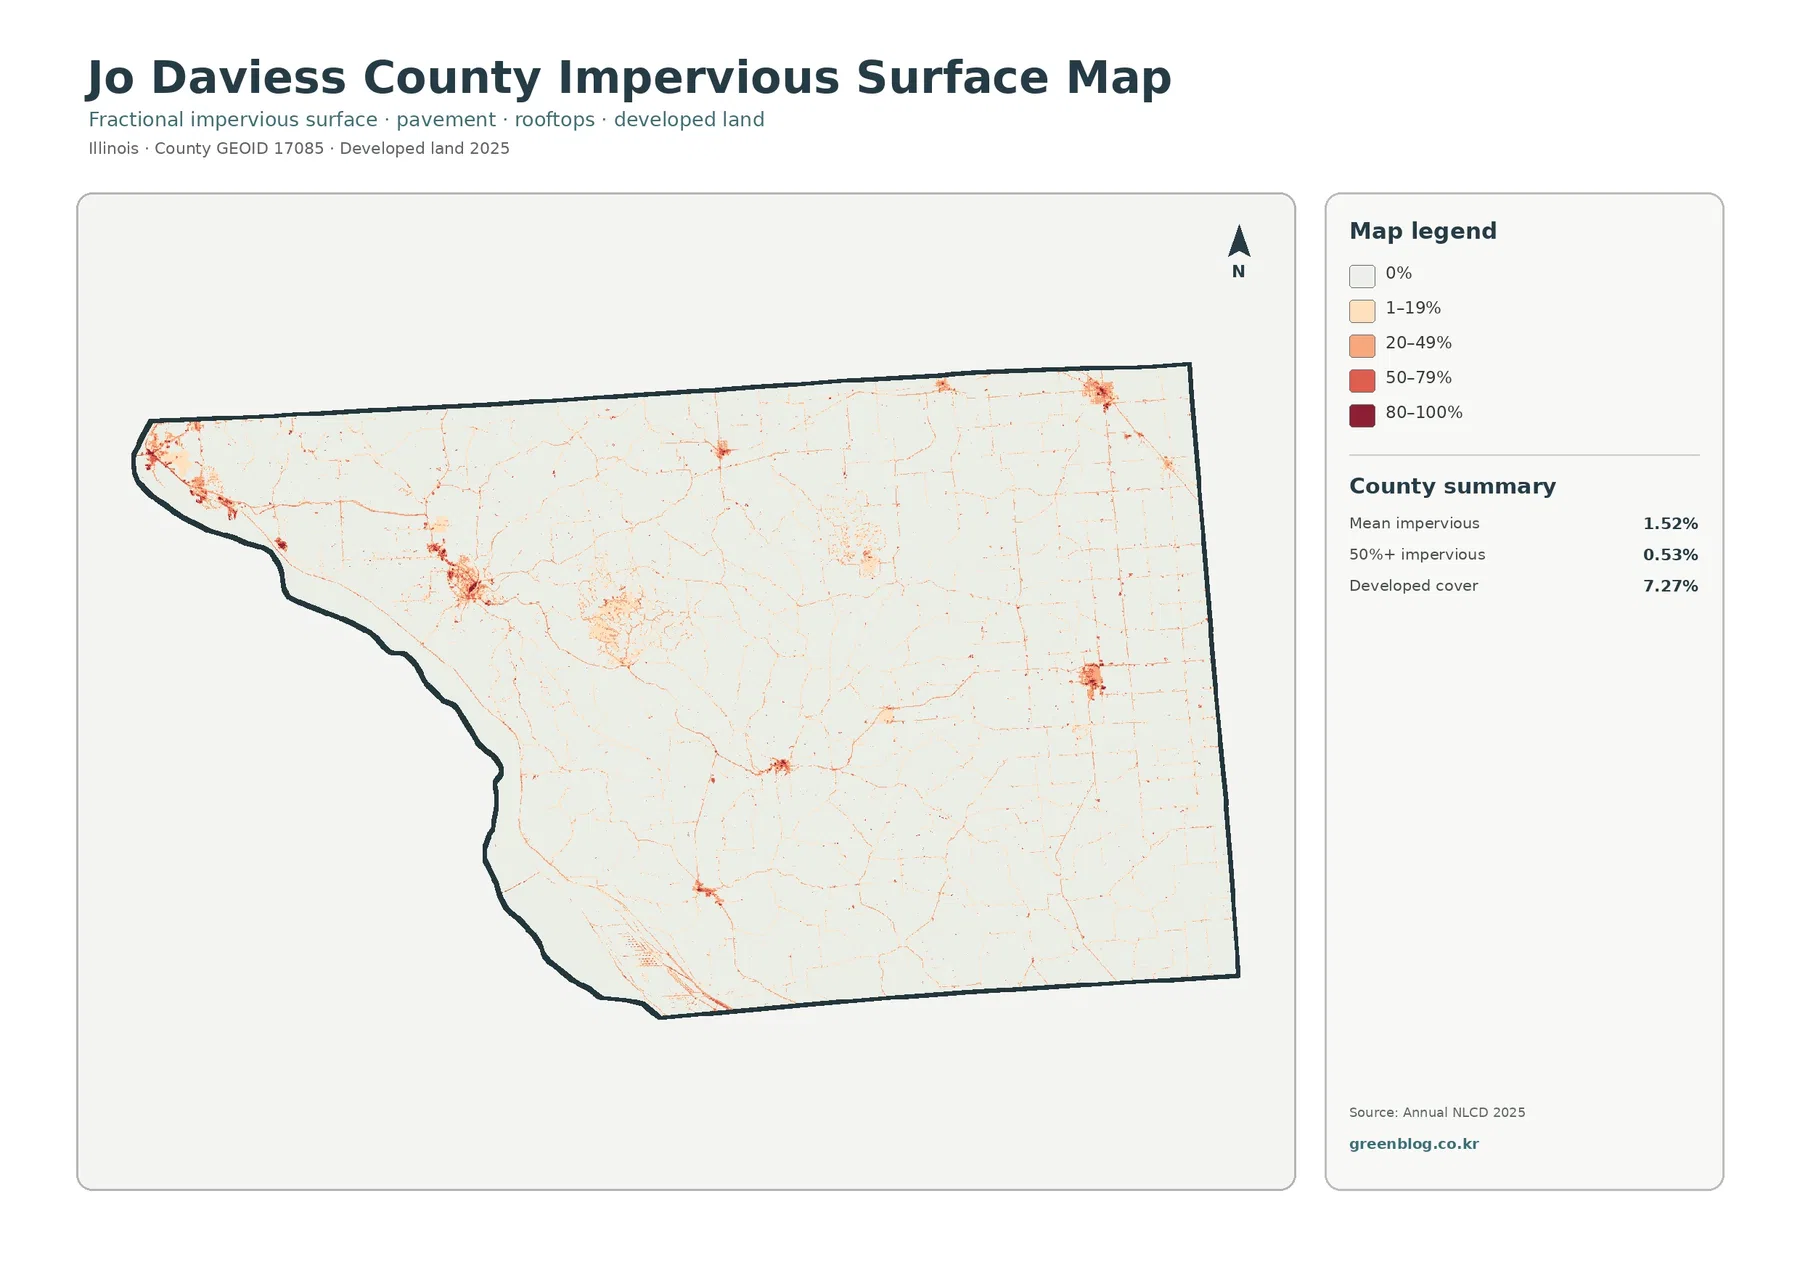
The darkest impervious patches appear in the western and west-central settlement clusters, with additional concentrations near the middle and at smaller eastern nodes. Roads create a fine orange network across the county, but most of the mapped area remains very light. That pattern explains why the countywide mean stays low despite several recognizable developed centers.
The 1985–2025 comparison shows widespread class differences, but most are not labeled as development or forest loss
Jo Daviess County has a 17.91% overall class-difference value between 1985 and 2025. The summary identifies 1.44% as classified to developed, 0.80% as forest loss, 0.87% as agricultural loss, and 14.46% as other class difference. That last category dominates the total, so the countywide number should not be treated as a direct measure of urban growth, forest clearing, or farmland loss.
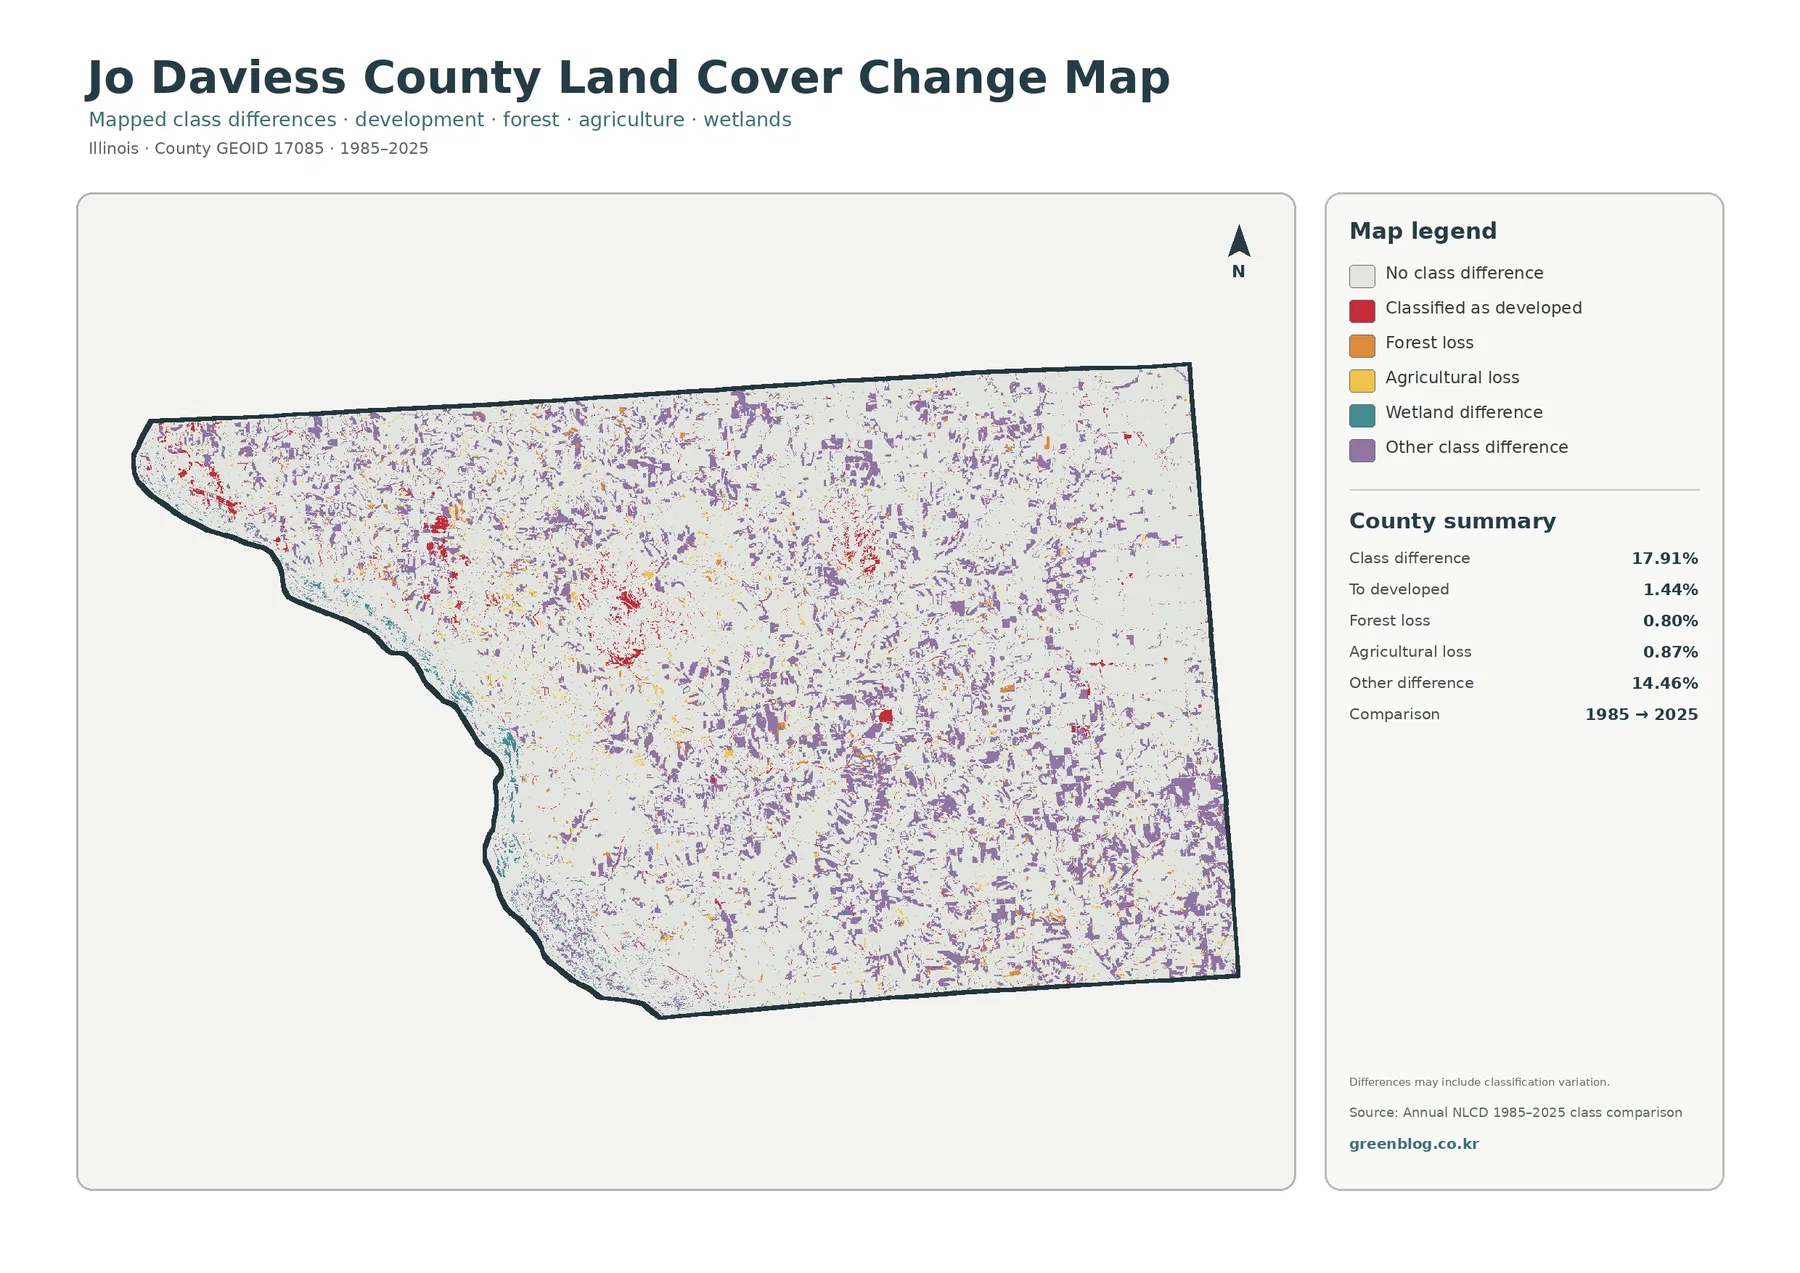
Purple other-class differences are distributed across much of the county, with larger concentrations in parts of the center, north, east, and west. Red developed differences are more visible around present-day settlement nodes and in several western clusters. Agricultural-loss and forest-loss colors appear as smaller pieces rather than one broad conversion front.
A difference between two mapped classes can reflect actual surface change, but it can also be influenced by imagery, vegetation, moisture, classification methods, or mixed pixels. The change map notes that classification variation may be included. For a specific site, the layer is most useful as a screening tool that identifies places worth checking against other imagery or local records.
A four-map sequence makes the western water edge, farm interior, development nodes, and long-term differences easier to separate
The general land cover map is the best starting point for explaining Jo Daviess County as a whole because it shows fields, forest, developed land, wetlands, and water together. The western water margin and the denser western forest immediately stand out against the broader agricultural east. The forest-and-farmland map then simplifies that pattern and makes the branching wooded network easier to compare with field blocks.
Use the impervious map when the question is where hard surfaces are concentrated. It shows why several visible developed clusters do not translate into a high countywide impervious average. The change map serves a separate purpose by comparing classification endpoints. Keeping the current maps and the historical comparison in separate panels reduces the chance that a class-difference color will be mistaken for present-day land cover.
Raster resolution and observation year matter most along narrow forest strips and the western water boundary
Annual NLCD products are commonly represented with roughly 30-meter raster cells. A raster divides the ground into a grid and assigns each cell a representative class or value. Where one cell contains more than one surface—such as cropland beside forest or water beside wetland—the map may simplify that mixed ground into a single classification.
This limitation is important in Jo Daviess County because many forest features are narrow and branching, while the western water and wetland boundaries contain complex edges. Small roads and compact developed nodes can also be generalized at this scale. The mapped shapes should not be treated as parcel surveys, and the forest, wetland, or developed classes do not define ownership, protection status, or zoning.
Frequently Asked Questions
Where is the clearest contrast between agriculture and forest in Jo Daviess County?
Agriculture is broader and more continuous toward the east and northeast, while forest becomes denser and more branching across the center and west. Countywide, agriculture is 62.38% and forest is 23.96%.
Why is developed land 7.27% while mean impervious cover is only 1.52%?
Developed land-cover classes can include lawns, trees, soil, and other permeable surfaces. Hard surfaces are concentrated in several settlement nodes and along roads, so the countywide impervious mean is much lower.
Does the 17.91% 1985–2025 class difference equal physical land-use change?
Not necessarily. Real change may be included, but imagery, vegetation, moisture, classification methods, and mixed pixels can also affect the comparison. Other class difference accounts for 14.46% of the county.
Map File Information
The download combines four original JPG maps for Jo Daviess County: 2025 land cover, forest and farmland, impervious/developed land, and the 1985–2025 land-cover class comparison.
- Included Versions: Land Cover Map, Forest & Farmland Map, Impervious/Developed Land Map, and 1985–2025 Land Cover Change Map
- File Type: One ZIP containing four JPG files
- Intended Use: agriculture/forest comparison, western water and wetland review, built-surface patterns, class-change reference, teaching, and presentations
Related Maps
- Adams County Illinois Land Cover Map
- Alexander County Illinois Land Cover Map
- Bond County Illinois Land Cover Map
Sources and references
- MRLC Annual NLCD Data – official access point for Annual NLCD land-cover and impervious-surface products.
- USGS Annual NLCD Land Cover Classification – official documentation for land-cover classes and raster interpretation.
- U.S. Census Bureau TIGER/Line Shapefiles – official geographic boundary source for Jo Daviess County.
Green Map creates custom-edited map images using open geographic data sources such as geoBoundaries, Natural Earth, OpenStreetMap, and government open data.
These maps are edited visual materials, not raw data files, and are provided for education, documents, presentations, and graphic reference.