Henderson County, Illinois has a strongly agricultural interior, yet its western edge gives the county a much more varied land-cover pattern than the 72.38% agricultural share suggests. Forest accounts for 12.22%, wetlands for 4.68%, water for 4.10%, and developed land for 5.95%. The four maps below separate those patterns so the western water-and-wetland belt, interior fields, forest strips, built centers, and long-term class differences can be compared without mixing them together.
The four original JPG maps are available together in one download. The WebP versions on this page are useful for quick comparison, while the JPG set works better for printing, presentations, and side-by-side review. Each map answers a different practical question, from where agriculture dominates to where hard surfaces are concentrated.
Table of Contents
The western edge is the best place to start when reading Henderson County
A broad band of blue and teal follows much of the county’s western side on the 2025 land cover map. Water covers 4.10% of the county and wetlands cover 4.68%, and both classes are much more visually concentrated there than in the interior. The widest patches appear around the middle and southern portions of that edge, where water, wetlands, forest, and agriculture meet along an irregular boundary.
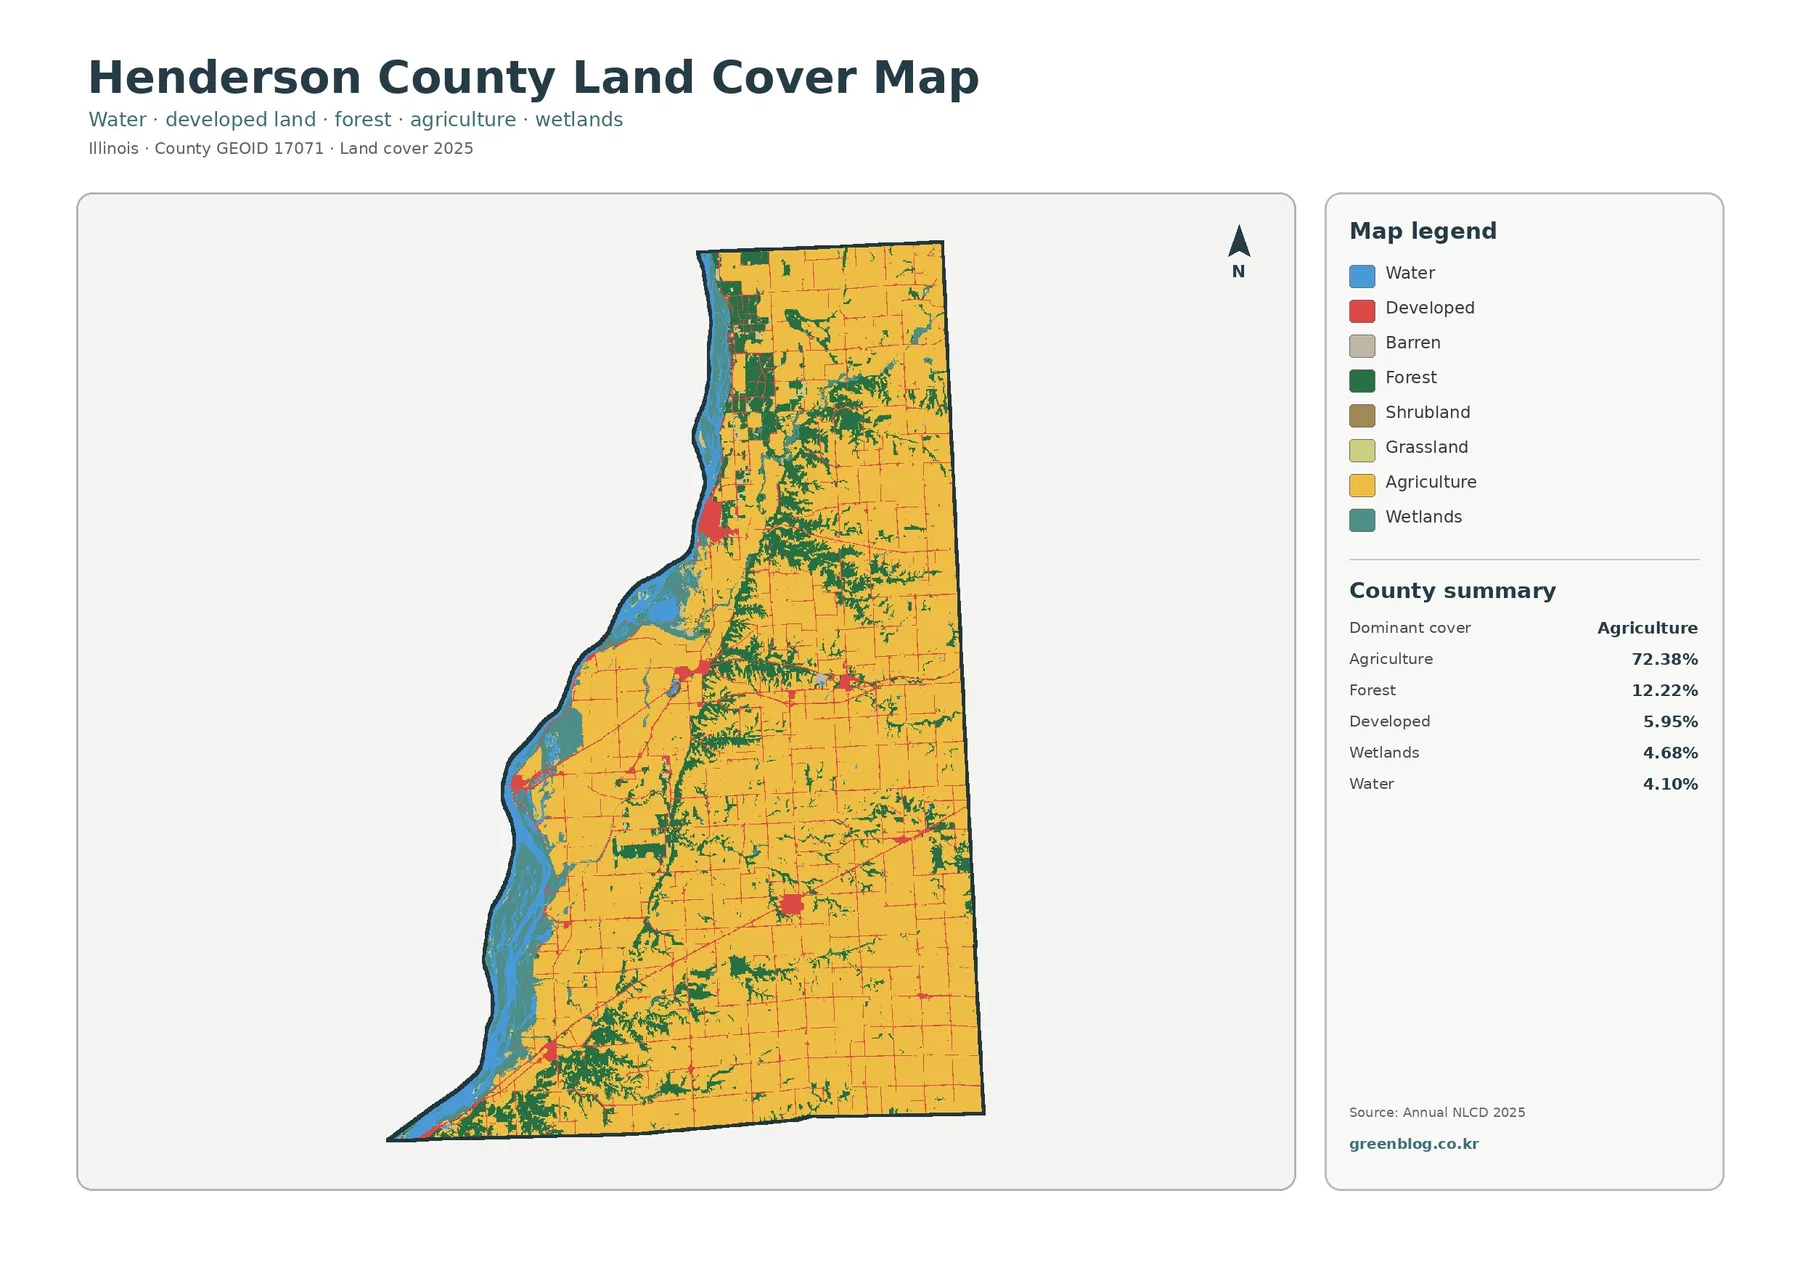
Moving east from that edge, large yellow agricultural blocks quickly become the dominant surface. The eastern half and much of the south-central area are especially farm-dominant, with narrow developed lines and smaller green forest pieces cutting through the fields. Forest is more frequent in the northwest and through several central and southern belts, creating a broken network rather than one continuous block.
Built surfaces form several separate nodes instead of one continuous urban area
Developed land makes up 5.95% of the 2025 summary, but most of that class is not spread evenly across Henderson County. One of the most obvious clusters sits near the middle of the county, with road lines extending east and west. A smaller but noticeable cluster appears near the northwest, and another stands out farther south and east. Between those centers, agriculture remains the main cover.
The impervious map makes the concentration even clearer. Mean impervious cover is only 1.43%, and the share at 50% impervious or greater is 0.41%. Hard surfaces such as pavement and rooftops appear darkest at the compact settlement centers and along connecting roads, while most agricultural and forested areas remain very light.
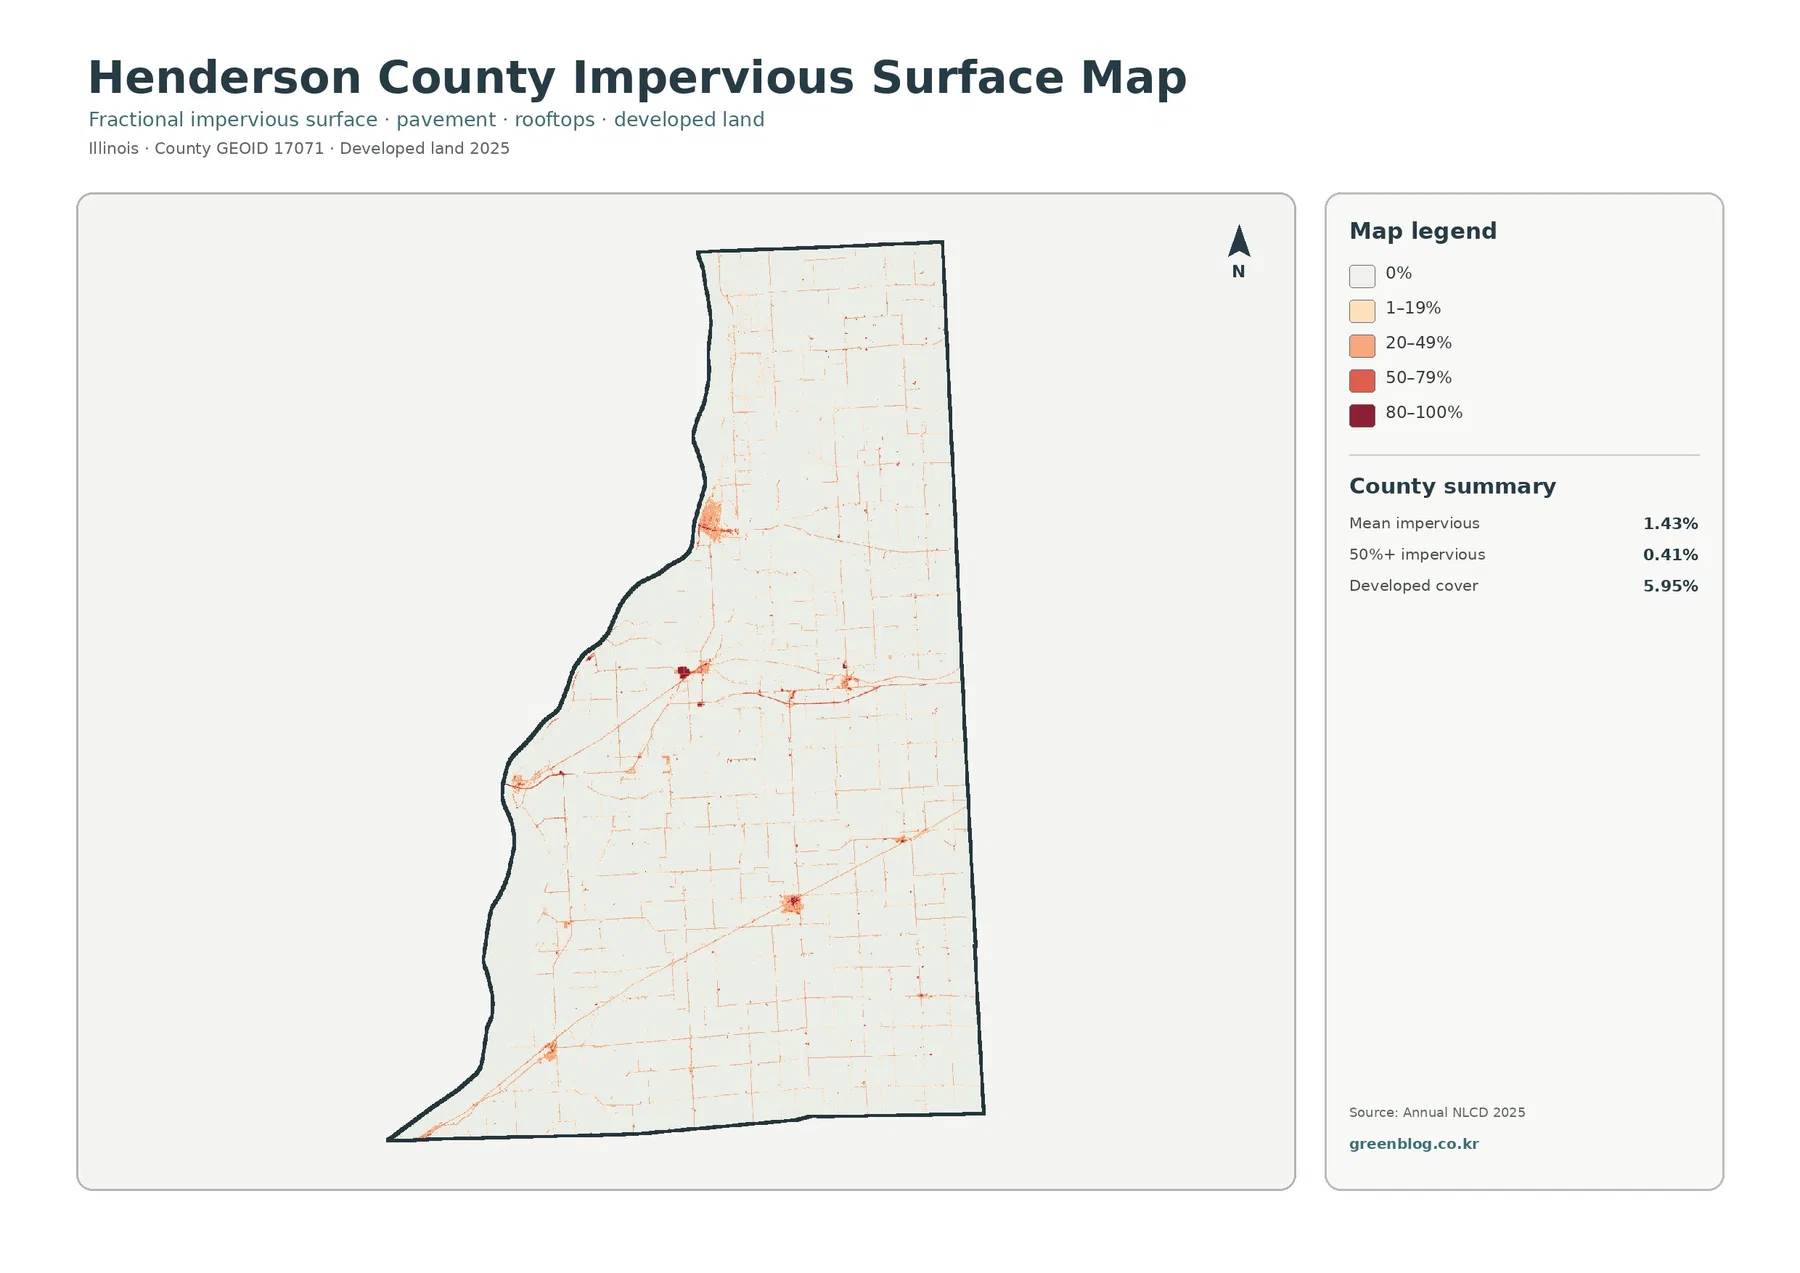
That difference between 5.95% developed land and 1.43% mean impervious cover is expected. Developed land-cover classes can include lawns, trees, soil, and other permeable surfaces around buildings and roads. Impervious cover measures only the hard-surface fraction. Looking at both maps prevents the common mistake of treating every developed pixel as fully paved.
Forest belts become easier to follow once developed detail is removed
The forest-and-farmland map simplifies the picture by placing greater emphasis on fields, woods, wetlands, and water. Agriculture still fills most of the county, but the 12.22% forest share is easier to follow as a series of green belts and blocks. Wooded cover is especially noticeable in the northwest, across portions of the middle, and in the south, where it separates or borders large agricultural areas.
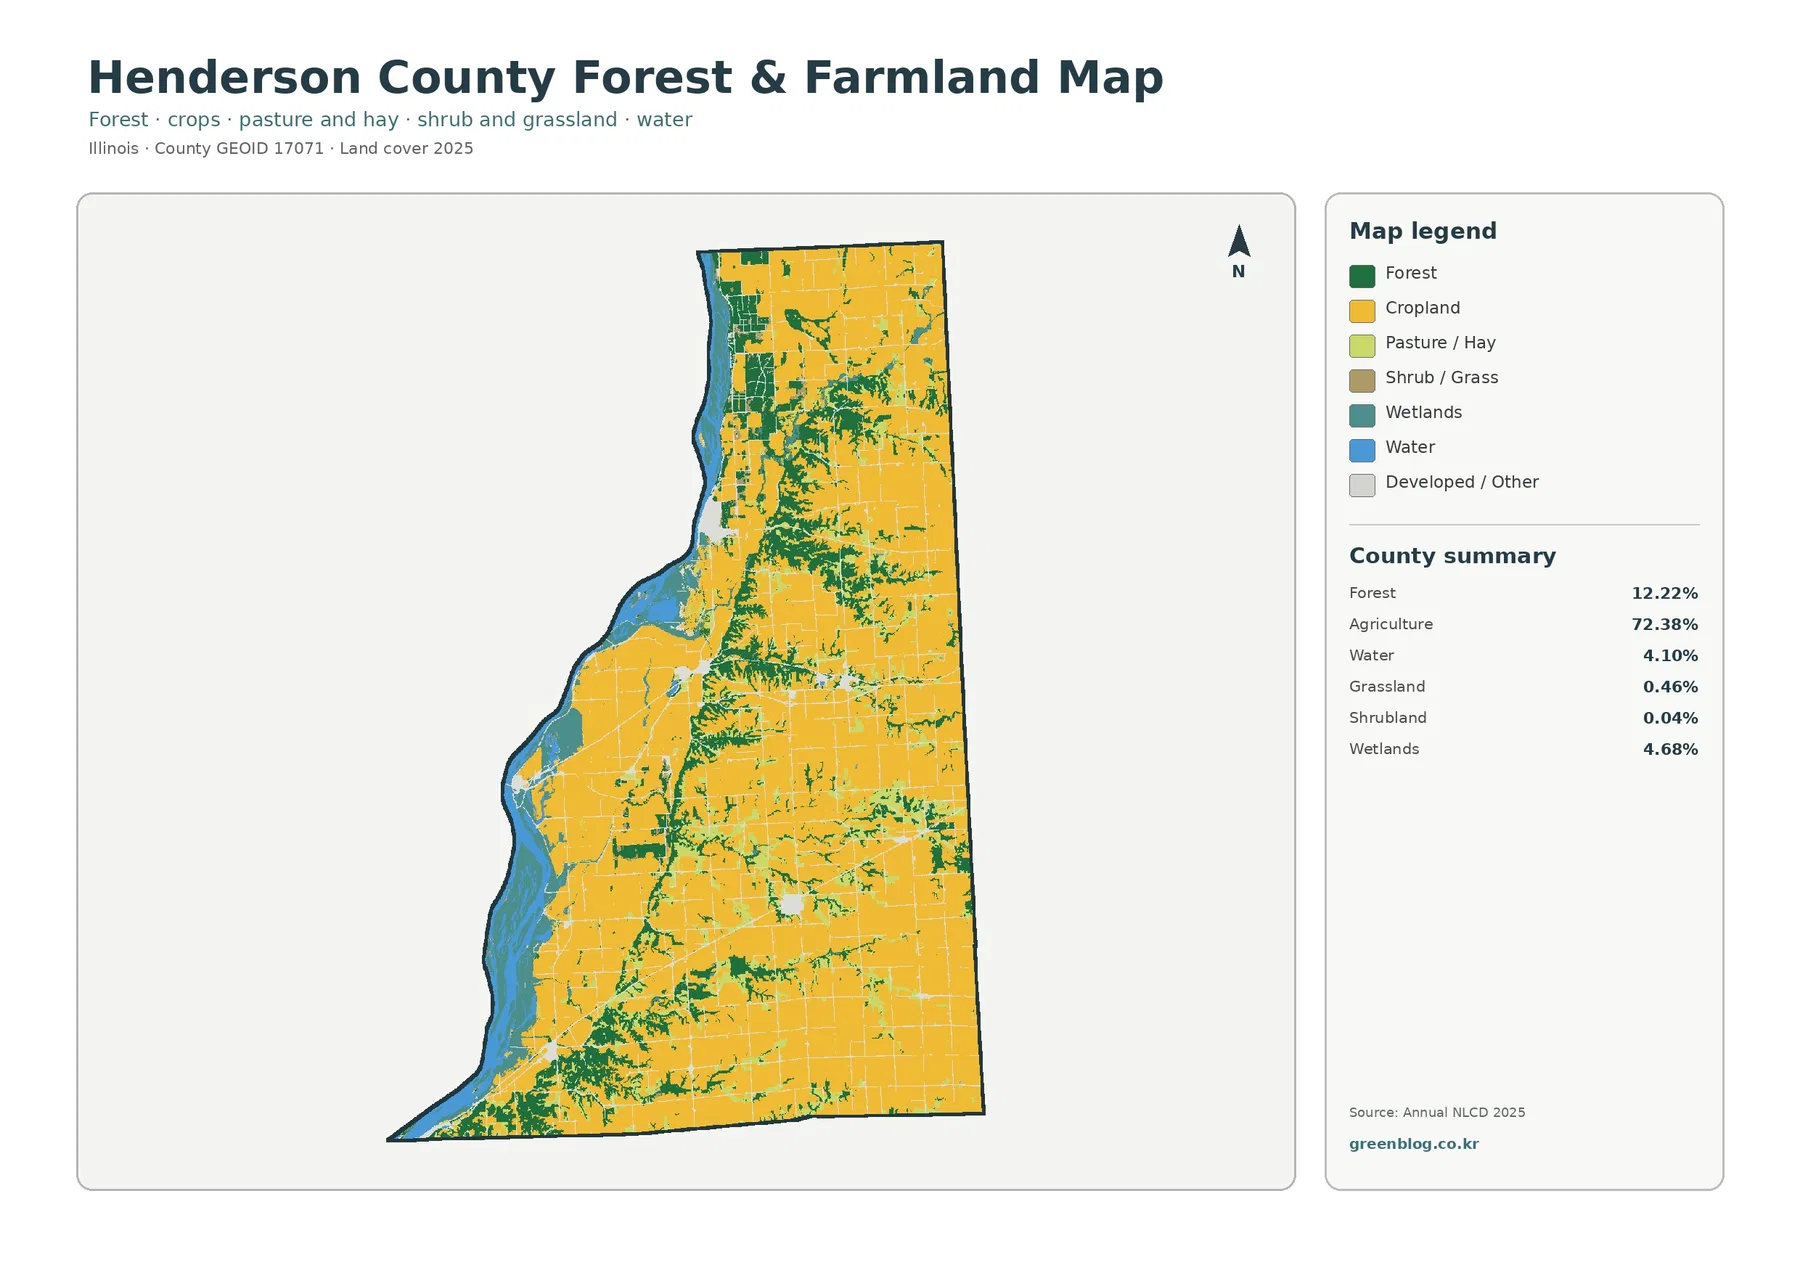
The eastern side contains some of the broadest uninterrupted agricultural areas. Farther west, the pattern becomes more complex as forest, wetlands, and water appear more frequently beside fields. That transition is useful for teaching or presentation graphics because it shows how a farm-dominant county can contain strong local contrasts without changing its countywide dominant class.
Grassland accounts for 0.46% and shrubland for 0.04%, so neither should be presented as a major landscape type. Wetlands, by contrast, occupy 4.68% and are clearly visible along the west. The map is more informative when small classes are kept in proportion rather than described as though every legend category is equally important.
The 1985–2025 comparison is dominated by scattered “other” class differences
Henderson County has an overall 1985–2025 class-difference value of 9.28%. The summary breaks that into 0.68% classified to developed, 0.97% forest loss, 1.27% agricultural loss, and 6.04% other class difference. The large “other” component is important because it means the total cannot be interpreted as one simple trend such as urban expansion or forest conversion.
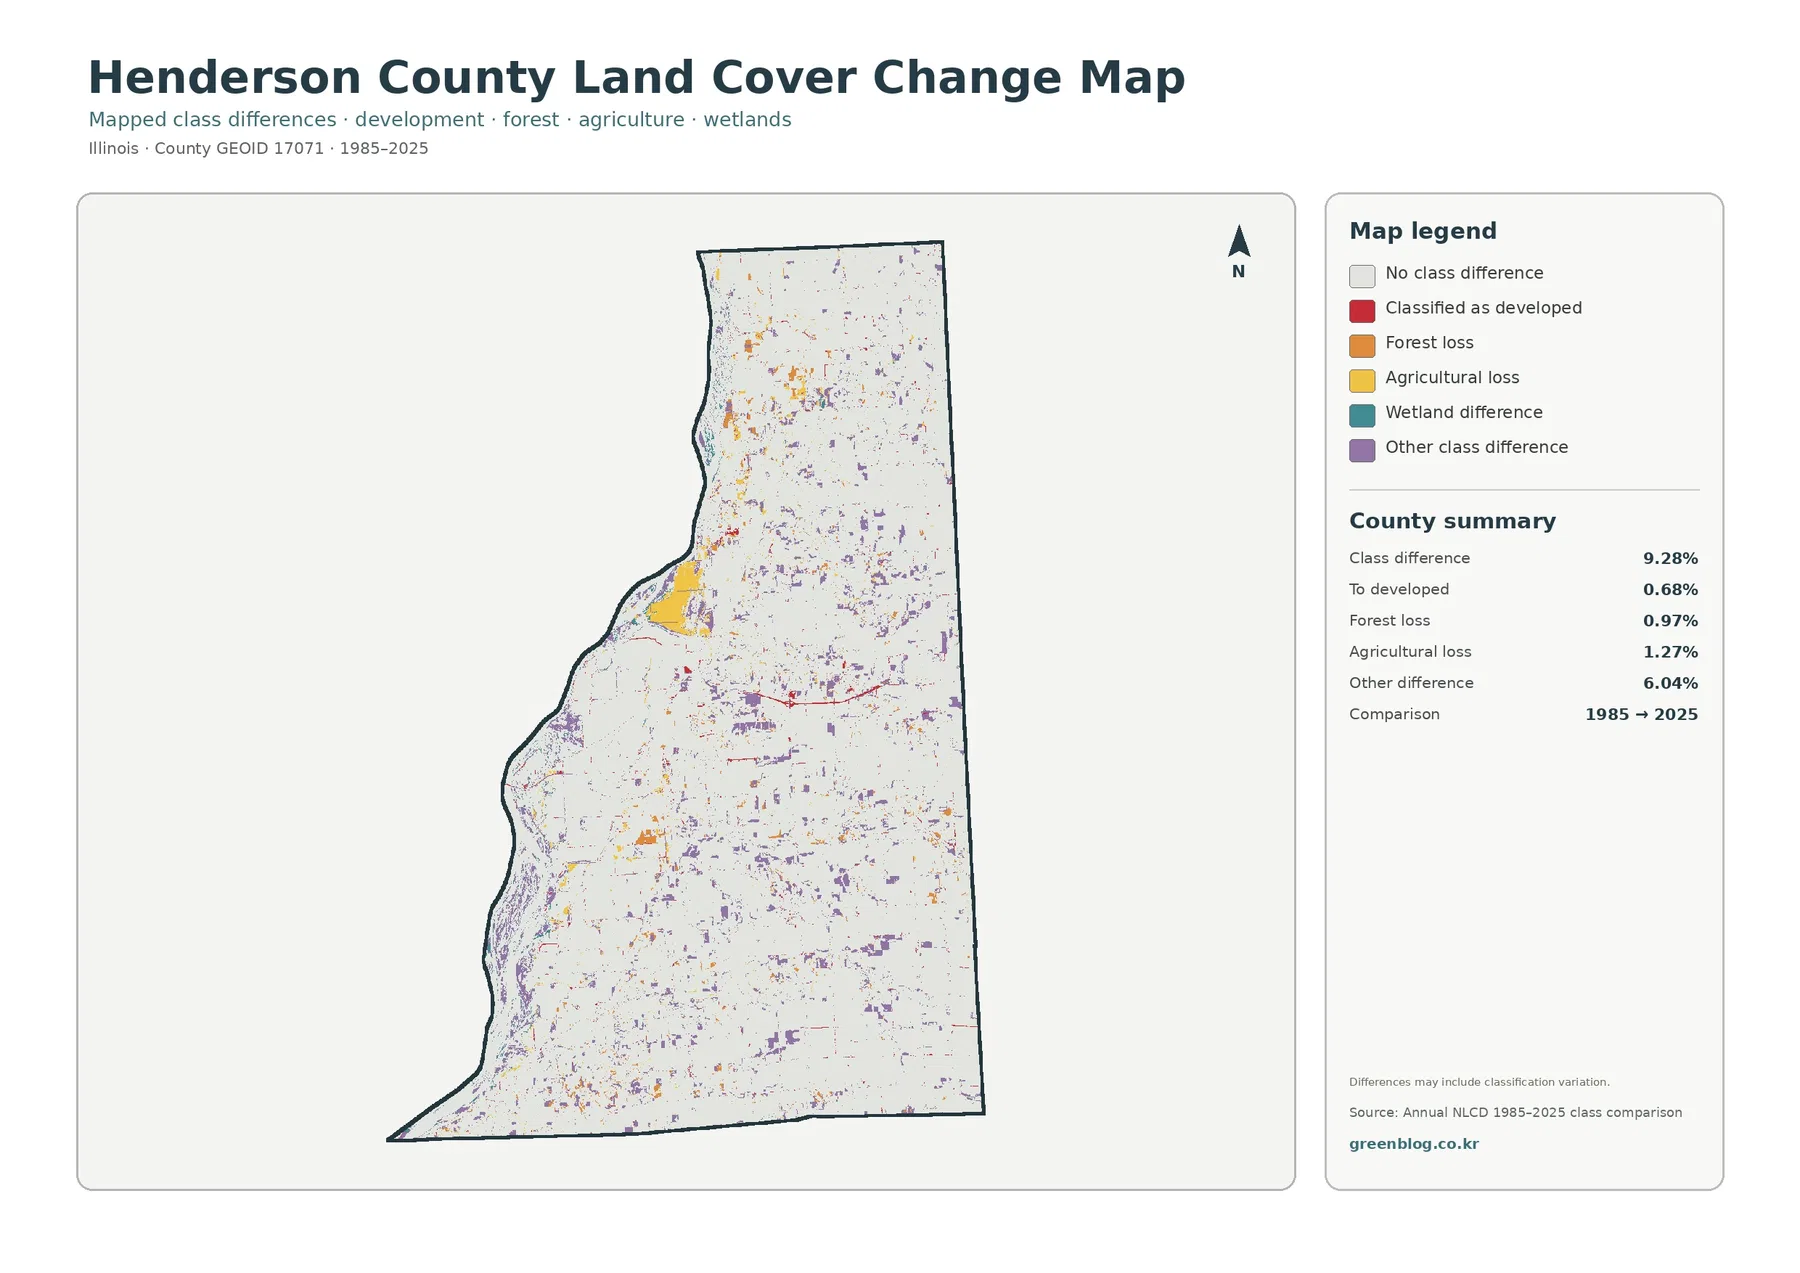
Purple “other” differences are scattered across much of the county, with several noticeable patches in the north and middle. Yellow agricultural-loss and orange forest-loss cells also appear in multiple small areas. Red developed differences are present around some built centers and road segments, but they occupy a much smaller share than the countywide total.
A class difference can reflect real surface change, but it can also be influenced by imagery, classification methods, vegetation condition, moisture, or mixed pixels. The map itself notes that differences may include classification variation. For a specific site, the change map should therefore be treated as a starting point rather than final proof of what physically happened between 1985 and 2025.
Different map questions call for different views
For a countywide overview, the general land cover map is the most efficient choice because it puts agriculture, forest, developed land, wetlands, and water in one frame. The forest-and-farmland map is better when the goal is to compare fields with wooded cover and to emphasize how the western side differs from the eastern agricultural interior.
Questions about roads, rooftops, parking, or other hard surfaces are better handled with the impervious map. The 1985–2025 comparison has a separate job: it identifies cells with different classifications at two endpoints. Keeping that distinction clear prevents a time-comparison map from being mistaken for a current land-use map.
Raster resolution generalizes narrow roads, wetland edges, and small forest pieces
Annual NLCD products are commonly represented with roughly 30-meter raster cells. A raster divides the ground into a grid and assigns each cell a representative class or value. If a cell contains more than one surface—such as a field next to a road or forest beside wetland—the mapped result simplifies that mixed ground into a single classification or impervious percentage.
This matters along Henderson County’s irregular western water-and-wetland edge, in narrow forest strips inside agricultural areas, and around small road corridors. The mapped boundary is not a parcel survey. Forest colors do not identify ownership or protected status, wetland colors do not establish legal wetland limits, and developed classes do not define zoning.
The 2025 map is also a snapshot of one classification year. Later construction, crop rotation, changing water levels, vegetation shifts, or forest management are not automatically included. The 1985–2025 map compares only two endpoints, so it does not reconstruct every intermediate change. These maps are most useful for county-scale pattern comparison and for identifying places that merit more detailed review.
Frequently Asked Questions
What is the largest 2025 land-cover class in Henderson County?
Agriculture is the largest class at 72.38%. Forest follows at 12.22%, developed land at 5.95%, wetlands at 4.68%, and water at 4.10%. The western edge contains the strongest concentration of water and wetlands.
Why is developed land 5.95% while mean impervious cover is only 1.43%?
Developed land-cover classes can include lawns, trees, soil, and other permeable surfaces in addition to pavement and rooftops. Impervious cover measures the hard-surface fraction separately, so the countywide mean can be much lower.
Does the 9.28% 1985–2025 class difference represent confirmed physical conversion?
Not necessarily. It counts cells with different classifications at the two endpoints. Real surface change may be included, but imagery, classification methods, vegetation, moisture, and mixed pixels can also affect the result. Other class difference is 6.04%.
Map File Information
The download combines four original JPG maps for Henderson County: 2025 land cover, forest and farmland, impervious/developed land, and the 1985–2025 land-cover class comparison.
- Included Versions: Land Cover Map, Forest & Farmland Map, Impervious/Developed Land Map, and 1985–2025 Land Cover Change Map
- File Type: One ZIP containing four JPG files
- Intended Use: agriculture and forest comparison, wetland and water context, built-surface review, class-change reference, teaching, and presentations
Related Maps
- Adams County Illinois Land Cover Map
- Alexander County Illinois Land Cover Map
- Bond County Illinois Land Cover Map
Sources and references
- MRLC Annual NLCD Data – official access point for Annual NLCD land-cover and impervious-surface products.
- USGS Annual NLCD Land Cover Classification – official documentation for land-cover classes and interpretation of the raster product.
- U.S. Census Bureau TIGER/Line Shapefiles – official geographic boundary source used to identify Henderson County.
Green Map creates custom-edited map images using open geographic data sources such as geoBoundaries, Natural Earth, OpenStreetMap, and government open data.
These maps are edited visual materials, not raw data files, and are provided for education, documents, presentations, and graphic reference.