Hamilton County, Illinois is dominated by agricultural cover, but the map does not look uniform from one end of the county to the other. Agriculture accounts for 73.19% of the 2025 summary, while forest covers 17.67%. The strongest wooded concentration appears in the southwest and along parts of the western side, creating a clear contrast with broader farm-dominated areas farther north and east. This page compares the general land cover map, a forest-and-farmland view, an impervious-surface map, and a 1985–2025 class-difference map.
The four original JPG maps are available together in one download, while the WebP versions below make it easy to compare the patterns on the page. Use the general map for a quick countywide picture, the forest-and-farmland map for the agricultural/wooded contrast, the impervious map for built surfaces and road connections, and the change map for cells whose classifications differ between 1985 and 2025. The maps describe surface cover rather than zoning, ownership, or parcel boundaries.
Table of Contents
A 73.19% agricultural majority is interrupted most clearly by the wooded southwest
Yellow agricultural cover fills most of the northern half, much of the east, and broad central areas on the 2025 land cover map. Within those fields, thin developed lines follow the road network and small green forest patches break up some blocks. The pattern becomes noticeably different toward the southwest, where forest polygons are larger, closer together, and less isolated. That directional contrast is more informative than the countywide percentage alone because it shows where the 17.67% forest share is concentrated.
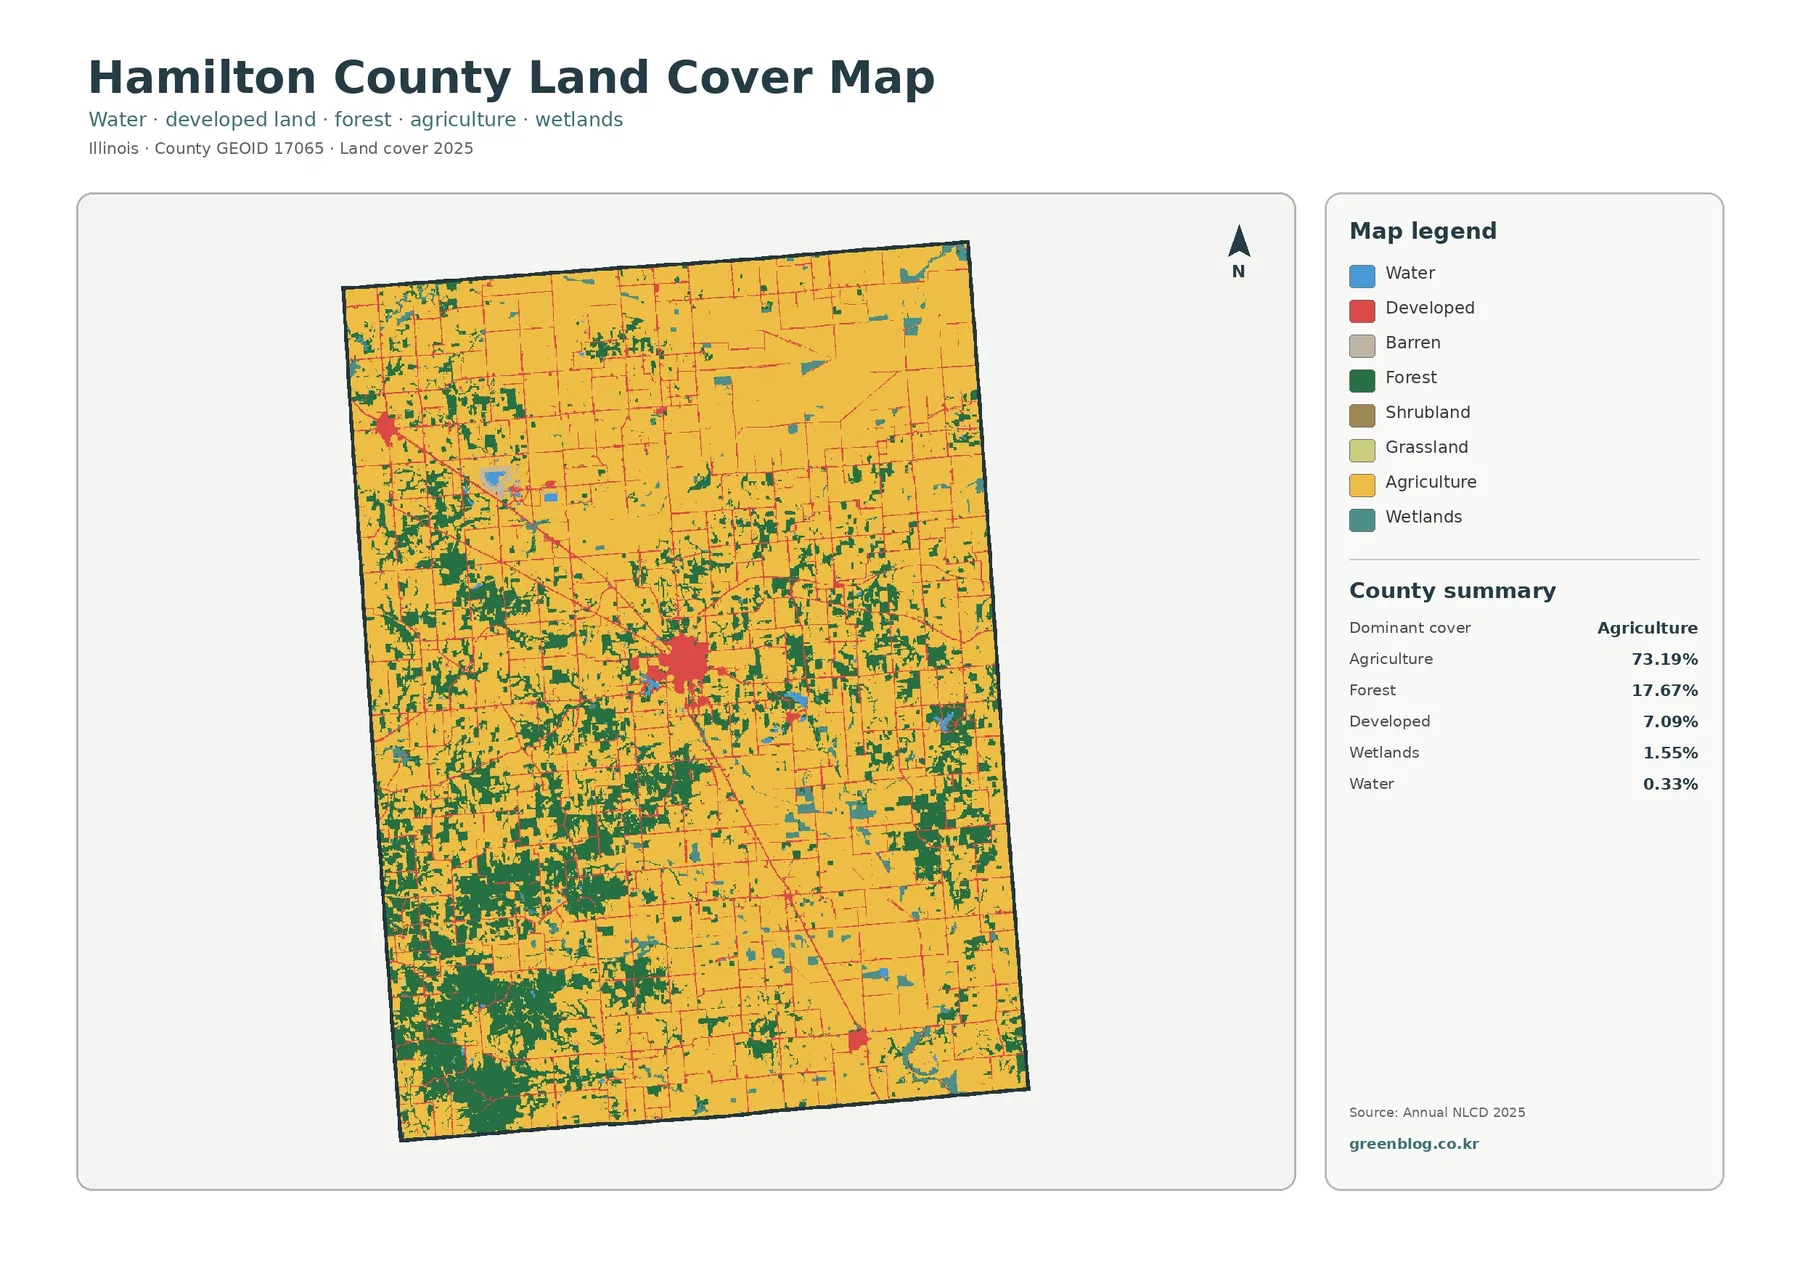
Forest is not confined to one corner. Smaller wooded blocks and narrow strips also appear through the west, south-central area, and parts of the middle of the county. In the north and northeast, however, those green patches are generally more fragmented inside large agricultural fields. The map therefore reads as a farm-dominant landscape with a stronger wooded component in the southwest rather than as two completely separate land-cover zones.
Wetlands account for 1.55% and water for 0.33% of the county summary. Their percentages are modest, yet small teal and blue patches occur in several locations and occasionally sit beside wooded cover or agricultural blocks. These features matter when comparing local edges and transitions, even though they do not define the overall county pattern. A wetland color on this map is a land-cover classification, not a legal wetland delineation or regulatory boundary.
Developed land forms one strong central cluster plus smaller separated nodes
Developed land represents 7.09% of the 2025 total. Its most prominent feature is a compact cluster near the center of the county, with narrow developed lines extending outward along roads. Several smaller nodes appear to the west, north, and southeast. Between them, the county remains largely agricultural or wooded, so the developed pattern is better described as concentrated centers connected by a thin road network than as a continuous urban surface.
The forest-and-farmland view makes the north-to-southwest contrast easier to follow
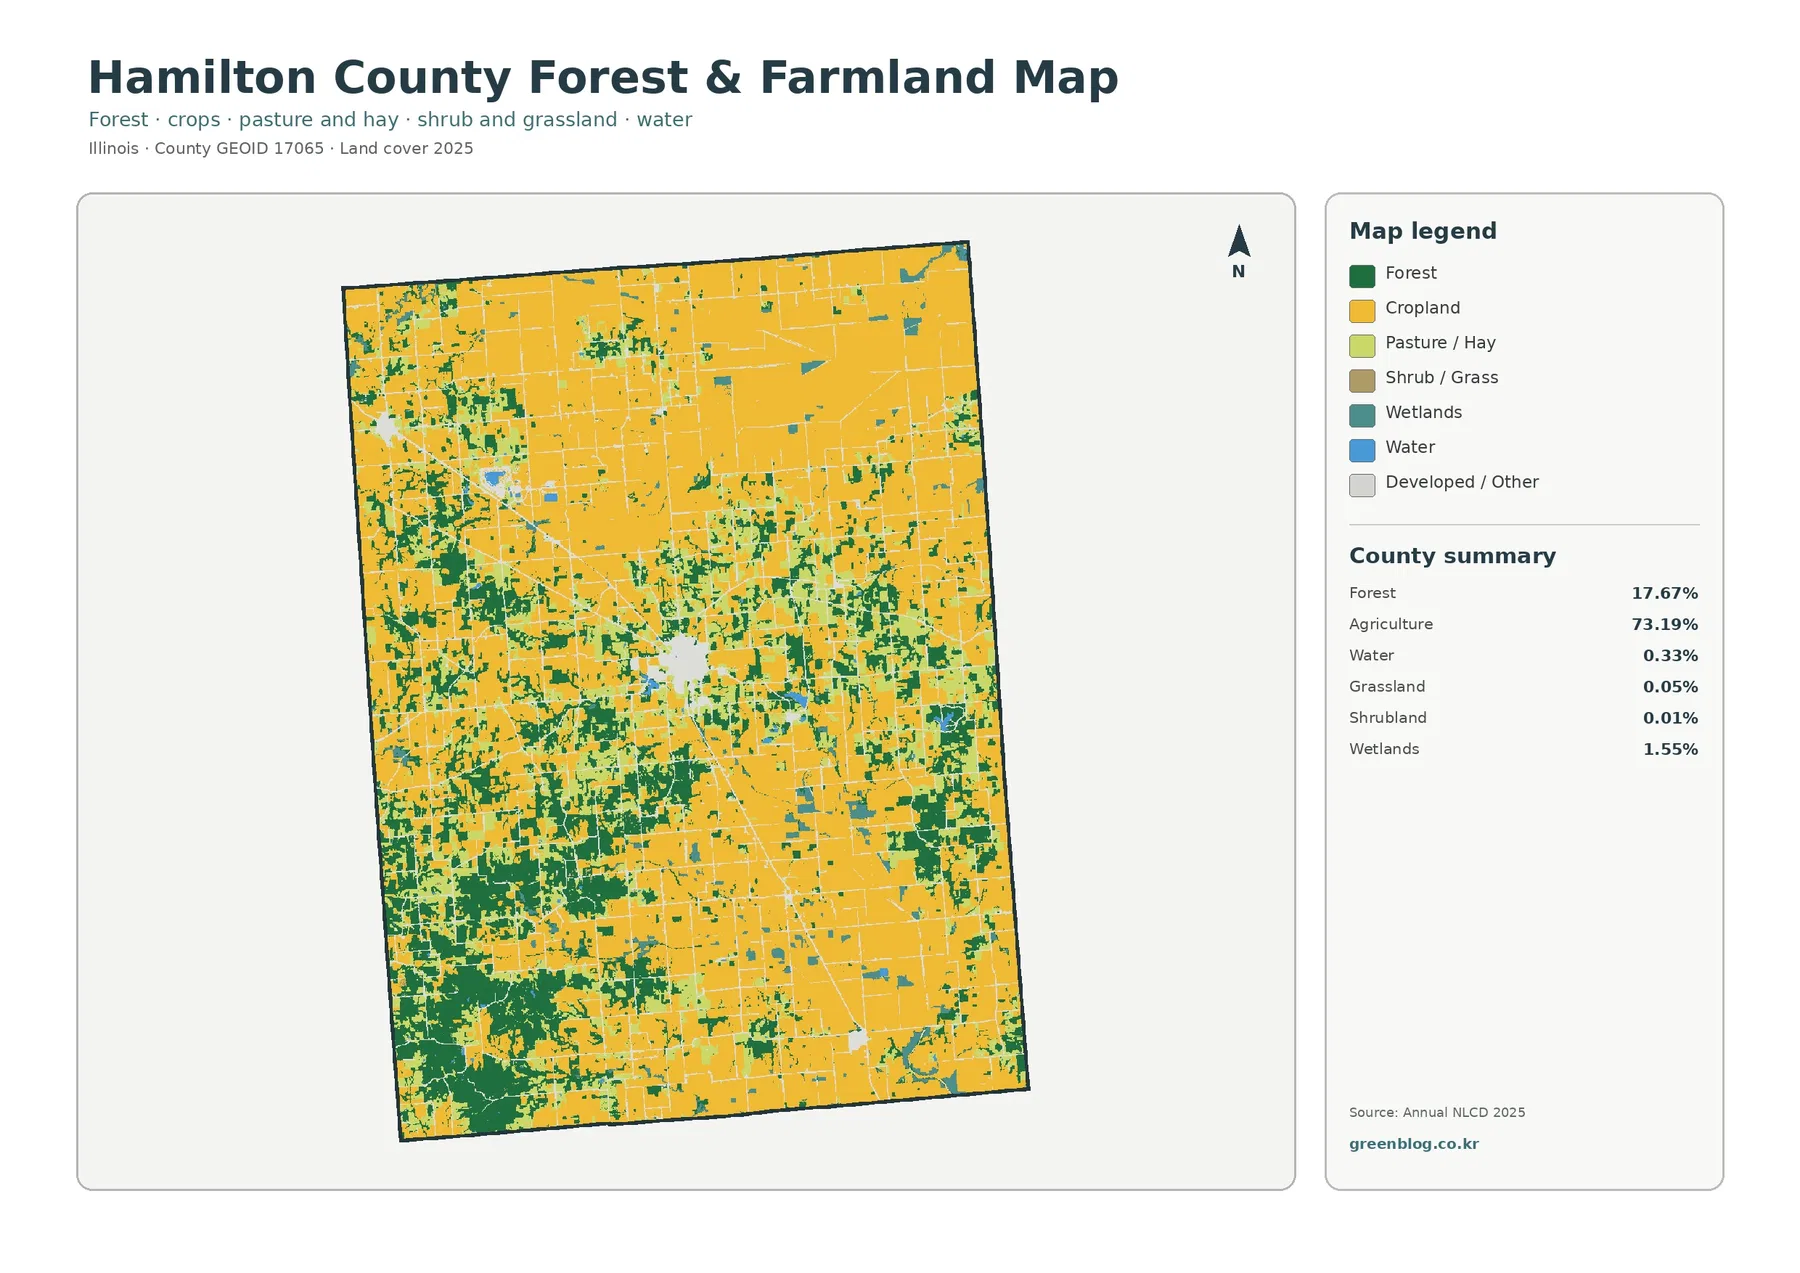
Removing much of the developed detail from the visual emphasis makes the main agricultural and wooded pattern much easier to see. Cropland and other agricultural cover form wide yellow areas across the north, east, and central portions of Hamilton County. Dark green forest occupies a larger share of the southwest and western side, with additional strips and blocks running through the middle. The result is a clearer picture of how fields and woods divide the county.
A 1.47% mean impervious value shows how limited hard-surface concentration is countywide
Impervious surface measures the fraction of each mapped area covered by hard surfaces such as roads, parking areas, and rooftops. Hamilton County has a mean impervious value of 1.47%, and only 0.30% of the mapped area falls in the 50% or greater impervious category. These values are much lower than the 7.09% developed-land share because a developed land-cover class may still contain lawns, trees, soil, or other permeable surfaces.
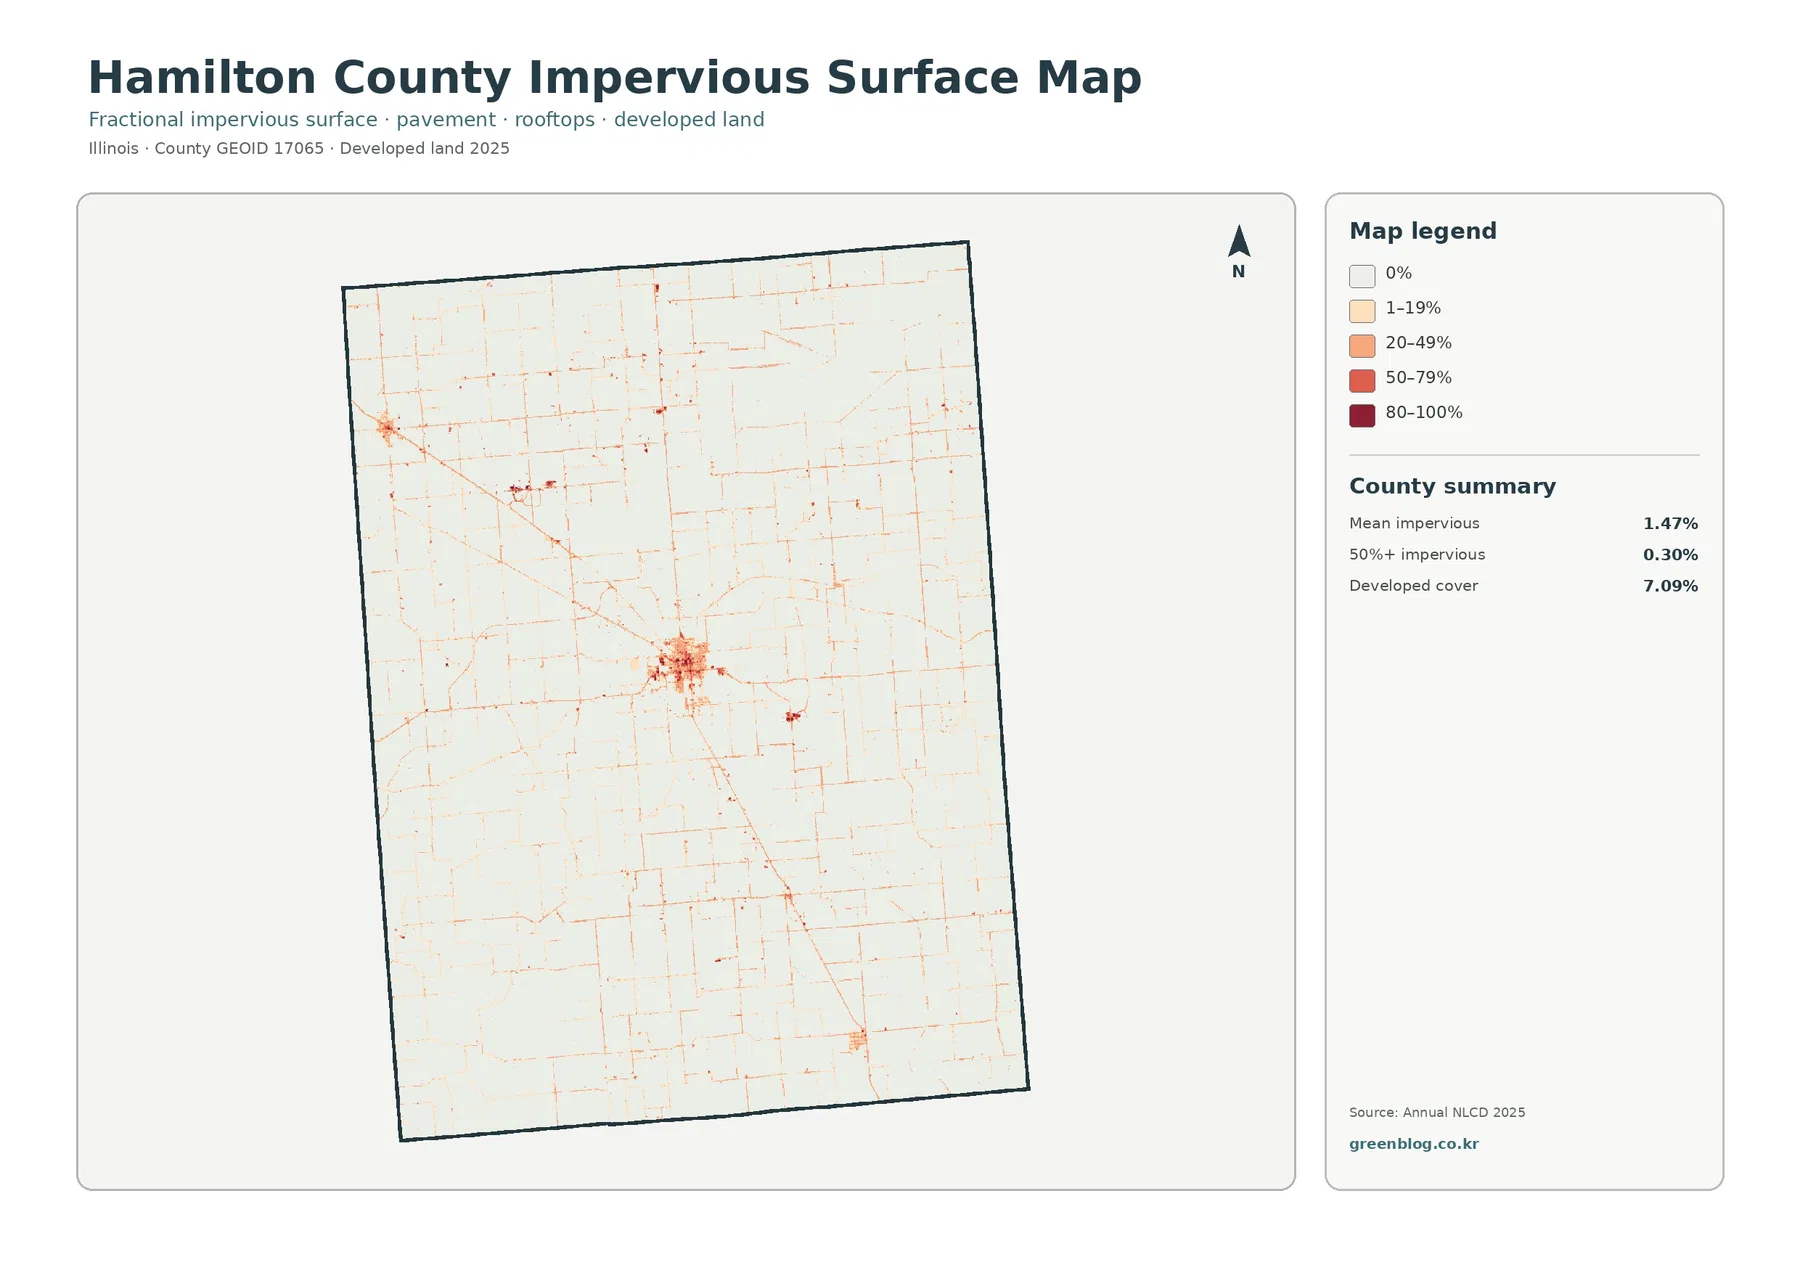
The darkest impervious colors are concentrated in the main central cluster. Thin orange and red lines trace roads outward from that center, while smaller concentrations appear at several separated locations. Most farm and forest areas remain very light on the map. That visual pattern explains why the countywide mean stays low even though the land-cover map records a noticeable developed category.
Most of the 11.43% 1985–2025 class difference falls into the “other” category
The change map marks cells whose 1985 and 2025 land-cover classifications are different. Hamilton County has an overall class-difference value of 11.43%. The summary identifies 1.11% as classified to developed, 0.67% as forest loss, 0.80% as agricultural loss, and 8.69% as other class difference. Because that last category makes up most of the total, the countywide figure should not be treated as a simple measure of development growth or forest conversion.
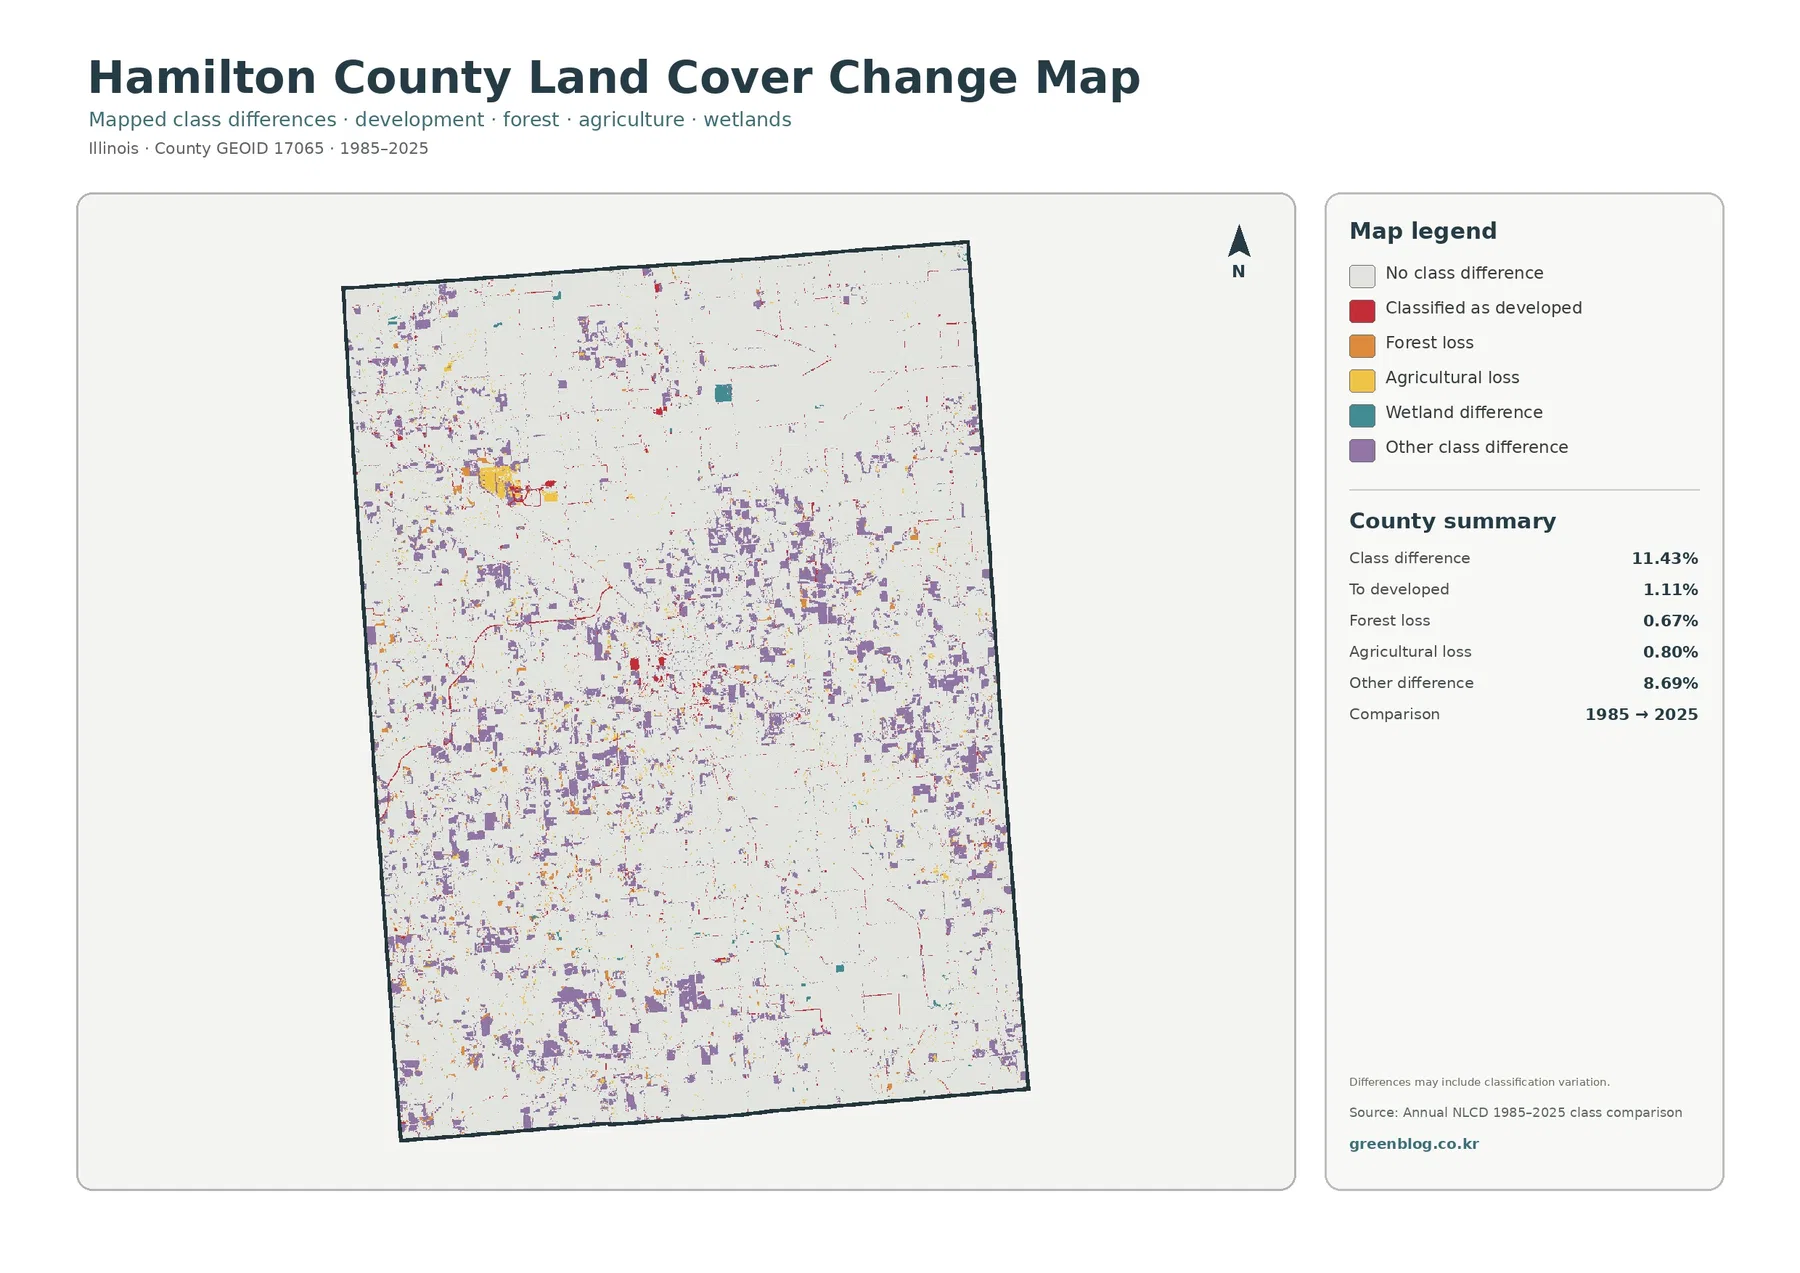
Purple “other” differences are scattered through the north, middle, and southwest rather than forming one single belt. Red developed differences are easier to notice around the central developed cluster and along a few linear connections. Orange forest-loss and yellow agricultural-loss cells appear as smaller pieces in multiple areas. The distribution supports a cautious interpretation: several kinds of class changes contribute to the total, and no single category explains the countywide 11.43% value.
Choosing the right map keeps current cover, built surfaces, and time comparison from getting mixed together
The general land cover map is the best starting point when the goal is to describe Hamilton County as a whole. It puts agriculture, forest, developed land, wetlands, and water in one frame and makes the agricultural majority and wooded southwest easy to compare. The forest-and-farmland map is more effective when the audience only needs the main field-versus-forest pattern and would be distracted by smaller developed details.
Thirty-meter raster cells generalize narrow roads, wetland edges, and small forest patches
Annual NLCD products are commonly represented with roughly 30-meter raster cells. A raster divides the surface into a grid and assigns each cell a representative class or value. Where a cell contains more than one surface—such as a field beside a road, forest beside a wetland, or a developed edge beside vegetation—the mapped result may simplify that mixed ground into one class or one impervious percentage.
The 2025 map is also a snapshot of a particular classification year. Construction, crop rotation, vegetation change, water levels, or forest management after that observation are not automatically included. Likewise, the 1985–2025 comparison uses two endpoints and does not reconstruct every change that happened in the years between them. These maps work best for county-scale pattern comparison and for identifying places where newer or more detailed information may be needed.
Frequently Asked Questions
What is the largest 2025 land-cover class in Hamilton County?
Agriculture is the largest class at 73.19%. Forest follows at 17.67%, developed land at 7.09%, wetlands at 1.55%, and water at 0.33%. The southwest contains the largest visible concentration of forest compared with the broader agricultural areas to the north and east.
Why is developed land 7.09% while mean impervious cover is only 1.47%?
Developed land-cover classes can include lawns, trees, soil, and other permeable surfaces in addition to buildings and pavement. Impervious cover measures the hard-surface fraction separately, so its countywide mean can be much lower than the developed-land percentage.
Does the 11.43% 1985–2025 class difference mean that much of the county was physically converted?
Not necessarily. The value counts cells with different classifications at the two endpoints. Real surface change may be included, but imagery, classification methods, vegetation or moisture conditions, and mixed pixels can also affect the result. Other class difference accounts for 8.69%.
Map File Information
The download combines four original JPG maps for Hamilton County: 2025 land cover, forest and farmland, impervious/developed land, and the 1985–2025 land-cover class comparison.
- Included Versions: Land Cover Map, Forest & Farmland Map, Impervious/Developed Land Map, and 1985–2025 Land Cover Change Map
- File Type: One ZIP containing four JPG files
- Intended Use: field-and-forest comparison, built-surface review, class-change reference, teaching, presentations, and county-scale environmental context
Related Maps
- Adams County Illinois Land Cover Map
- Alexander County Illinois Land Cover Map
- Bond County Illinois Land Cover Map
Sources and references
- MRLC Annual NLCD Data – official access point for Annual NLCD land-cover and impervious-surface products.
- USGS Annual NLCD Land Cover Classification – official documentation for the land-cover classes and interpretation of the raster product.
- U.S. Census Bureau TIGER/Line Shapefiles – official geographic boundary source used to identify Hamilton County.
Green Map creates custom-edited map images using open geographic data sources such as geoBoundaries, Natural Earth, OpenStreetMap, and government open data.
These maps are edited visual materials, not raw data files, and are provided for education, documents, presentations, and graphic reference.