Franklin County in Southern Illinois has a 2025 land-cover pattern that cannot be summarized as farm country alone. Agriculture is the largest class at 58.96%, but forest accounts for 15.61%, developed land 12.45%, wetlands 7.74%, and water 4.98%. The large water body in the north-central part of the county, wetland-rich surroundings, wooded tracts, and several built-up centers give the map a much more varied appearance than the agricultural percentage by itself suggests.
The four maps on this page separate those patterns so they are easier to compare. The general map provides the full 2025 countywide picture, while the forest-and-farmland view removes much of the developed detail. The impervious map isolates hard surfaces such as pavement and rooftops, and the change map compares mapped classes in 1985 and 2025. All four original JPG maps are available together in one ZIP download, while the WebP versions can be viewed directly in the article.
Table of Contents
Rend Lake gives the northern half of Franklin County a very different land-cover pattern from the farm-dominated east
The most visually prominent feature on the general map is the broad blue area in the north-central county. Franklin County’s official website describes the county as a gateway to the Rend Lake area, and Illinois Department of Natural Resources material identifies Rend Lake as a reservoir shared by Franklin and Jefferson counties. On the land-cover map, the water is bordered in many places by wetlands, forest, and smaller developed patches, creating a concentrated natural-cover zone that stands apart from the broad agricultural areas farther east.
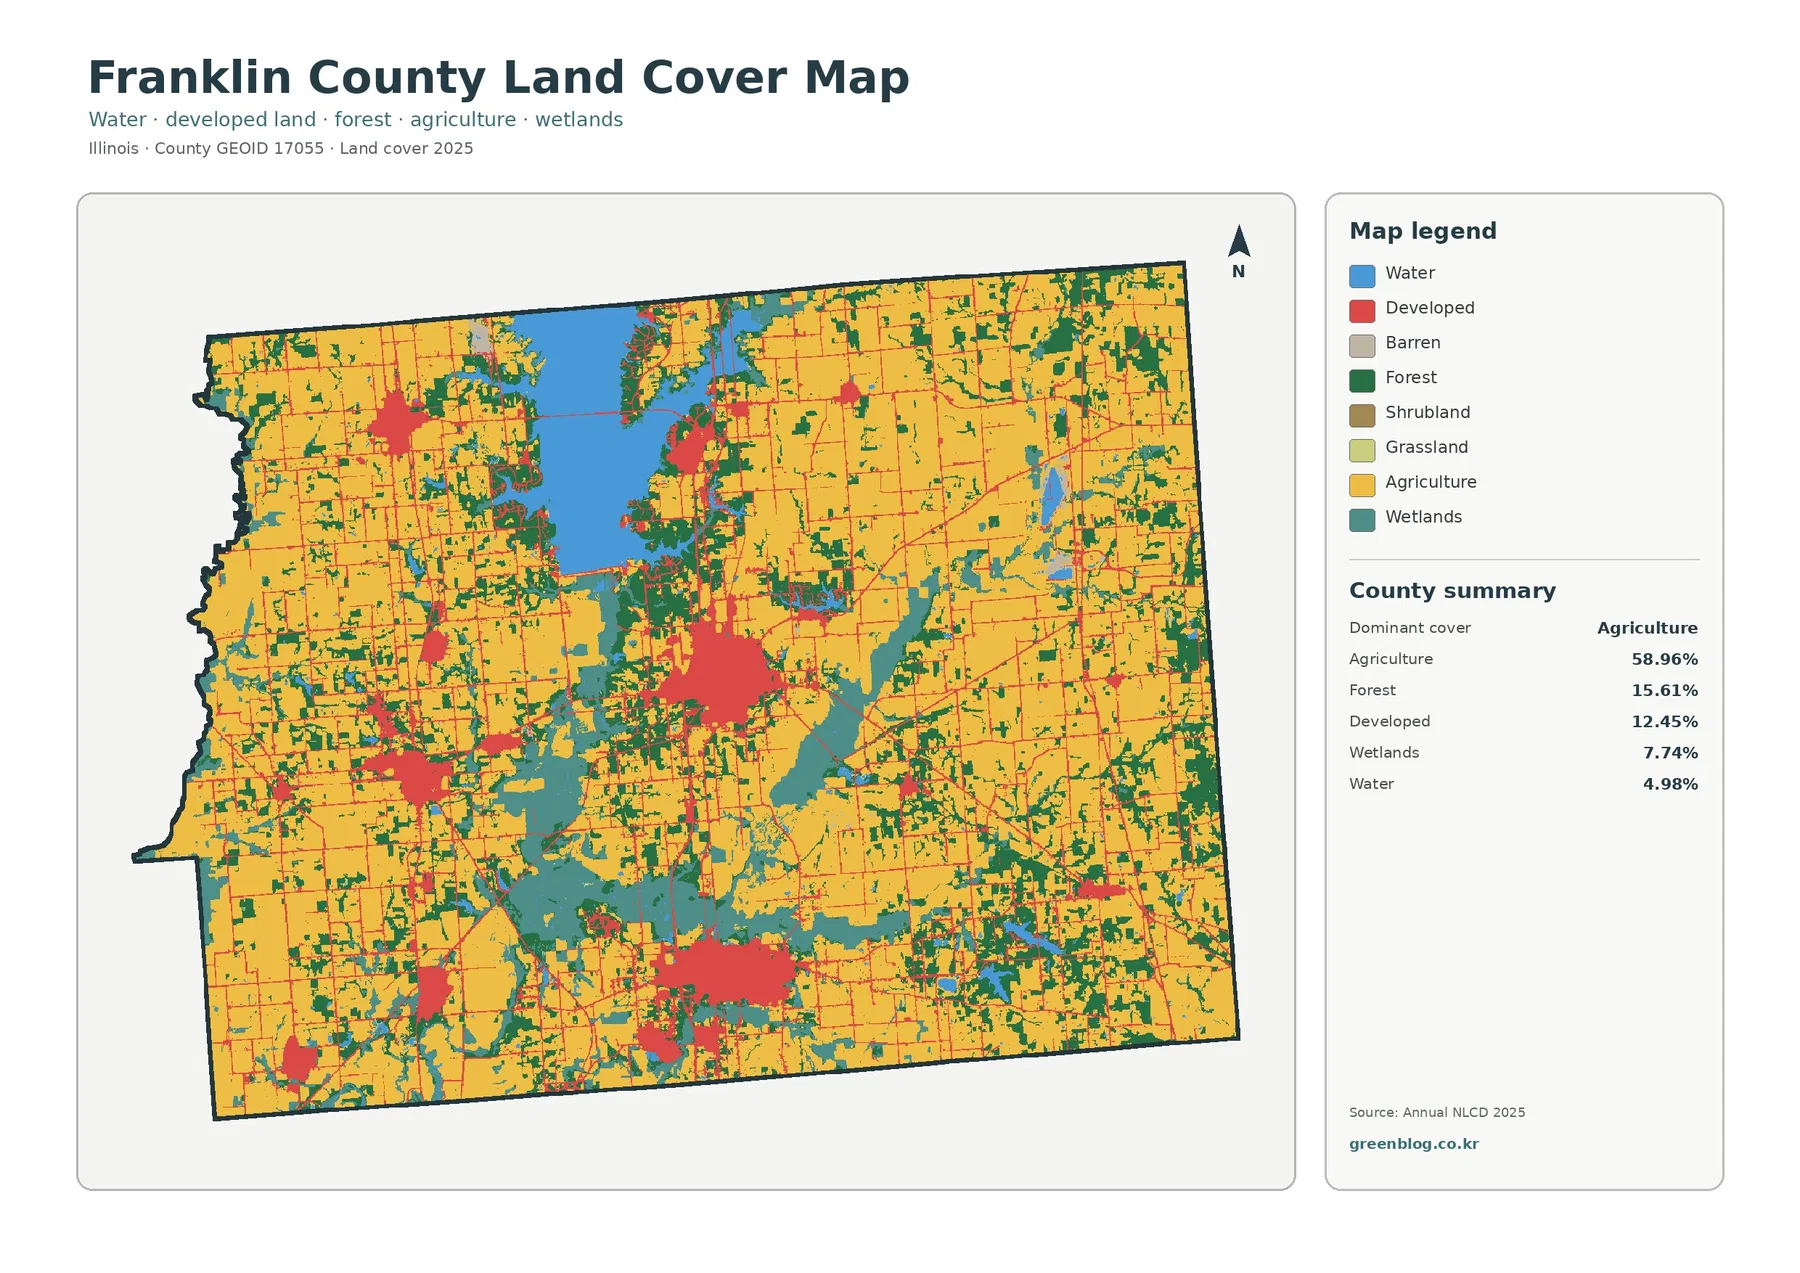
Agriculture still occupies most of the mapped area. Large yellow blocks cover much of the east, southeast, and northeast, and substantial farm areas also extend through the western half. Forest is less continuous, but it forms broad patches and branching belts in the south, west, and around the lake. Wetlands are especially noticeable around water features and in several interior bands. Because water and wetlands are clustered instead of evenly spread, their local importance is much greater than a simple countywide percentage might imply.
The 2025 summary helps put those colors in proportion. Forest, wetlands, and water together account for more than one-quarter of the county, so natural cover is not limited to a few isolated fragments. Developed land reaches 12.45%, yet most of it is concentrated in separate centers and corridors rather than forming one continuous urban area. This combination of farms, wooded cover, wetlands, open water, and compact development makes Franklin County useful for comparing how very different surfaces can occupy the same county.
Land cover is not the same thing as zoning, parcel ownership, legal land use, or buildability. Annual NLCD classifies the physical surface represented in each raster cell, such as crops, forest, water, wetland, or developed cover. A cell classified as agriculture does not identify a farm boundary or crop type, and a developed cell does not tell whether the land is residential, commercial, industrial, or legally available for construction. The map is most appropriate for county-scale pattern analysis.
The impervious map separates compact built-up centers from the much larger developed-land class
Franklin County looks almost empty of dark color when the map is reduced to impervious surfaces. Mean impervious cover is 2.94%, and only 1.21% of the county is mapped at 50% impervious or greater. The darkest cells cluster in several built-up centers, especially near the middle and south of the county, while pale linear features extend outward along the road network. Smaller concentrations also appear in the west and northwest.
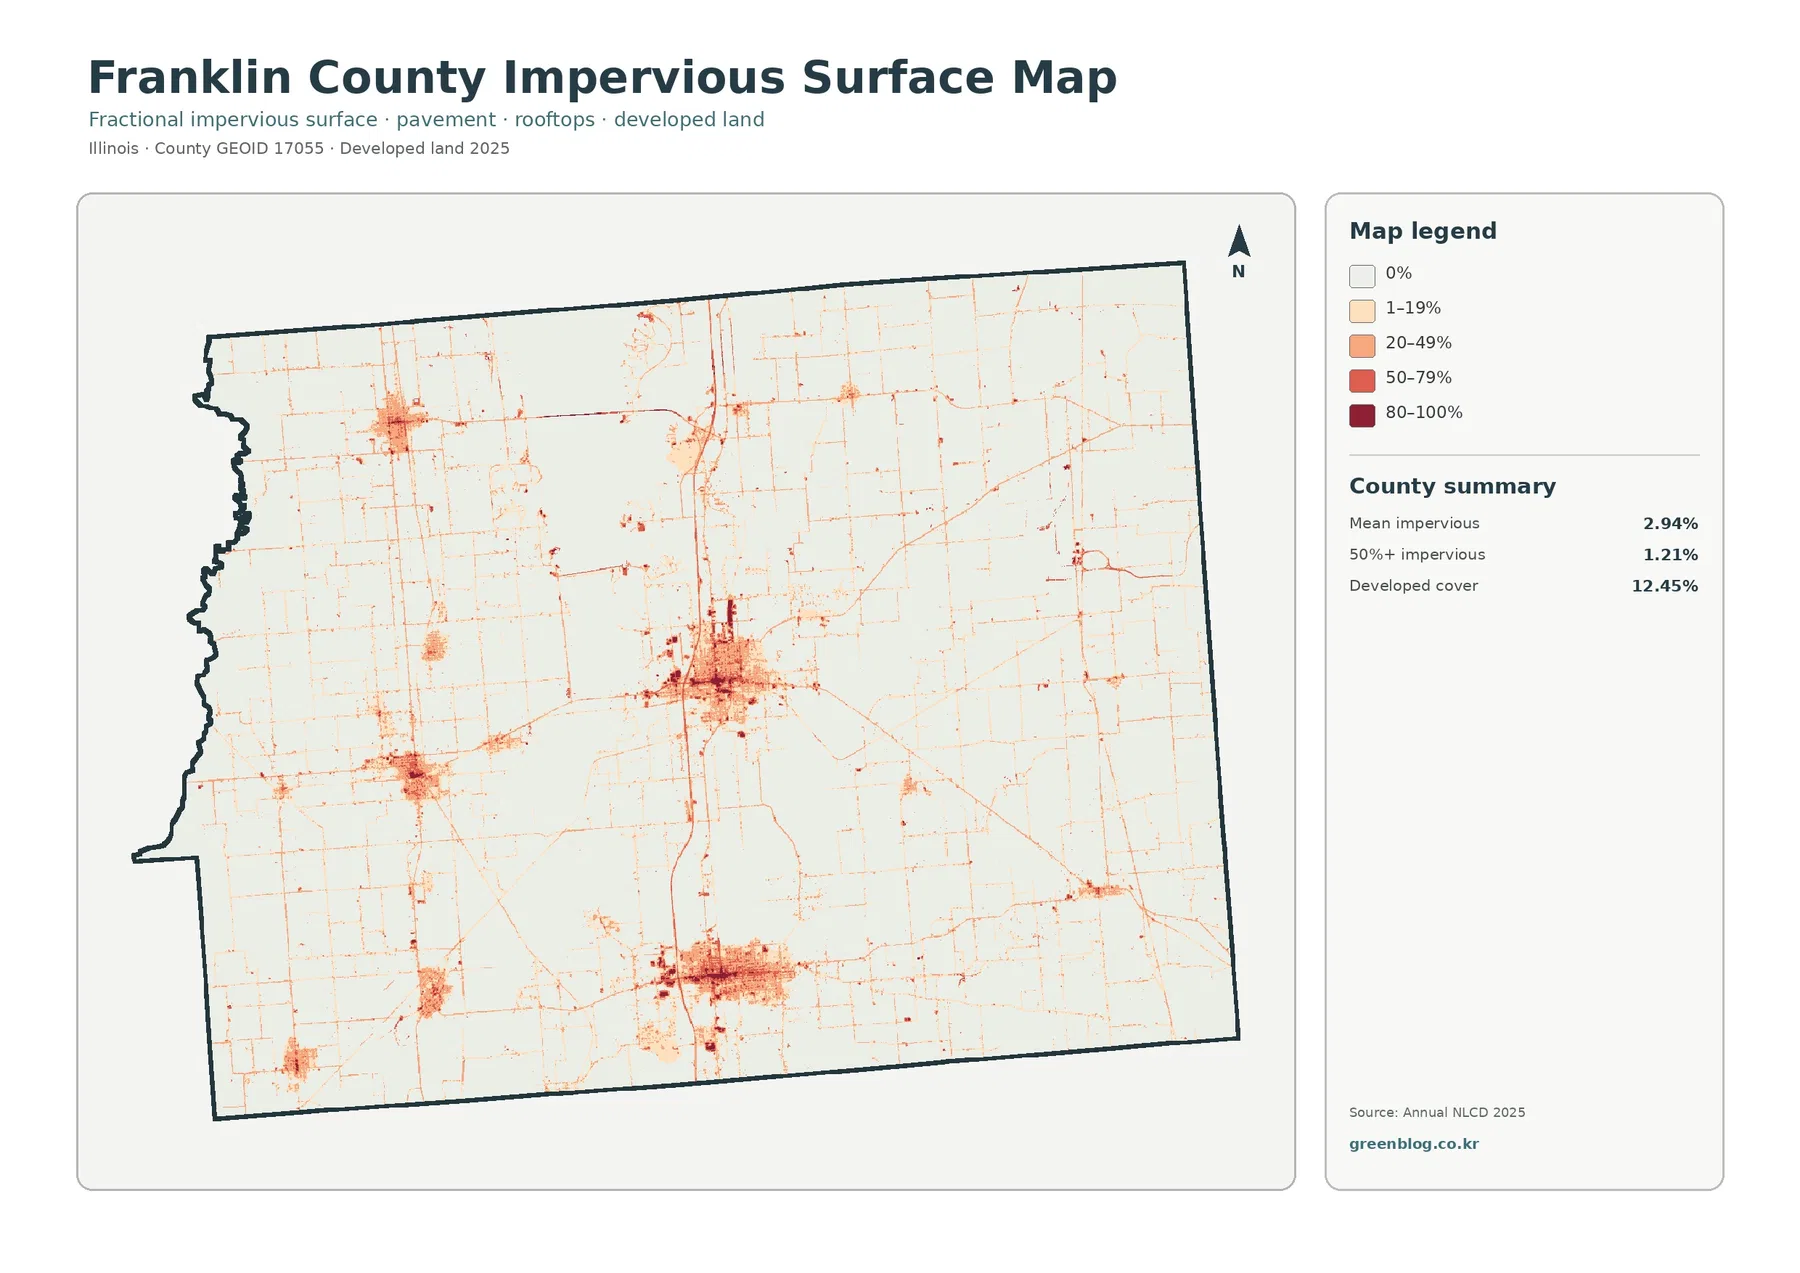
Impervious surface means pavement, rooftops, parking areas, and similar surfaces that do not readily absorb water. That measure is different from the 12.45% developed-land share because a developed cell may also contain lawns, trees, bare soil, or other permeable surfaces. The difference between 12.45% developed land and a 2.94% mean impervious value is therefore expected and should not be treated as a contradiction.
The county government identifies Benton as the county seat and notes that Interstate 57 provides major access through the area. Those facts help explain why transportation and settlement context matters when reading the impervious map, but the land-cover image itself does not draw municipal boundaries or label every highway. The darker built-up clusters should be understood as mapped surface concentrations rather than exact city limits. For municipal planning or parcel-level work, local transportation and zoning records are the appropriate next step.
For presentations, the impervious map is useful because it reveals the intensity of hard surfaces more directly than the general land-cover map. A broad developed class may include low-density neighborhoods with considerable vegetation, while a dark impervious cell represents a much higher share of pavement or rooftops. Showing the two maps together helps explain why developed land and impervious cover answer related but different questions.
Forest and farmland form a strong east-west contrast, with more wooded cover around water and across the south
The forest-and-farmland map removes much of the visual competition from developed land and makes the county’s agricultural structure easier to see. Cropland dominates the eastern half, especially the northeast, east-central, and southeast. Forest becomes more frequent toward the south and west, where green patches interrupt the farm pattern. Around the north-central water area, forest and wetlands create a more complicated edge around the lake than the simple countywide totals convey.
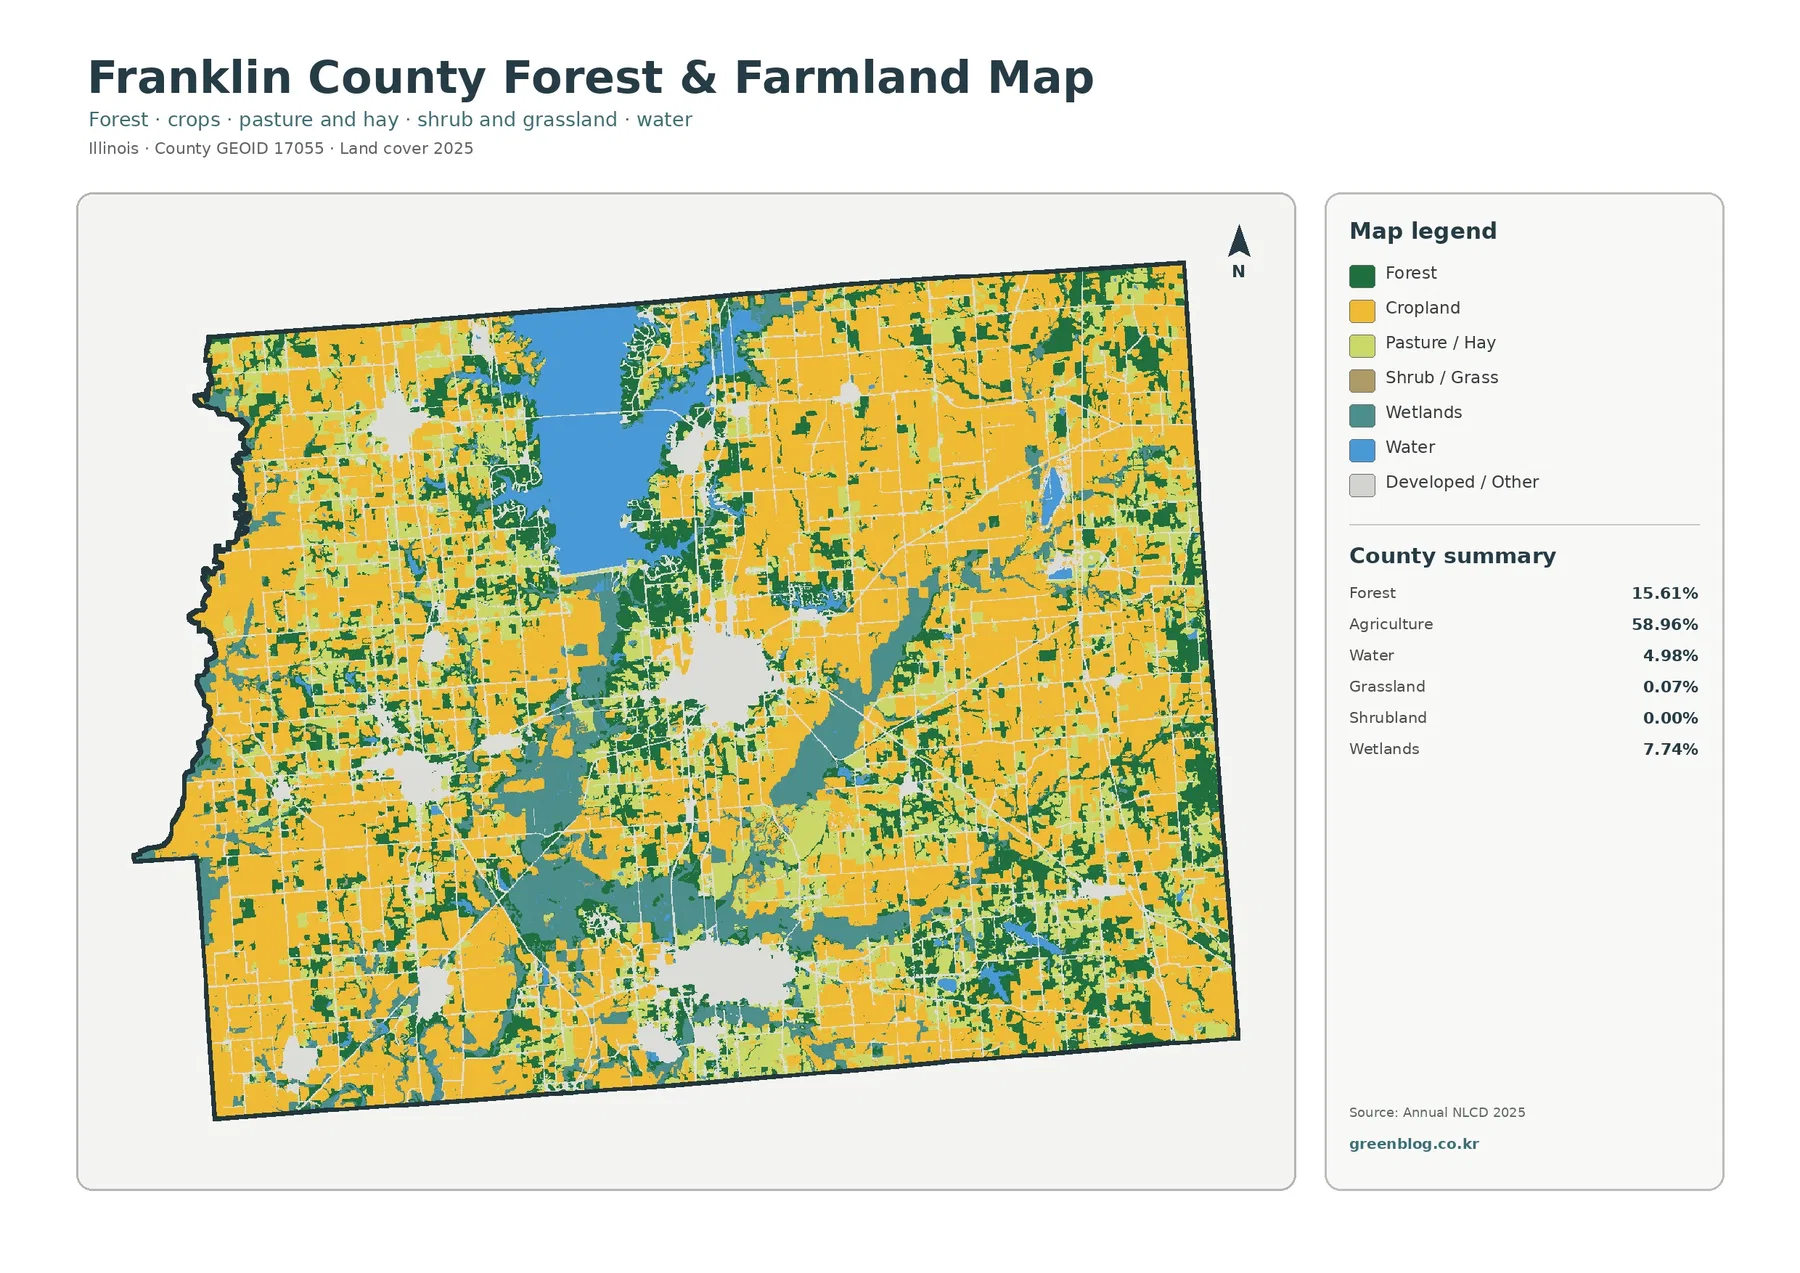
A 15.61% forest share is much smaller than agriculture, but the map shows why that figure should not be dismissed as background. Wooded cover is geographically concentrated and forms recognizable blocks in the southern and western parts of the county. In places it follows branching or irregular shapes through the farm landscape. Those shapes may correspond with terrain or drainage features, but the land-cover map alone does not establish a cause. Elevation, soils, stream data, or historical land-use records would be needed to explain why a particular patch remains forested.
Wetlands account for 7.74%, a substantial share compared with many heavily agricultural county landscapes. The class is strongest near Rend Lake and along several interior bands, where it often appears close to water and forest. Water covers 4.98%, dominated visually by the large reservoir but also including smaller water features. The Illinois DNR describes the Rend Lake State Fish and Wildlife Area as a landscape that includes bottomland hardwoods, agricultural fields, and managed impoundments, providing official context for the mixed cover visible near the lake.
Grassland and shrubland are minor classes in the supplied summary, so they do not define the countywide pattern in the way agriculture, forest, wetlands, water, and developed land do. They may still matter for habitat or site-specific studies, but this article keeps the emphasis on the classes that are clearly visible and quantitatively important in the provided maps. That approach avoids turning a general map page into an unsupported inventory of every possible surface type.
The 1985–2025 comparison is dominated by ‘other class difference,’ not one single direction of land conversion
The change map compares two classified endpoints rather than reconstructing every year between them. Across Franklin County, 14.68% of the area is mapped with a different class in 1985 and 2025. The summary identifies 1.71% as classified to developed, 0.88% as forest loss, and 1.15% as agricultural loss. The largest component by far is other class difference at 10.63%, which is why the total should not be described as 14.68% urban growth, forest removal, or farmland loss.
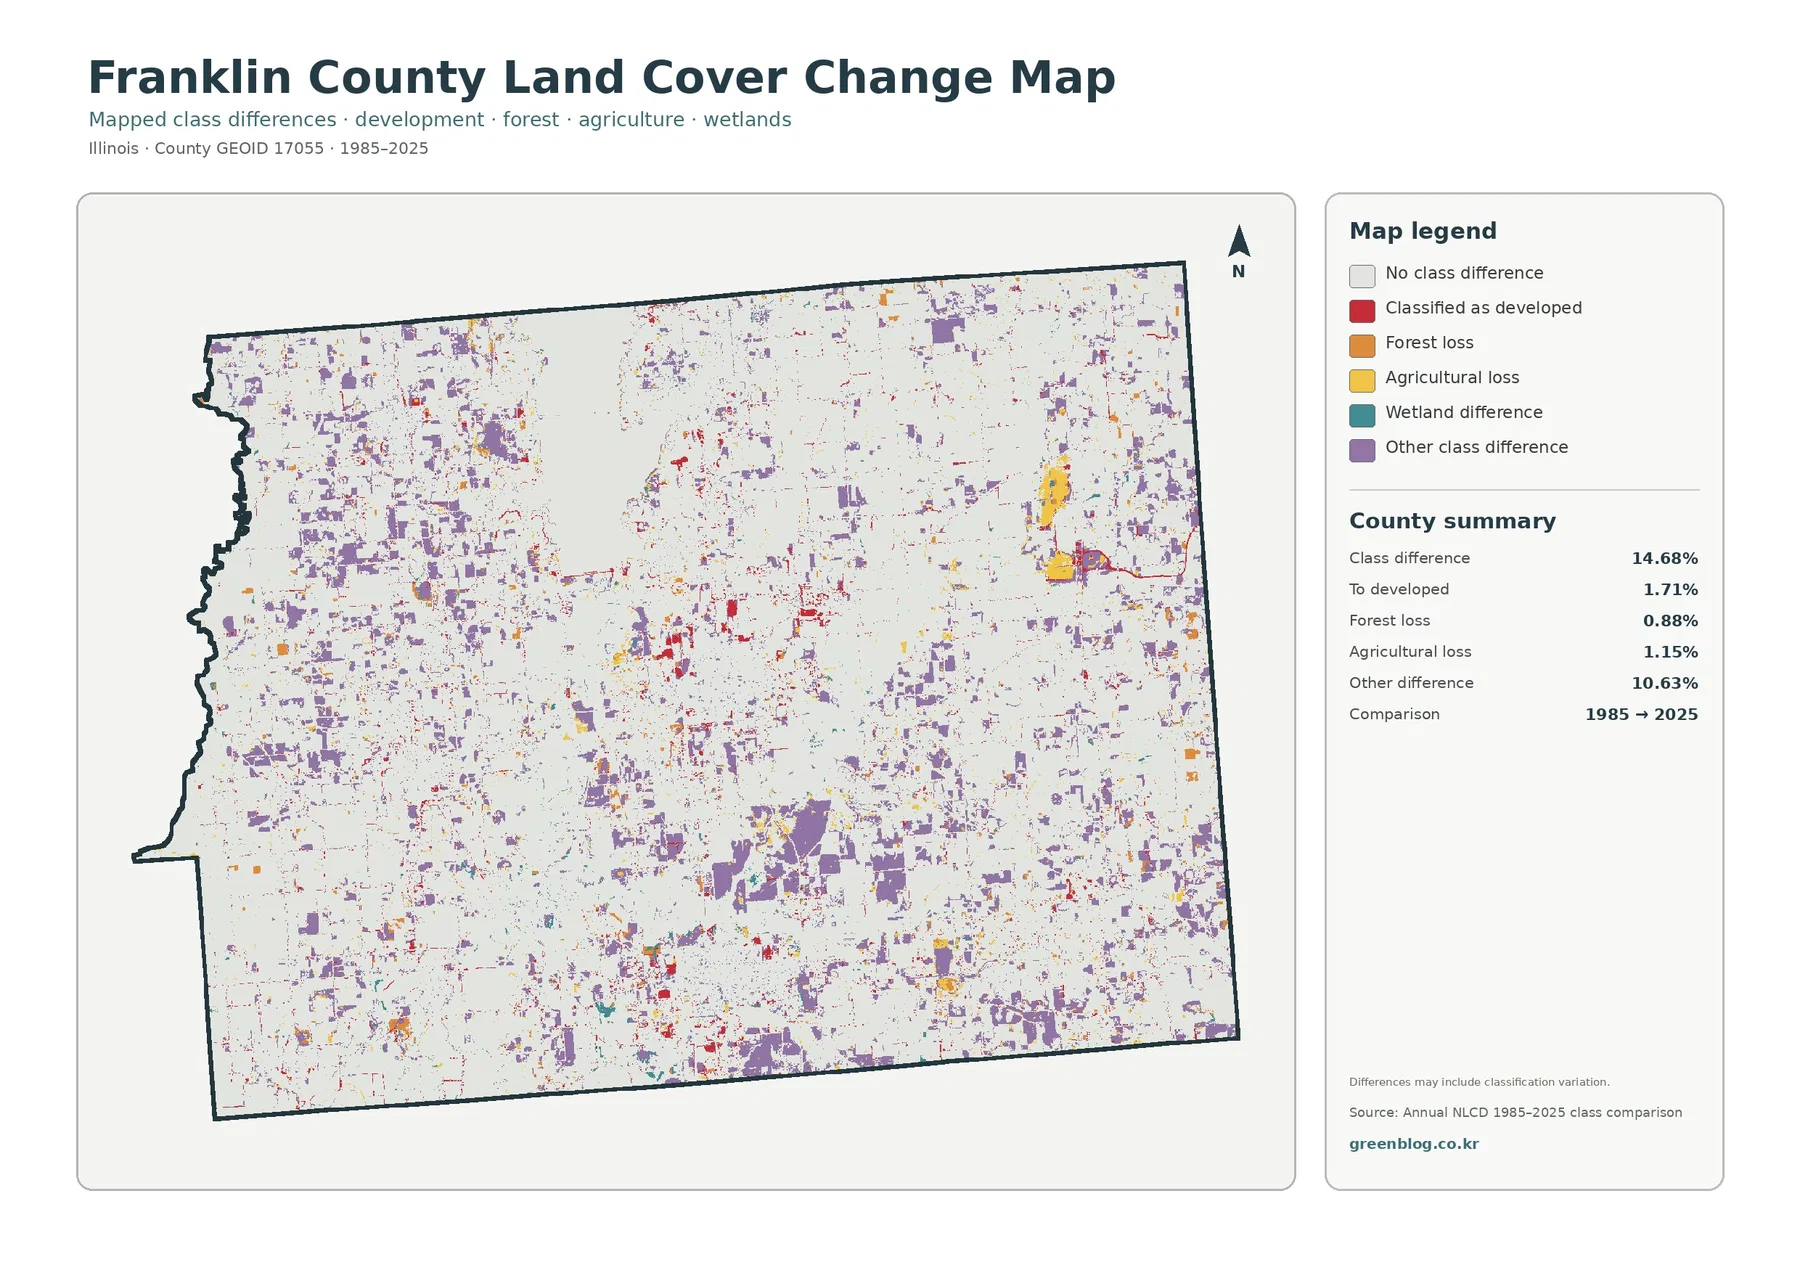
Purple other-difference cells are scattered widely through the county, including agricultural areas in the west, south, and northeast. Red cells associated with classification to developed occur near some existing built-up centers and corridors, but they occupy a relatively small share of the total map. Forest-loss and agricultural-loss colors also appear as many small patches rather than one broad front. Around the lake and other water-related areas, several difference categories occur close together.
A mapped class difference means that the two endpoint classifications do not match. Real land-cover conversion may be part of the explanation, but classification methods, image conditions, mixed pixels, and shifts along class boundaries can also contribute. A mixed pixel is a raster cell that contains more than one surface type, such as forest next to farmland or wetland next to open water. Small changes in the dominant signal can cause that cell to receive a different class in another year.
Anyone investigating a specific field, forest patch, wetland, or developed site should therefore treat the change map as a screening layer rather than final evidence. Intermediate Annual NLCD years, historical aerial photographs, local property records, and agency data can show whether a particular location changed physically and when that change occurred. The two-date map is strongest as a countywide comparison tool.
The map set works best when each layer is matched to a specific question
For a general county profile, the first map is the best starting point because it shows the balance among farms, forest, development, wetlands, and water at once. A lesson focused on agricultural and wooded cover can switch to the forest-and-farmland version, where the east-west contrast is easier to follow. The impervious map is better for built-surface discussions, especially when comparing compact centers with the broad rural road network. The change layer should be reserved for questions about differences between 1985 and 2025.
Rend Lake makes the set especially useful for watershed and habitat education. The general map shows the concentration of water and wetlands, while the simplified forest-and-farmland view shows how wooded and agricultural areas meet that water-related landscape. An instructor can then add stream networks, watershed boundaries, or wildlife-management maps from official sources without asking the land-cover layer to provide information it was not designed to show.
County-to-county comparison also benefits from using the same year and map type. Franklin County’s 58.96% agricultural share means more when it is considered alongside the 15.61% forest, 7.74% wetland, and 4.98% water shares and their actual locations. A purely visual comparison can be misleading when county size or a large reservoir changes the overall impression, while percentages alone can hide concentration. Reading the summary and the spatial pattern together avoids both problems.
The downloadable JPG set is useful for printing, classroom slides, presentation graphics, and side-by-side comparison with neighboring counties. The images can also serve as background context before more specialized layers are added. They should not be used as surveyed property maps, legal wetland determinations, or zoning maps. Their strength is consistent county-scale visualization.
Thirty-meter raster cells and observation dates set the practical limits of the maps
Annual NLCD land-cover products use a raster grid. In the standard land-cover product, the landscape is divided into 30-meter cells and each cell receives a representative class. Narrow tree rows, small ponds, road edges, individual buildings, and complicated farm-forest boundaries can therefore be generalized. A crisp color boundary on the map should not be read as a surveyed boundary on the ground.
This limitation matters around Rend Lake, where water, wetland, forest, agriculture, and developed surfaces can meet within short distances. It also matters in the wooded southern and western parts of the county, where narrow forest strips weave through farm areas. A wetland-colored cell is not a legal wetland boundary, and a forest cell does not establish ownership or conservation status. Developed cover is not a zoning designation.
The 2025 map represents the classification for that observation period and will not include construction, vegetation change, crop management, or water-level changes that occur afterward. Likewise, the 1985–2025 comparison does not show the path between the endpoints. Recent aerial imagery, current local records, and updated agency datasets are necessary when the latest site condition matters.
Frequently Asked Questions
What is the largest land-cover class in Franklin County?
Agriculture is the largest 2025 class at 58.96%. Forest follows at 15.61%, developed land at 12.45%, wetlands at 7.74%, and water at 4.98%. Rend Lake and the surrounding wetland and forest cover create a strong contrast with the broad agricultural areas.
Why is developed land 12.45% while mean impervious cover is only 2.94%?
Developed land can include lawns, trees, soil, and other permeable surfaces together with buildings and pavement. Impervious cover measures hard surfaces such as roads, rooftops, and parking areas more directly, so the two percentages describe different things.
Does the 14.68% change figure mean that 14.68% of Franklin County was physically converted?
Not necessarily. The 14.68% figure is the area with different mapped classes in 1985 and 2025. Only 1.71% is listed as classified to developed, 0.88% as forest loss, and 1.15% as agricultural loss, while 10.63% is other class difference. Classification variation and mixed pixels can contribute to the result.
Map File Information
The ZIP contains four original JPG maps for Franklin County: 2025 land cover, forest and farmland, impervious/developed land, and the 1985–2025 land-cover class comparison.
- Included Versions: land cover, forest and farmland, impervious/developed land, and 1985–2025 land-cover change
- File Type: ZIP containing four JPG files
- Intended Use: printing, classroom presentations, farm/forest comparison, Rend Lake context, built-surface analysis, and county-to-county comparison
Related Maps
- Adams County Illinois Land Cover Map
- Alexander County Illinois Land Cover Map
- Bond County Illinois Land Cover Map
Sources and references
- MRLC Annual NLCD Data – official access to Annual NLCD land-cover and related datasets.
- USGS Annual NLCD Land Cover Classification – definitions and background for the Annual NLCD land-cover classes.
- U.S. Census Bureau TIGER/Line Shapefiles – official geographic boundary data, including county boundaries.
- Franklin County, Illinois – Our County – county government background on Benton, I-57 access, and the Rend Lake area.
- Illinois DNR – Rend Lake State Fish and Wildlife Area – official information on the managed water, agricultural, and wooded environments around Rend Lake.
Green Map creates custom-edited map images using open geographic data sources such as geoBoundaries, Natural Earth, OpenStreetMap, and government open data.
These maps are edited visual materials, not raw data files, and are provided for education, documents, presentations, and graphic reference.